ISSN Online: 2160-0406 ISSN Print: 2160-0392
DOI: 10.4236/aces.2018.84021 Oct. 26, 2018 298 Advances in Chemical Engineering and Science
Development of Dispersion Models for the
Simulation of Fluid Catalytic Cracking of
Vacuum Gas Oil in Riser Reactor
Kenneth Kekpugile Dagde
Department of Chemical/Petrochemical Engineering, Rivers State University, Port Harcourt, Nigeria
Abstract
Dispersion models for the simulation of an industrial Fluid Catalytic Crack-ing Riser Reactor have been developed. The models were developed based on the principle of conservation of mass and energy on the reacting species due to bulk flow and axial dispersion. The four-lump kinetic scheme was used to describe the cracking reactions occurring in the reactor. The model equations were a set of parabolic Ordinary Differential Equations which were reduced to first order differential equations by appropriate substitutions and inte-grated numerically using 4th order Runge Kutta algorithm using Visual Basic
6.0. Results obtained showed a maximum percentage deviation ranging from 0.31% to 5.7% between model predictions and industrial plant data indicating reasonable agreement. Simulation of model at various operating parameters gave optimum gasoline yield of 45.6% of the most significant variable of temperature (658 K), superficial velocity (0.1 m/s), catalyst to gas oil ratio (7.0) and diffusion coefficient of 0.23 m2/s.
Keywords
Modelling and Simulation, Axial Dispersion, Vacuum Gas Oil, Riser Reactor, Visual Basic 6.0
1. Introduction
The Fluid Catalytic Cracking Unit (FCCU) is a very important unit in the refi-nery. This unit is often referred to as the “cash cow” of all refining operations, since it cracks heavy residual stocks recovered from other refinery operations into more valuable hydrocarbons. Fluid catalytic cracking employs an extremely hot circulating fluidized bed catalyst to crack the high molecular weight hydro-How to cite this paper: Dagde, K.K.
(2018) Development of Dispersion Models for the Simulation of Fluid Catalytic Cracking of Vacuum Gas Oil in Riser Reac-tor. Advances in Chemical Engineering and Science, 8, 298-310.
https://doi.org/10.4236/aces.2018.84021
Received: April 18, 2018 Accepted: October 23, 2018 Published: October 26, 2018
Copyright © 2018 by author and Scientific Research Publishing Inc. This work is licensed under the Creative Commons Attribution International License (CC BY 4.0).
DOI: 10.4236/aces.2018.84021 299 Advances in Chemical Engineering and Science carbons into low molecular weight hydrocarbons [1].
Circulating fluidized beds are especially useful in processes involving high gas and solids flux, and in catalytic reactions requiring quick catalyst regeneration [2]. Depending on the flow direction of the feed stream and catalyst bed, the circulat-ing fluidized bed reactors are classified as: downer reactor—for downward flow, and riser reactor—for upward flow direction [3] [4]. Studies have shown that the downer is more efficient than the riser because both gas and solids flow downward in the same direction by gravity. The radial gas and solid flow structures are much more uniform in the downer, than the riser. Many studies have been carried out to help in the design and operation of fast fluidized bed reactions [5]. Among the many parameters of interest is the axial distribution of the cross-sectional averaged bed voidage, which is useful in understanding the gas and solids flow patterns in the bed. This parameter also provides essential information for optimal design and operation of a circulating fluidized bed reactor.
In the F.C.C.U., the atomized feed (vacuum gas oil) is sprayed into the reac-tor, where it comes in contacts with extremely hot fluidized bed of catalyst that supplies the heat required for the cracking reaction. The cracking process is en-dothermic and takes place in few seconds. The hot catalyst vaporizes the feed and catalyzes the cracking reactions that breakdown the high molecular weight oil into higher components, including; gasoline, liquefied petroleum gas (LPG), fuel gas and coke. The hydrocarbon mixture flows to the main fractionator via cyclones for separation into: fuel gas, LPG, gasoline, high cycle oil and main-column bottom (decanted oil). The spent catalyst is disengaged from the cracked hydrocarbon vapours and reactivated in a regenerator by burning the coke deposited on its active surface. This regeneration reaction is exothermic. Fernandes et al. [6] used a six-lump, one dimensional (1D) model to simulate the riser of an industrial FCCU. Their model predicted a gasoline yield of 48%. However, the assumption of 1D plug flow and negligible dispersion by the au-thors oversimplified their models thereby undermining the accuracy of the pre-dictions. [7] [8] [9] [10] used four-lump, 1D model in their investigations. Their models predicted the temperature drop along the riser reactor. The major limi-tation of their models was the assumption of negligible dispersion. A five-lump and six-lump reactions scheme were used by [11] [12]. The latter author also based their investigations on negligible dispersion which contradicts the basic principles of heterogeneous catalysis especially for porous catalyst such as the FCC zeolite catalyst. A one dimensional steady state model of an industrial riser reactor considering bulk flow and dispersion were presented in this study. A four-lump reaction scheme was used to model the FCC reactions [12]. Models were integrated numerically using a code written in Visual Basic 6.0 program-ming language. Data used for the simulation were sourced from an existing op-erational industrial plant and from literature.
2. Dispersion Riser Reactor Model
DOI: 10.4236/aces.2018.84021 300 Advances in Chemical Engineering and Science
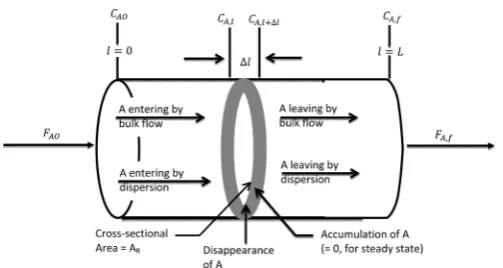
Figure 1. Hypothetical representation of a riser reactor in which reaction and dispersion are occurring simultaneously.
riser Reactor in which reactions and axial dispersion occurs. In developing model equations to investigate the catalytic cracking of vacuum gas oil in the reactor has led to a measure of axial dispersion characterized by a dimensionless group as
D
uL. Where FAo & FAf are the initial and final flow rate, CAo & CAf are the initial and final concentration, L is the length, u is the velocity and the application of fundamental quantities viz.: mass and energy to obtain the state equations with respect to the differential element of volume as shown in Figure 1.
2.1. Model Assumptions
The following simplifying assumptions were made in the derivation of the ma-thematical model:
1) Axial dispersion is taken into consideration and catalyst particles have a uniform size in the given differential element. Both gas oil and gasoline have identical activity decay function, φ[7].
2) Constant superficial velocity, u is assumed [13].
3) C1-C4 gases do not produce coke, and the coke content in the feed is
neg-ligible [8].
4) The mass and energy balance in the riser reactor are considered at qua-si-steady state [8].
5) The cracking reactions are almost complete in the riser [10].
2.2. Model Development
Under these assumptions, the component mass balance for the mass concentra-tions due to bulk flow and axial dispersion and rate of depletion of the reacting species operating at steady state in the riser (plug-flow) reactor can be obtained as:
( )
2 2
d d 0
d d
A A
A gR
u D r
l l
ρ − ρ + − ρ ε= (1)
A dimensionless catalyst bed height and residence time are defined as: R
l z
L = ,
and R R
o
L V
u v
DOI: 10.4236/aces.2018.84021 301 Advances in Chemical Engineering and Science
( )
2 2
d d 0
dA d A A gR R
D r
z uL z
ρ ρ
ρ ετ
− + − = (2)
where, u is the velocity of gas oil, D is the diffusion coefficient,
ρ
gR is the totaldensity of feed and products, ρA is the density of gas oil,
( )
−rA is the rate of reaction.But the density of reactant, A is
A yA gR
ρ
=ρ
(3)where yA = mass fraction of gas oil.
Substituting Equation (3) into Equation (2) and assuming constant total mass density gives;
( )
2 2
d d 0
d
d A A A R
y y
D r
uL z Z τ ε
− − − =
(4)
But, VR=A L zR R and o gr gR
F CTO
v = ρ (5)
hence;
R R gR
gR
A L z F CTO
ρ
τ = (6)
Substituting Equation (6) into Equation (4) gives;
(
)
2 2
d d 0
d d
R R gR
A A A R gR A L y y D r
uL Z F CT
Z O z ρ ε − − − =
(7)
Similarly, the basic material equations governing the yield of the cracking products gasoline (B), light gases (F) and coke (G) are expressed respectively as;
(
)
2 2
d d 0
d d
R R gR
B B B R gR A L y y D r
uL Z F CT
Z O z ρ ε − − − =
(8)
(
)
2 2
d d 0
d d
R R gR
F F F R gR A L y y D r
uL Z F CT
Z O z ρ ε − − − =
(9)
(
)
22
d d 0
d d
R R gR
G G G R gR A L y y D r
uL Z F CT
Z O z ρ ε − − − =
(10)
2.3. Four-Lump Kinetic Model
The four-lump Kinetic model as proposed by [14] [15] is illustrated in Figure 2. The overall rake constant of reaction is k k1+ 2+k3. The rate constant of over
cracking is k k4+ 5 and the rate constant of by-product and residue obtained is 2 3
k k+ from the cracking of gas oil kinetic model. The cracking of gas oil to gasoline, light gases and coke is a second-order reaction while the cracking of gasoline to light gases and coke is first-order reaction [9]. Thus, the reaction rates of gas oil, gasoline, light gases (C C1− 4), and coke respectively are given as:
(
)
2 2 21 2 3
A A A A
r k y φ k y φ k y φ
DOI: 10.4236/aces.2018.84021 302 Advances in Chemical Engineering and Science
Figure 2. Kinetic scheme of four-lump model [14] [15].
Hence,
(
) (
)
2 21 2 3
A A o A
r k k k y k y
− = + + = (12)
(
)
21 4 5
B A B B
r k y k y k y
− = − + +
(
)
21
B A B B
r k y k y
− = − + (13)
where kB=k k4+ 5
(
)
22 4
F A B
r k y k y
− = − −
(
)
22 4
F A B
r k y k y
− = − + (14)
(
)
23 5
G A B
r k y k y
− = − −
(
)
23 5
G A B
r k y k y
− = − + (15)
Substituting Equations (12)-(15) into Equations (7)-(10) gives; GAS OIL (A)
2
2 2
d d 0
d d
R R gR
A A
o A
R gR
A L Z
y y
D k y
uL z Z F CTO
ρ
φε
− − =
(16)
GASOLINE (B)
2
2 1 2
d d 0
d d
R R gR
B B
A B B
R gR
Z A L
y y
D k y k y
uL z Z F CTO
ρ
ε
− − − + =
(17)
C1-C4 GASES (F)
(
)
2
2
2 4
2
d d 0
d d
R R gR
F F
A B
R gR
A L Z
y y
D k y k y
uL z Z F CTO
ρ
ε
− − − + =
(18)
COKE (G)
(
)
2 2 3 5 2d d 0
d d
R R gR
G G
A B
R gR
A L Z
y y
D k y k y
uL z Z F CTO
ρ
ε
− − − + =
(19)
The deactivation model for a deactivation order of m equal to 1 as proposed by [17] is an exponential law of the form;
(
)
exp
φ= −ατ (20)
The deactivation constant, α in Arrhenius temperature dependent equation is determined by:
Gas oil (A) Gasoline (B)
Coke (G) Light Hydrocarbon
Gases C1 − C4
k1
K3 K4
k2
DOI: 10.4236/aces.2018.84021 303 Advances in Chemical Engineering and Science
0exp RTEα
α α= −
(21) where T = Reaction temperature, α = Catalyst decay constant, α0 =
Pre-exponential constant for catalyst decay, Eα = Activation energy for catalyst
deactivation, R = Universal gas constant.
Substituting Equation (6) and Equation (21) into Equation (20) gives;
0
exp R R gR exp
gR
A L Z E
F CTO RTα
ρ
φ= −α −
(22)
2.4. Energy Balance Equation
Applying the law of conservation of energy for a differential element of the reactor to the reacting species and the heterogeneous endothermic cracking reactions at steady state, the energy balancecan be written mathematically as:
(
)
(
)( )
2 5 2 1 d d 0 d d s Rg p s p i gR i i
T
T uc uc H r
l
Z − ρ +ρ −
∑
= ρ ε ∆ − = (23)where ρ ρg, s are the density of gas and catalyst respectively.
To express Equation (23) in dimensionless form, the following dimensionless parameters are defined: d d
R
l z
L
= , d d R ref
T T
T
= , and LR
u
τ = gives;
(
)
(
)( )
2 5 2 1 2 2d d 0
d d
g s
g p s p ref
ref
gR i i
i R
c c T
KT T T H r
Z L Z ρ ρ ρ ε τ = + − − ∆ − =
∑
(24)where T = dimensionless temperature, Tref= reference temperature, TR = axial
reaction temperature, K = thermal conductivity, cpg & cps= specific capacity of gas oil and catalyst respectively.
Substituting Equation (6) into Equation (24) gives;
(
)
(
)( )
2 2 5 2 1 2d d 0
d d
g s
g p s p gr ref
ref
gR i i
i
R R gR
R
c c F CTOT
KT T T H r
A L z Z
L Z ρ ρ ρ ε ρ = + − − ∆ − =
∑
(25)Multiplying through by 2R2
ref L KT
, Equation (25) becomes;
(
)
(
)( )
2 5 2 1 2 2d d 0
d d
g s
g p s p gr ref R
gR i i
i
R R gR ref
c c F CTOT L
T T H r
A L z Z
z KT ρ ρ ρ ε ρ = + − − ∆ − =
∑
(26)But,
(
)( )
2(
)
(
)
(
)
(
)
(
)
1 1 2 2 3 3 4 4 5 5
i i A B
H r y k H k H k H y k H k H
∆ − = ∆ + ∆ + ∆ + ∆ + ∆ (27)
Substituting (27) into (26) gives;
(
)
(
)
(
)
(
)
(
)
(
)
(
)
2 5 2 1 21 1 2 2 3 3 4 4 5 5
2 2 d d 0 g s
g p s p R R
gR i
R gR ref ref
A B
gr
c c F CTOL L
T
A KT
z KT
y k H k H k H y k H k H
DOI: 10.4236/aces.2018.84021 304 Advances in Chemical Engineering and Science
2.5. Materials
[image:7.595.209.539.459.602.2]The properties and compositions of feed and products of the industrial Fluid Catalytic Cracking process, the dimensions of FCC reactors, are presented in Table 1 and Table 2 respectively, the feedstock composition is given in Table 3, while the physical properties of the reacting species and catalyst are presented in Table 4.
2.6. Solution Techniques
The set of parabolic Ordinary Differential Equations (ODE) from the models were not amenable to analytic solution technique. The equations were solved numerically if all the parameters are known. The second order differential equa-tions were reduced to first order differential equaequa-tions by substituequa-tions. The boundary value was converted into an initial-value problem and solved numeri-cally using the fourth order Runge Kutta algorithm. Visual Basic 6.0 program was used to simulate the model.
Since gas oil cracked to the various products, the mass fraction of gas oil is 1 at LR=0; while the mass fraction of the products at the inlet is zero. The boun-dary condition at the inlet of the reactor; mathematically is
1 0
0
AO
BO GO FO
y z
y y y
=
= = = =
(29)
3. Results and Discussion
Table 5 shows the comparison between plant yields and predictions from model
Table 1. Feed and product properties of industrial FCC riser reactor [16].
Component API Gravity Specific Gravity Composition Weight % Flow rate (kg/hr)
Gas oil feed 21.2 0.927 100 244,090
Fuel gas - - 5.4 13,181
C3 LPG - - 6.3 15,388
C4 LPG - - 10.7 26,118
Gasoline 60.0 0.739 45.9 112,037
Light Cycle oil 14.0 0.973 17.8 43,448
Bottoms 0.5 1.072 8.8 21,480
[image:7.595.207.540.634.733.2]Coke - - 5.1 12,448
Table 2. Dimension of industrial FCC riser reactor [16].
Parameter Value (m)
Length 22.9
Diameter 2.9
Cyclone height 14.24
Cyclone diameter 1.5
DOI: 10.4236/aces.2018.84021 305 Advances in Chemical Engineering and Science
Table 3. Feedstock composition (mass spectrometric method), % Mass [16].
Paraffins Naphthenes Aromatics
35.4 16.1 48.1
Table 4. Physical properties of reacting species and catalyst [16].
Parameter Units Value
Vapour density kg∙m−3 9.52
Liquid density at 2880 K kg∙m−3 924.8
Specific heat of gas kj∙kg−1∙K−1 3.3 Specific heat of liquid kj∙kg−1∙K−1 2.67
Heat of vaporization kj∙kg−1 156
Temperature of vapourization K 698
-gas oil to gasoline kj −2970
-gas oil to light hydrocarbon gases kj −9240
-gas oil to coke kj 23,820
-gasoline to light hydrocarbon kj −6030
-gasoline to coke gases kj 22,606
Catalyst
Bulk density kg∙m−3 975
Particle size m 95 × 10−6
Specific heat capacity kj∙kg−1∙K−1 1.12 Mass flow rate of catalyst from the reactor to regenerate kg/hr 1,729,750
Table 5. Comparison of model predictions with plant data.
Parameter Plant Data Model Prediction Percentage Deviation Weight Fraction of Gas-oil 0.266 0.2689 −1.09 Weight Fraction of Gasoline 0.459 0.456 0.65 Weight Fraction of Light Gases (C1-C4) 0.224 0.2233 0.31
Weight Fraction of Coke 0.051 0.0518 −5.7
Riser Outlet Temperature (K) 658 646.41 1.76
(Equations (16)-(19) and Equation (28)), indicating that the predicted data agree reasonably well with plant data. The results showed a deviation of −1.09% for gas-oil, 0.65% for gasoline, 0.31% for light-gases, −5.7% for coke, and 1.76% for the riser outlet temperature.
[image:8.595.210.538.478.580.2]DOI: 10.4236/aces.2018.84021 306 Advances in Chemical Engineering and Science gases and coke predicated by higher temperature and catalyst deactivation as shown in Figure 3.
Figure 4 shows the temperature progression along the reactor height. Tem-perature decreased from the initial feed temTem-perature of 800 K to outlet tempera-ture of 646.41 K. Heat was absorbed during catalytic cracking of vacuum gas oil indicating that the cracking reaction was endothermic.
Reactor Simulation
A simulation model can be used to optimize plant performance by choosing the optimal set of operating condition such as temperature, pressure, flow rate etc. in this section a sensitivity analysis was performed to determine the effects of certain process variables on the performance of the model developed.
1) Variation of Vessel Dispersion Number
The vessel dispersion number measures the level of deviation from plug flow assumption. It is the ratio of the dispersion coefficient to the product of the su-perficial velocity and the reactor length. The dispersion number decreased with an increase in reactor length. Hence, the reactor flow pattern tends to plug flow which is characterized with an increase in the yield of products. Figure 5 depicts the effect of the variation of vessel dispersion number on the mass fraction of gas-oil, yield of gasoline, light gases, and coke along the reactor length.
As shown in Figure 5, the mass fraction of gas oil decreased with increase in Vessel Dispersion Number. Yields of light gases, gasoline and coke increases with vessel dispersion number.
2) Variation of Catalyst to Gas-Oil Ratio (CTO)
The effect of catalyst to gasoil ratio (CTO) on the mass fraction of gasoil, gas-oline, gases and coke is depicted in Figure 6. Increasing the CTO means in-creasing the flow rate (quantity) of catalyst entering the reactor. More catalyst is available for the reaction, thus increasing the active sites available for the cracking reactions. Increase in catalyst flow rate also entails an increase in the sensible
Figure 3. Variation of mass of gas-oil, gasoline, light gases, and coke, along reactor length.
-0.2 0 0.2 0.4 0.6 0.8 1 1.2
0 5 10 15 20 25
M
ass Fr
ac
ti
on
Reactor Length
[image:9.595.210.539.526.693.2]DOI: 10.4236/aces.2018.84021 307 Advances in Chemical Engineering and Science
Figure 4. Variation of temperature along dimensionless height.
[image:10.595.223.526.503.647.2]Figure 5. Effect of variation of vessel dispersion number, yield of gasoline, light gases and coke.
Figure 6. Effect of catalyst to gasoil ratio on yields of gasoline, light gases and coke.
heat associated with catalyst inflow, hence reactor temperature were higher and secondary cracking of gasoline occurred resulting in a sparing/gradual decrease in the yields of gasoline and corresponding gradual increase in the yields of gases
0 0.2 0.4 0.6 0.8 1 1.2
0 0.2 0.4 0.6 0.8 1 1.2
TEM
PER
A
TU
RE (
K
RISER REACTOR DIMENSIONLESS HEIGHT (-)
0 0.1 0.2 0.3 0.4 0.5 0.6
0 0.01 0.02 0.03 0.04 0.05 0.06
M
ass Fr
ac
ti
on
Vessel Dispersion Number
Gasoline Gas oil Light Gases Coke
0 0.1 0.2 0.3 0.4 0.5 0.6
0 2 4 6 8 10 12
M
ass Fr
ac
ti
on
Catalyst To Gas-Oil Ratio (CTO)
DOI: 10.4236/aces.2018.84021 308 Advances in Chemical Engineering and Science and coke.
[image:11.595.214.536.545.703.2]3) Variation of Mass Flow Rate of Gasoil
Figure 7 shows the effects of the mass flow rate of gas oil on yields of gasoline, light gases and coke.
The result showed significant effect of the mass flow rate on the mass fraction of gas-oil decreased (conversion increased) with increase in mass flow rate of gas oil. The yield of gasoline increased progressively while the yield of dry gases de-creased but had a negligible effect on coke yield.
4) Variation of Mass Fraction of Gas-Oil with yields of gasoline at various flow rates
Figure 8 shows the variation of mass fraction of gas-oil with yield of gasoline as the most desired product at various flow rates of gas-oil. The mass fraction of gas-oil decreased to 36% (conversion of 64%) at reactor height of 14 m and re-mained constant up to 17.2 m before decrease. This indicated that at this statio-nary point, optimum yield of gasoline of about 48% - 51% was obtained before de-crease at higher reactor height. The dede-crease might be due to catalyst deactivation. 5) Variation of Reference Temperature with mass fraction of gas-oil and yield of products
The inlet temperature of the feed affects the conversion of the feed. The feed have to attain a significant high temperature for proper atomization of the mo-lecules, the volatility of the feed increases with an increase in the temperature. This favours the conversion of gas-oil. The effect of temperature on the conver-sion of gas-oil, yield of gasoline, light gases and coke are shown in Figure 9. The conversion of gasoil increased (mass fraction decreased) significantly from tem-perature of 650 K and above. Yield of light gases and coke also show significant increase with increase in temperature, while the yield of gasoline decreased due to secondary cracking to form light gases and coke. Also at temperature above 650 K, the catalyst deactivates due to sintering effects.
4. Conclusion
A dispersion model that incorporates four-lump kinetic scheme for the simulation
Figure 7. Effect of variation of flow rate of gas-oil, yield of gasoline, light gases and coke.
0 0.1 0.2 0.3 0.4 0.5 0.6 0.7
0 20 40 60 80 100 120 140
M
ass Fr
ac
ti
on
(-)
Flow Rate of Gasoil (kg/s)
DOI: 10.4236/aces.2018.84021 309 Advances in Chemical Engineering and Science
Figure 8. Variation of mass fraction of gas-oil with yields of gasoline at various flow rates along reactor length.
Figure 9. Effect of reference temperature on conversion of gas oil, yield of gasoline, light gases and coke.
of an industrial FCC riser reactor has been presented. The inclusion of disper-sion number which represents the ideal flow pattern of the heterogeneous reac-tions that occur in the riser superimpose the oversimplification of previous re-searchers that assumed negligible dispersion. The results obtained from the model matched reasonably well with plant data with minimum deviation of −1.09 and maximum deviation of 1.76. Simulation results indicate that the vessel dispersion number, catalyst to gasoil ratio, reaction temperature and flow rate of gasoil are major process variables that affect the performance of FCC riser reactor.
Conflicts of Interest
The author declares no conflicts of interest regarding the publication of this paper.
References
[1] Hageberg, P., et al. (2002) Kinetics of Catalytic Cracking with Short Contact Times.
0 0.2 0.4 0.6 0.8 1 1.2
0 0.2 0.4 0.6 0.8 1 1.2
M
as
s F
rac
tion
Reactor Length
Gas oil 10kg/s 50kg/s 70kg/s 110kg/s
0 0.1 0.2 0.3 0.4 0.5 0.6 0.7 0.8 0.9
300 650 1000
M
ass Fr
ac
ti
on
Reference Temperature (K)
[image:12.595.222.527.315.469.2]DOI: 10.4236/aces.2018.84021 310 Advances in Chemical Engineering and Science Applied Catalysis A, 223, 73-84.https://doi.org/10.1016/S0926-860X(01)00744-X [2] Bolkan, Y., Berruti, F., Zhu, J. and Milne, B. (2000) Modelling Circulating Fluidized
Bed Downers. Powder Technology,132, 85-100.
https://doi.org/10.1016/S0032-5910(03)00059-7
[3] Affum, H.A., Mumuni, I.I., Appiah, G.K., Adzaklo, S.Y. and Addo, M.A. (2013) On the Conversion of Gas Oil in Fluid Catalytic Cracking Risers: Application of Resi-dence Time Distribution (Rtd) Concept. International Journal of Scientific & Technology Research, 2, 168-173.
[4] Palos, R., Gutiérrez, A., Arandes, J.M. and Bilbao, J. (2018) Catalyst Used in Fluid Catalytic Cracking (FCC) Unit as a Support of NiMoP Catalyst for Light Cycle Oil Hydroprocessing. Fuel, 216, 142-152.https://doi.org/10.1016/j.fuel.2017.11.148 [5] Dasila, P.K., Choudhury, I., Saraf, D., Chopra, S. and Dalai, A. (2012) Parametric
Sensitivity Studies in a Commercial FCC Unit. Advances in Chemical Engineering and Science, 2, 136-149. https://doi.org/10.4236/aces.2012.21017
[6] Fernandes, J.L., Pinheiro, C.I.C., Oliveira, N. and Bibeiro, F.R. (2003) Modeling and Simulation of an Operating Industrial Fluidized Catalytic Cracking (FCC) Riser.
Proceedings of the 4th Mercosur Congress on Process Systems Engineering, Coasta
Verde.
[7] Ahari, J.S., Farshi, A. and Forsat, K. (2008) A Mathematical Modeling of the Riser Reactor in Industrial FCC Unit. Petroleum and Coal, 50, 15-24.
[8] Ali, H., Rohani, S. and Corriou, J.P. (1997) Modeling and Control of a Riser Type Fluid Catalytic Cracking (FCC) Unit. Transactions of the Institution of Chemical Engineers, 75, 401-412.https://doi.org/10.1205/026387697523868
[9] Heydari, M., Ebrahim, H.A. and Dabir, B. (2010) Modeling of an Industrial Riser in the Fluid Catalytic Unit. American Journal of Applied Sciences, 7, 221-226. https://doi.org/10.3844/ajassp.2010.221.226
[10] Oboho, E.O., Akpa, J.G. and Dagde, K.K. (2002) Modelling of a Fluid Catalytic Cracking (FCC) Riser Reactor the Four-Lump Model. Journal of Modelling, Design and Management of Engineering Systems,1, 39-52.
[11] Alsabei, R.M. (2011) Model Based Approach for the Plant-Wide Economic Control of Fluid Catalytic Unit. PhD Thesis, Loughborough University, Loughborough. [12] Dagde, K.K. and Puyate, Y.T. (2012) Six-Lump Kinetic Modeling of Adiabatic
Plug-Flow Riser-Reactor in an Industrial FCC Unit. International Journal of Engi-neering Research and Applications, 2, 557-568, 557.
[13] Levenspiel, O. (2001) Chemical Reaction Engineering. 3rd Edition, John Willey & Sons, Singapore.
[14] Lee, L.S., Chen, V.W. and Huang, T.N. (1989) Four-Lump Kinetic Model for Cata-lytic Cracking Process. Canadian Journal of Journal of Chemical Engineering, 67, 615-623.https://doi.org/10.1002/cjce.5450670414
[15] Yen, L.C., Wrench, R.E. and Ong, A.S. (1987) Reaction Kinetic Correlation for Pre-dicting Coke Yield in Fluid Catalytic. 8th Annual Fluid Catalytic Cracking Sympo-sium, Budapest Hungary, 71-77.
[16] NPHRC (1987) Operating Manual of Fluid Catalytic Cracking Unit. New Port Harcourt Refining Company Vol. 1, Alesa-Eleme, Rivers State, Nigeria.
![Figure 2. Kinetic scheme of four-lump model [14] [15].](https://thumb-us.123doks.com/thumbv2/123dok_us/9257772.414951/5.595.242.510.63.191/figure-kinetic-scheme-lump-model.webp)
![Table 1. Feed and product properties of industrial FCC riser reactor [16].](https://thumb-us.123doks.com/thumbv2/123dok_us/9257772.414951/7.595.209.539.459.602/table-feed-product-properties-industrial-fcc-riser-reactor.webp)
![Table 4. Physical properties of reacting species and catalyst [16].](https://thumb-us.123doks.com/thumbv2/123dok_us/9257772.414951/8.595.203.539.156.442/table-physical-properties-reacting-species-catalyst.webp)


