Munich Personal RePEc Archive
Analysis and Forecasting of Drought by
Developing a Fuzzy-Based Hybrid Index
in Iran
Moghaddasi, Reza and Eghbali, Alireza and Lakhaye Rizi,
Parisa
Department of Agricultural Economics, Islamic Azad University,
Science and Research Branch, Tehran, Iran., Assistant Professor of
Department of Economics, Payame Noor University, Iran.,
Department of Agricultural Economics, Science and Research
Branch, Islamic Azad University, Khouzestan-Iran.
2 January 2014
Online at
https://mpra.ub.uni-muenchen.de/53153/
2
Analysis and Forecasting of Drought by Developing a
Fuzzy-Based Hybrid Index in Iran
Reza Moghaddasi
Assistant Professor of Department of Agricultural Economics, Islamic Azad University, Science and Research Branch, Email: [email protected]
Alireza Eghbali
Assistant Professor of Department of Economics, Payame Noor University, Iran, Email:[email protected]
Parisa Lakhaye Rizi
M.Sc. Student in Agricultural Engineering, Department of Agricultural Economics, Science and Research Branch, Islamic Azad University, Khouzestan-Iran.
Email: [email protected]
Abstract
Drought is the most important and destructive climate phenomenon which is usually o f importance in a regional scale. Therefore, this study offers a fuzzy-based hybrid inde x in order to analyze the regional drought in Abadan and khoramshahr, Khuzestan, Ira n. Influencing all aspects of human activity, drought does not have a comprehensive d efinition and an appropriate and general index to explore it. Consequently, in order to develop a model to evaluate and analyze drought, the fuzzy model has been used. The application of fuzzy logic to examine drought in Abadan-khoramshahr station demons trated that fuzzy logic enables us to examine drought more accurately and appropriatel y because it takes into account the type of product (wheat or dates) in calculating the p robability of drought. In furtherance of this aim, the fuzzy function related to the stand ardized Precipitation Index (SPI) and the standardized evapotranspiration index (SEI) have been combined and a new indicator called the standardized evapotranspiration an d Precipitation index (SEPI) was developed. In the final fuzzy model, 81 rules have be en utilized. In this study, the annual data of wheat and dates from 1994 to 2012 have b een utilized (sometimes 2013 data have been used), and on this basis, the results of the model revealed that severe and continued droughts have occurred in 1999, 2007 and 2 009 and the probability of drought for wheat and dates was 64.29 and 57.14 percent re spectively in this period.
Key Words:
Water Requirement, Probability of Drought, wheat, dates, SEPI.3
1.
Introduction
Agriculture as one of the most important sections of Iran's economy has a large
contribution to GPP, non-oil exportation, and employment (Shams, 2005). Due to the
huge population growth and the increased demand for agricultural and animal
products, agriculture and animal husbandry have gained much more importance, and
developing more efficient production procedures and supporting domestic producers
has become more crucial (Enjolras et al, 2012). Moreover, agricultural activities have
bilateral risks, affecting both producers' behavior and macro-agricultural policies.
Among different risks involved in this section, some risks cannot be controlled and
have a wide range of consequences, an important instance of which is drought (De
Janvry et al, 2014). Drought is considered as a creeping phenomenon since a large part
of its impact is not observed in a particular period; hence planning to reduce its
damages is difficult. In comparison with other natural disasters, drought is greater
with regard to severity, spread, human losses, economic damage, and long-term
consequences, posing a serious threat to sustainable development (Leblois and
Quirion, 2013).
Therefore, utilizing efficient methods to identify and forecast risk-producing factors in
different sectors of agriculture (such as drought) can assist policy makers to adopt
appropriate policies (Anton, 2013). The importance and function of calculating the
risk of drought in Several areas have been dealt with in a wide range of studies, such
as Kim et al (2013); Ramsay et al (2013); Gómez and Blanco (2012); Gil et al (2011);
Altmana et al (2009); Waterbury and Mark (2008); Akcaoz and Ozkan (2005); Skees
et al (2002) and Wright and Hewitt (1994) studies. Due to the climate conditions in
Iran and the importance of agriculture sector in the prosperity of provinces,
particularly those having revealed agriculture-related comparative advantages, the
consequences of drought in the southern cities of Iran, and the strategic nature of
wheat and dates in Abadan and Khoramshahr, investigating the probability of drought
based on the type of products is of high importance.
2.
Agriculture in Khuzestan
Khuzestan Province has an area of 67282 square kilometers and is located in the south
4
semi-desert climate in foothills. Having access to open water in southern coasts and nu
merous huge rivers, which have been the habitat of ancient Iranian tribes, is an import
ant advantage of this province.
2.1.
Abadan and Khoramshahr
Abadan has an area of 576 square kilometers and is located in the south-west of Khuz
estan and across the Persian Gulf. After Ahwaz, Abadan is the second most important
city of Khuzestan. The strategic importance of the Oil Refinery and having borders wi
th Iraq make Abadan one of the most significant cities in Iran and the Middle East. Ab
adan is located between the Persian Gulf and Arvand and Bahmanshir rivers and has a
hot and humid climate. This city is among the low-rainfall areas and usually receives f
leeting showers, and the type of soil in this city is quite appropriate for agriculture. M
ost agricultural activities are devoted to cultivating and raising palm trees. The water o
f Bahmanshir and Arvand rivers are used to irrigate these trees. Therefore, we should
bear in mind that rainfall has utmost importance in the agricultural activities of this re
gion, and hence water Shortage and drought severely damage that agricultural activitie
s.
In the south-west of Khuzestan and has a dry and humid climate. Irrigation resources f
or the farms of this city are Karun and Arvand rivers, and the farms located in the sout
h and south-west of these rivers. Due to the special geographical position of Khorams
hahr, it is potentially and actually capable of enhancing its agricultural activities. Whe
at and dates are prominent products of this city which are both cultivated by means of
irrigated farming. Due to high temperature and low rainfall in this region, like Abadan
, the negative consequences of drought can do a serious damage to its farms and palm
trees. Therefore, the ability to control agricultural risks in these two cities is of high i
mportance.
2.2.
Wheat
Wheat is one of the most salient agricultural products. In societies like Iran, wheat has
crucial nutritious importance, and the social welfare of low and middle classes is heavi
ly dependent on this product (Khousravipour et al, 2011). Like many other countries,
5
cultural products in Khuzestan. Ten percent of the total amount of wheat produced in I
ran is cultivated in this province (Hakimi, 2012).
Wheat is cultivated by means of rain-fed and irrigated methods. Research has shown t
hat the amount of wheat produced through rain-fed method is directly related to the a
mount and distribution of rainfall. Therefore, rainfall has a strong impact on wheat pro
duction. This will increase the production risk particularly in Khuzestan facing the ris
k of drought (Shamohammadi et al, 2005). Consequently, drought and adverse climate
conditions bear a negative effect on wheat production. Hence, managing drought risks
in wheat production is of prime importance, particularly in areas with a hot climate.
2.3.
Dates
Dates, a tropical plant, is one of the oldest and most strategic agricultural products. C
ontaining a lot of sugar, vitamins, and minerals, dates have great nutritious value. Date
s are raised in arid and semi-arid areas having hot and long summers (Abdoullahi and
Abedini, 2010). They are reaped from August to September. Based on global statistic
s, Iran has the second largest cultivation area of dates in the world (Koshteh and Kama
lian, 2004). Dates are the third most 'important horticultural products in Iran and is cul
tivated in 13 provinces. With regard to the amount of production, Khuzestan stands thi
rd in Iran (after Kerman and Bushehr). Although dates are generally raised in arid and
semi-arid areas, palm trees need sufficient water to grow and production of high qualit
y fruits. Therefore, increase in the temperature and decrease in relative humidity negat
ively affects the performance of palm trees (Mohammadrezaei et al, 2009). Consequen
tly, in order to utilizing maximum capacity of date's production, enough attention shou
ld be devoted to water shortage, drought and their managements.
3.
Drought Risk
Vulnerability to drought is a function of its nature, size, and severity. On the other han
d, human beings cannot forecast many events properly. Therefore, there is always a de
gree of uncertainty and a degree of inevitable risk (Hungsoo et al, 2013). Drought man
agement has not experienced a huge progress in many parts of the world and many rea
ctions to this phenomenon have been traditional. Drought risk management or the set
6
nomenon. This issue has not been fully attended in developing countries (Blanco et al,
2013). Crisis management has become less valid; therefore, many governments try to
gain more information about appropriate methods of risk management in order to miti
gate the damages caused by drought and the negative consequences of possible drough
ts in future (Anton et al, 2013).
3.1.
Theoretical Foundations of Drought Management
Drought is a natural danger and a big disaster, posing many problems for countries. So
me of the instances of the most severe droughts in the 20th century include the drough
t in China in 1907, the Soviet Union in 1922, India in 1967 and Africa in 1975 (Kim e
t al, 2011). Many factors contribute to the occurrence of drought in different parts of t
he world; the common features of all of them are the potential amount of evapotranspi
ration and the amount of rainfall which make the crops water requirement difficult. In
addition, droughts pose numerous economic problems for farmers (Campbell et al., 20
11).
3.2.
The Probability of Drought
Determining the time at which droughts start and end is difficult because this phenom
enon is creeping and its consequences may hit an area over a period of time and contin
ue for some time (Ward, 2014). Moreover, the negative effects of a drought in a wide
area seem to be less than those of other natural disasters. On the other hand, more than
90 percent of Iran is located in arid areas with low water supplies, hence forecasting th
e probability of droughts is an important concern of policy makers (Eyvasi et al, 2013)
. Almost all areas in Iran are susceptible to the negative effects of drought. They const
antly face drought. Central, western, and southwestern areas in Iran are more vulnerab
le to drought because the amount of rainfall has been fluctuating over the past years. T
herefore, forecasting the probability of the occurrence of drought can be quite benefici
al for these regions.
3.3.
Methods of Calculating the Probability
In order to identify drought and its negative environmental effects, many indexes such
as rainfall, average temperature, soil humidity and evapotranspiration are considered.
7
sed for this phenomenon. What is of prime importance is the role played by factors su
ch as rainfall and evapotranspiration.
3.3.1.
Standardized Precipitation Index (SPI)
This indicator, proposed by McKee et al. (1993) for the first time, is a powerful instru
ment to analyze rainfall-related data. This indicator is aimed at analyzing the amount o
f rainfall so that we can compare rainfall in different areas (Slahedin et al, 2014). We
may calculate this indicator by comparing the aggregate amount of rainfall in a particu
lar period of time in a particular region with the average rainfall in the same duration f
or all of the statistical periods. This indicator is measured for each particular region ba
sed on the long-term rainfall data, observing gamma distribution. The normalized SPI
equation is as follows:
(1)
x x SPI i
In this equation,
represents the standard deviation of rainfall,x
is represents the amount of rainfall, and
x
is the average of accumulative rainfall (Alemaw and Kileshye -Onema, 2014).3.3.2.
Standardized Evapotranspiration Index (SEI)
This indicator's equation is as follows:(2)
ET ET
SPI i
In this equation,
ET
irepresents the evapotranspiration at i, ET represents the averageamount of accumulative evapotranspiration,
is the standard deviation of evapotranspiration (Labedzki and Kanecka-Geszke, 2009).
3.3.3.
Standardized Evapotranspiration and Precipitation Index (SEPI)
The SEPI indicator has been introduced by Vicente- Serrano et al. (2010). According to fuzzy logic, this indicator is a combination of SPI and SEI and has all their features
because the use of both of these variables is necessary to measure drought and neglect
8
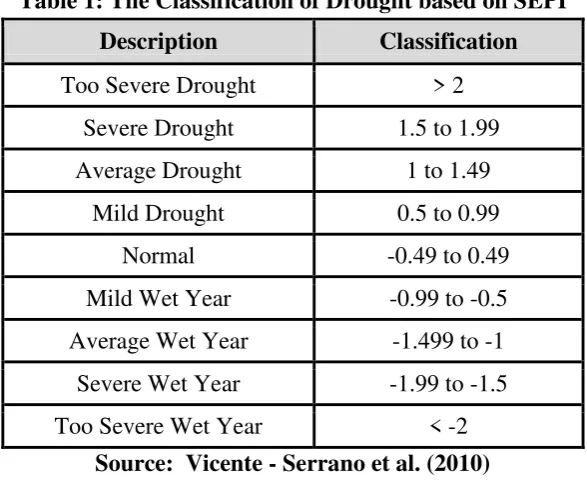
Table 1: The Classification of Drought based on SEPI Description Classification
Too Severe Drought > 2
Severe Drought 1.5 to 1.99
Average Drought 1 to 1.49
Mild Drought 0.5 to 0.99
Normal -0.49 to 0.49
Mild Wet Year -0.99 to -0.5
Average Wet Year -1.499 to -1
Severe Wet Year -1.99 to -1.5
Too Severe Wet Year < -2
Source: Vicente - Serrano et al. (2010)
In the calculation of SPI the only input is rainfall. Therefore, using SPI to analyze the
severity of drought in arid areas, in which the differences in the temperature, evapotra
nspiration are great, leads to a big error in the analysis of drought. Hence, the combina
tion of the two indexes removes the above-mentioned limitations. After calculating SP
I and SEI and using the classified linguistic variables and due to advantages of fuzzy l
ogic in the combination of linguistic variables, SPI and SEI are combined based on fu
[image:8.595.71.496.509.706.2]zzy logic, and a combined indicator has created (Potop and Mozny, 2011).
Table 2: SPEI Values for Different Levels of Drought
Description Classification Description Classification
Mild Wet Year (1) 0.5 Mild Drought (1) -6 Mild Wet Year (2) 1 Mild Drought (2) -5.5 Mild Wet Year (3) 1.5 Mild Drought (3) -5 Average Wet Year (1) 2 Average Drought (1) -4.5 Average Wet Year (2) 2.5 Average Drought (2) -4 Average Wet Year (3) 3 Average Drought (3) -3.5
Severe Wet Year (1) 3.5 Severe Drought (1) -3 Severe Wet Year (2) 4 Severe Drought (2) -2.5 Severe Wet Year (3) 4.5 Severe Drought (3) -2 Too Severe Wet Year (1) 5 Too Severe Drought (1) -1.5 Too Severe Wet Year (2) 5.5 Too Severe Drought (2) -1 Too Severe Wet Year (3) 6 Too Severe Drought (3) -0.5
If SPEI equals zero, climate conditions are normal
9
3.3.4.
Fuzzy Logic
Fuzzy logic was introduced in the framework of the fuzzy set theory proposed by Prof
essor Lotfi Zadeh. Fuzzy logic includes three distinct stages, namely (1) fuzzy making
stage, (2) accumulation stage, and (3) un-fuzzy making stage (Esfahanipour and Agha
miri, 2010). All these stages occur in the framework of fuzzy inference systems. They
are popular calculation frameworks based on fuzzy sets and "if-then" rules, which hav
e successful applications in many domains such as economics, engineering, etc (Askar
i Zadeh, 1965).
4.
Empirical Results
4.1.
Drought and Its Relation with Net Water Requirement
There are four kinds of drought, namely metrological drought, hydrological drought, a
gricultural drought, and socio - economic drought. In this research, we are mainly con
cerned with agricultural drought. Therefore, it is necessary to propose a comprehensiv
e definition of this type of drought at the beginning of this section. Agricultural droug
ht takes place when the humidity stored in roots of the plants are not enough for those
to survive between two rainfalls. It should be noted that even when the soil and the we
ather contain humidity, the plants may be exposed to drought, which is caused by a su
dden increase in the temperature. Accordingly, the drought risk for wheat and dates wi
ll be different. Therefore, it is crucial to pay enough attention to sudden temperature c
hanges affecting the degree of evapotranspiration in plants. Hence, there seems to be a
significant and logical relationship between drought and net agronomic water require
ment.
4.2.
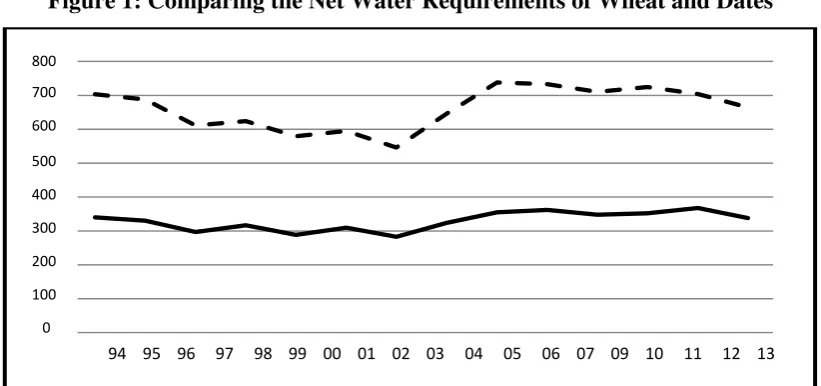
Comparing the Net Water Requirements of Wheat and Dates
The decrease of surface and underground water and rainfall in any regions can have ahuge negative impact on agricultural activities. As a matter of fact, drought makes pla
nts unable to satisfy their water requirements and this undermines their performance.
Therefore, comparison of the wheat and date's net water requirements in the recent ye
ars can offer us fresh insights about the drought risk of these two products. Efficient pl
anning to tackle drought requires gaining information on net water requirements of pla
nts. Due to the prime importance of wheat and dates for Khoramshahr and Abadan res
10
Figure 1: Comparing the Net Water Requirements of Wheat and Dates
Source: the Finding of the Studies
In these two cities, a part of net agronomic water requirement are met by dint of rainfa
ll that usually occurs in cold seasons during which the level of evapotranspiration is lo
w and plants don't require any water. Therefore, Rain water can be added to undergrou
nd and surface water. In warmer seasons of the year when the level of evapotranspirati
on goes up and plants request more water for their growth, a large part of water requir
ements are met by rainfall and a small part is satisfied through irrigation. In Khoramsh
ahr, wheat is mainly irrigated by underground water, Karun River, and other sources o
f surface water. Palm trees in Abadan are also mainly irrigated by underground water,
the tide of Arvand Rood, Karun, and, Bahmanshir, and other sources of surface water.
Comparing the average net water requirement of wheat and dates between 1999 and 2
013 reveals that the net water requirement of wheat is more than that of dates, and ano
ther reasonable and logical indication of the higher net water requirement of wheat is t
hat the growth period of wheat is 220 days on average, while this period for dates is 1
20- 200 days on average.
4.3.
Estimating the Probability of Drought Risk
4.3.1.
Estimating the Standardized Precipitation Index (SPI)
According to the results of SPI, a large number of years in the period investigated in t
his study have been gripped with drought with varying degrees in different years. The
important point is that drought was very severe in 1999, 2007, and 2009.
94 95 96 97 98 99 00 01 02 03 04 05 06 07 09 10 11 12 13
Average Water Requirements of Wheat --- Average Water Requirements of Dates
800
700
600
500
400
300
200
100
11
4.3.2.
Estimating the Standardized Evapotranspiration Index (SEI)
The crucial importance of SEI lies in the fact that it provides a more pragmatic concept than what drought does. The degree of agricultural drought for different plants may v
ary in accordance with their features and this should be taken into account in the analy
sis. The results of drought analysis based on SEI reveals two basic points. The first poi
nt is that, as it was expected, the climate conditions for wheat and dates were not sym
metrical in some years such as 2001 and 2004 and hence, the results of the indicator ar
e not symmetrical. The second point is that the results of SEI are different from those
of SPI, which is evident in light of the fact that calculation criteria of these two indexe
s are different. Therefore, relying on the results of each of the indicators separately wil
l deviate the results of the analysis. Consequently, the dependency of the applied resul
ts based on the calculation of the probability of drought is unquestionable. In order to i
mprove the precision of calculating the probability of drought, SEPI is introduced in t
he next section.
4.3.3.
Estimating the Standardized Evapotranspiration and Precipitatio
n Index (SEPI)
After determining all of the stages of fuzzy calculations and the fuzzy sets, the related
computer program was designed in MATLAB software. On this basis, the input would
be SPI and SEI values and the output would be SEPI values.
After determining the functions of SPI and SEI, a combination of the two indicators w
ith different weights in accordance with the experts' views (the weight of rainfall is set
as two times more than that of evapotranspiration), the fuzzy function of the levels of
drought for SEPI were considered and the final fuzzy model was produced with 81 rul
es. Finally, in order to use the results of the fuzzy model, the final stage of this model,
is the un-fuzzy making of the output, SEPI was determined for both wheat and dates.
Then, the probability of drought was calculated for wheat and dates separately based o
12
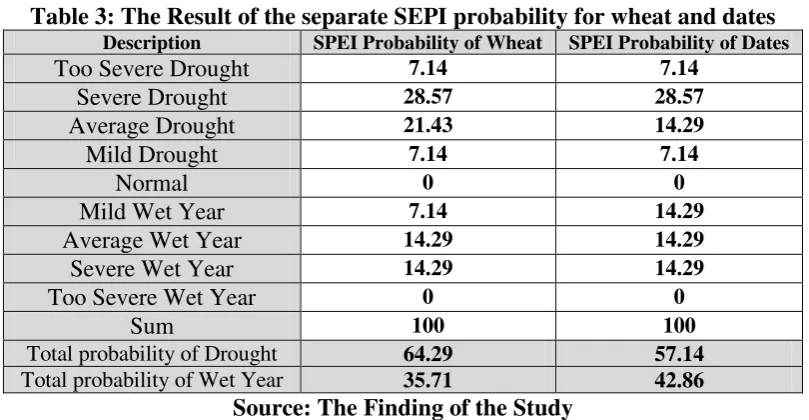
Table 3: The Result of the separate SEPI probability for wheat and dates Description SPEI Probability of Wheat SPEI Probability of Dates
Too Severe Drought 7.14 7.14
Severe Drought 28.57 28.57
Average Drought 21.43 14.29
Mild Drought 7.14 7.14
Normal 0 0
Mild Wet Year 7.14 14.29
Average Wet Year 14.29 14.29
Severe Wet Year 14.29 14.29
Too Severe Wet Year 0 0
Sum 100 100
Total probability of Drought 64.29 57.14
Total probability of Wet Year 35.71 42.86
Source: The Finding of the Study
Table 3 demonstrates the probability of different climates. In addition, the percentage
of the aggregate probability of drought based on SEPI that equals the sum of probabili
ties of very severe, severe, average, and mild drought is 64.29 percent for wheat and 5
7.14 percent for dates.
5.
Conclusions
Most natural phenomena have elements that cannot be easily forecasted. Forecasting i
s possible if some information about their past is available. An important instance of s
uch phenomena is drought having hugely destructive consequences. On this basis, this
study offers a fuzzy-based hybrid index in order to analyze the regional drought in Ab
adan and khoramshahr, Khuzestan, Iran. Our Findings revealed that severe and contin
ued droughts have occurred in 1999, 2007 and 2009 and the probability of drought for
13
6.
Reference
1) Abdoullahi, M., Abedini, M.R., (2010), "study the impact of government policies and actions in the Iranian Dates market", Quarterly Journal of Business, Vol. 54, PP. 201-219.
2) Akcaoz, H., Ozkan, B., (2005), "Determining risk sources and strategies among farmers of contrasting risk awareness: A case study for Cukurova region of Turkey", Journal of Arid Environments 62, PP.127-135.
3) Alemaw, B.F., Kileshye-Onema, J.M., (2014), "Evaluation of Drought Regimes and Impacts in the Limpopo Basin", Hydrology Earth System Sciences Discussions, Vol. 11, PP. 199-222.
4) Altmana, Edward, Sabatob, Gabriele, Wilson, Nicholas, (2009), "The value of non-Financial Information in Sme Risk Management", Aecom Economics, Vol. 1, PP. 110-125.
5) Anton, J., Cattaneo, A., Kimura, S., Lankoski, J., (2013), "Agricultural risk management policies under climate uncertainty", Global Environmental Change, Vol. 23, Issue 6, PP. 1726–1736.
6) Askari Zadeh, L., (1965), "Fuzzy Sets" Information And Control, Vol. 8, No. 3, PP.338 – 353.
7) Blanco, Pérez, Dionisio, Carlos, Gómez, Gómez, Mario, Carlos, (2013), "Insuring water: A practical risk management option in water scarce and drought prone regions?".
8) Campbell, D, Barker, D, Mgregor, D, (2011), "dealing with drought: small farmers and environmental hazards in southern st. Elizabeth" Jamaica, applied geography, vol. 31 , issue 1, PP. 146-158.
9) De Janvry, A, Dequiedt, V, Sadoulet, E, (2014), "The demand for insurance against common shocks", Journal of Development Economics, Volume 106, P. 227-238.
10) Delavari, M., Mohammadali, H., Naderi, E., Gandali Alikhani, N., (2011), "The sources of Iran's Business Cycles," MPRA Paper 46756, University Library of Munich, Germany.
11) Enjolras, G., Capitanio, F., Adinolfi, F., (2012), "The demand for crop insurance", Combined approaches for France and Italy, Agricultural Economics Review (forthcoming).
14
13) Eyvasi, M., Mosaedi, A., Eslami, H.R., (2013), "temporal and Geographic Forecasting Drought in Golestan State by using transition probability matrix", Third National Conference on Integrated Water Resources Management, PP. 114-125.
14) Gil, M, Garrido, A, Gómez-Ramos, A, (2011), "Economic analysis of drought risk: An application for irrigated agriculture in Spain", Agricultural Water Management, Volume 98, Issue 5, PP. 823-833.
15) Gómez, C, Pérez Blanco, C, (2012), "Do drought management plans reduce drought risk? A risk assessment model for a Mediterranean river basin", Ecological Economics, Volume 76, PP. 42-48.
16) Hakimi, H., (2012), "Evaluate the impact of research methods on yield in the promotion of Khuzestan Agricultural Organization", Journal of Library and Information, Vol. 1, PP 143-164.
17) Hungsoo, k , Jongyong, p, Jiyoung, y, Tae-Woong, k, (2013), "Assessment of drought hazard, vulnerability, and risk: A case study for administrative districts in South Korea", Journal of Hydro-environment Research , PP. 20-32.
18) Khousravipour, B., Omani, A.R., Froshani, N., Espere, A., (2011), "Variables affecting on the wheat crop acceptance crop insurance city of Dezful", Journal of Rural Development, Vol. 14, No. 4, PP. 127-146.
19) Kim, D.H., Yoo, Ch., Kim, T.W., (2011), "Application of spatial EPF and multivariate time series model for evaluation agricultural drought vulnerability in Korea", advances in water resources, vol. 34, Issue 3, PP. 340-350.
20) Kim, H., Park, J., Yoo, J., Kim, T.W., (2013), "Assessment of drought hazard, vulnerability, and risk: A case study for administrative districts in South Korea", Journal of Hydro-environment Research, In Press, Corrected Proof, Available online 6 August 2013.
21) Koshteh, K., Kamalian, A.R., (2004), "Dates Marketing and Exporting Challenges in Iran", International Symposium on Horticultural Economics and Management, Vol. 655, PP. 333-339.
22) Labedzki, L., Kanecka-Geszke, E., (2009), "Standardized Evapotranspiration as an Agricultural Drought Index", Irrigation and Drainage, Vol. 58, No. 5, PP. 607-616.
15
24) Mohammadrezaei, R., Shahbazi, H., Kawosi Kashemi, M., Khodaverizadeh, M., (2009), "The Evaluating stability indicators of comparative advantage and export Iranian Dates", Journal of Agricultural Science, Vol. 19, No. 2, PP. 165-176.
25) Potop, V., Mozny, M., (2011), "The Application a New Drought Index Standardized Precipitation Evapotranspiration Index in the Czech Republic", Mikroklima a mezoklima Krajinnych Struktur a Antropogennich Prostredi Skalni Mlyn, Vol. 2, PP. 2-14.
26) Ramsay, Colin M, Oguledo, , Victor I, Pathak, Priya, (2013), "Pricing high-risk and low-risk insurance contracts with incomplete information and production costs", Insurance: Mathematics and Economics, Volume 52, Issue 3, PP. 606-614.
27) Salahedin, S.M., Temeliye, Z.K., Montaseri, M., (2014), "Analysis of Hydrological Drought Classes Transition Using SPI (A Case Study: Urmia Lake Watershed)", International Journal of Boisciences, Vol. 4, No. 1, PP. 452-462.
28) Sayari, N., Bannayan, M., Alizadeh, A., Farid, A., (2013), "Using Drought Indices to Assess Climate Change Impacts on Drought Conditions in the northeast of Iran (Case Study: Kashafrood Basian)", Meterological Applications, Vol. 20, PP. 115-127.
29) Shamohammadi, H.Z., Behnia, A.K., (2005), "The determining Model on maximum flood basins in East and South East Khuzestan plain no statistics", Journal of Agricultural Sciences and Natural Resources, Vol. 12, No. 5., PP 1-12.
30) Shams, H., (2005), "Risk management in the agricultural sector, the role of agricultural insurance", Prepared for the Second Agricultural Insurance Conference in Iran.
31) Skees, J., Varang, P., Larson, D., siegel, P., (2002), "Canfinacial market is tapped to help poor people cope with weather risks", Retrieved from http://www.bancomundial.org.
32) Ward, F.A., (2014), "Economic impacts on irrigated agriculture of water conservation programs in drought", Journal of Hydrology, Vol. 508, PP. 114–127.
33) Vicente-Serrano, S.M., Begueria, S., Lopez-Moreno, J.I., (2010), "A Multiscalar Drought Index Sensitive to Global Warming: The Standardized Precipitation Evapotranspiration Index", Journal of Climate, Vol. 23, PP. 1696-1718.
34) Waterbury J.A., Mark, D.R., (2008), "Livestock Risk Protection Insurance", Published by University of Nebraska-Lincoln Extension, Institute of Agriculture and Natural Resources, G1723.