http://www.scirp.org/journal/jep ISSN Online: 2152-2219
ISSN Print: 2152-2197
Efficiency Evaluation of Extraction Methods
for Analysis of OCPs and PCBs in Soils
of Varying TOC
Ulrike Mülow-Stollin, Petra Lehnik-Habrink, Stephanie Kluge, Wolfram Bremser,
Christian Piechotta
Bundesanstalt für Materialforschung Und-Prüfung (BAM), Berlin, Germany
Abstract
Organochlorine pesticides and polychlorinated biphenyls are toxic, carcino-genic, and have a high potential for bioaccumulation. Due to their stability, they are still considered an environmental problem even though the use of most of them has been phased out several decades ago. Soil is a matrix which can retain these contaminants to a great extent. This ability is often associated with the total organic carbon content (TOC). In order to judge the pollution status of soil and to make monitoring data more easily comparable a simple, yet robust extraction method is needed. Agitation solid-liquid-extraction is well suited for this purpose. However, the influence of TOC on the analyte recovery has to be known. For the presented study, 12 organochlorine pesti-cides and 7 polychlorinated biphenyls were spiked into four model soils with organic carbon contents between 1.6% - 13.3%. The matrices were extracted using solid-liquid extraction between 45 minutes and 16 hours. For compari-son, all soils were also extracted using pressurised liquid extraction and Soxh-let extraction. After clean-up the extracts were measured using a gas chroma-tography-mass spectrometry (GC-MS) system. Statistical analysis of the re-sults implied that the TOC content of the soils did not have significant influ-ence on the extraction efficiency. A longer solid-liquid extraction time did not necessarily increase analyte recovery: Extraction for one hour resulted in 88% recovery while 16 hour extraction led to 89%. Thus, the efficiency of all the methods was comparable for all model soils. Additional investigations re-garding GC liner performance highlighted the need for isotopically labelled standards during the analysis of thermolabile pesticides.
Keywords
POP, Soil Organic Matter, Solid-Liquid Extraction, Pressurised Liquid Extraction
How to cite this paper: Mülow-Stollin, U., Lehnik-Habrink, P., Kluge, S., Bremser, W. and Piechotta, C. (2017) Efficiency Evalua-tion of ExtracEvalua-tion Methods for Analysis of OCPs and PCBs in Soils of Varying TOC. Journal of Environmental Protection, 8, 693- 713. https://doi.org/10.4236/jep.2017.86045
Received: May 11, 2017 Accepted: June 24, 2017 Published: June 27, 2017
Copyright © 2017 by authors and Scientific Research Publishing Inc. This work is licensed under the Creative Commons Attribution International License (CC BY 4.0).
1. Introduction
sev-eral advantages over naturally contaminated soil. First of all, when only two characterised raw materials for production of several model soils are used the number of degrees of freedom is greatly reduced. Additionally, a well characte- rised, commercially available reference soil can be used. Naturally contaminated soils which adhere to certain criteria are not easily obtained. The most dominant influencing factor which remains is the total organic carbon (TOC) content of the model soils. Besides, this has the additional benefit that the nature of the humic fraction stays the same for all model soils. Finally, when uncontaminated model soils are spiked, the spiked concentration is known and can be the base of all analyte recovery calculations. This way the absolute percentage of extracted analyte can be evaluated. If instead a reference method was used to determine what 100% recovery signifies, the study design would be more prone to overlook actual over- and underestimations.
The project presented in this paper aimed to compare the performance of SLE of varying duration to that of PLE and Soxhlet extraction in soils of differing TOC contents. Model soils prepared from a reference soil and a compost were spiked with 12 OCPs and 7 PCBs which were selected as representatives for the whole group of contaminants. The aspects taken into ac-count for the choice of analytes were their ongoing use or production [15][16], their presence in Euro-pean soils [17], and the existence of well-established detection methods using gas chromatography [18].
2. Materials and Methods
2.1. Chemicals and Reagents
All solutions were prepared gravimetrically. For 12-point-calibration, appropri-ate volumes of Pesticide-Mix 17 (10 µg·ml−1 in cyclohexane) and PCB Mix 3 (100
µg·ml−1 in isooctane) were diluted using cyclohexane. As internal standard a
mixture of PCB 30 and PCB 209 (25.43 µg·g−1 and 25.23 µg·g−1 in cyclohexane)
and as injection standard a solution of PCB 198 (1.98 µg·g−1 in cyclohexane)
were used. For extraction, acetone and cyclohexane (picograde) were employed. All of the above were purchased from LGC Standards GmbH (Wesel, Germany). For testing the influence of the GC liner a mixture of 13C-4,4’DDT, 13C 4,4’ DDD, 13C-4,4’ DDE, 13C-α-HCH, 13C-HCB, and 13C-dieldrin (2 µg·mL−1 each, in
cyclo-hexane) prepared from solutions purchased from Cambridge Isotope Laborato-ries (Tewksbury, Massachusetts, USA) were used.
2.2. Preparation of Model Soils
Model soils were generated from compost (TOC = 16.1%, finished compost from green waste, dry fermentation), spiked com-post, and RefeSol 01 A [19]
Table 1. Components of model soils and resulting TOC. m
(spiked compost)/g m (RefeSol 01-A)/g m (compost)/g (measured value) TOC/%
50 2274 76 1.6 ± 0.2
50 1654 696 5.0 ± 0.5
50 910 1440 9.2 ± 0.5
50 166 2184 13.3 ± 0.4
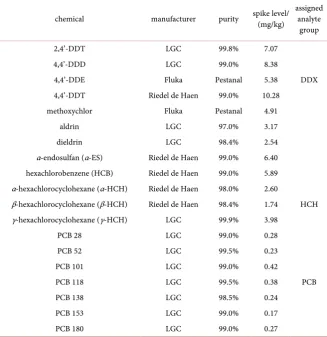
Table 2. Chemicals used during the study and spike level in the resulting model soils.
chemical manufacturer purity spike level/ (mg/kg) assigned analyte group
2,4’-DDT LGC 99.8% 7.07
DDX
4,4’-DDD LGC 99.0% 8.38
4,4’-DDE Fluka Pestanal 5.38 4,4’-DDT Riedel de Haen 99.0% 10.28 methoxychlor Fluka Pestanal 4.91
aldrin LGC 97.0% 3.17
dieldrin LGC 98.4% 2.54
α-endosulfan (α-ES) Riedel de Haen 99.0% 6.40 hexachlorobenzene (HCB) Riedel de Haen 99.0% 5.89 α-hexachlorocyclohexane (α-HCH) Riedel de Haen 98.0% 2.60
HCH β-hexachlorocyclohexane (β-HCH) Riedel de Haen 98.4% 1.74
γ-hexachlorocyclohexane (γ-HCH) LGC 99.9% 3.98
PCB 28 LGC 99.0% 0.28
PCB
PCB 52 LGC 99.5% 0.23
PCB 101 LGC 99.0% 0.42
PCB 118 LGC 99.5% 0.38
PCB 138 LGC 98.5% 0.24
PCB 153 LGC 99.0% 0.17
PCB 180 LGC 99.0% 0.27
2.3. Spiking
OCPs and PCBs were dissolved in acetone (100 ml) and added to a slurry of compost (200 g, ≤2 mm) and acetone. The mixture was covered with aluminium foil and left to evaporate at room temperature for two weeks.
The spiked compost was divided into four parts of equal weight and blended with different amounts of unspiked compost and RefeSol 01 A to yield model soils of different total organic carbon content and the same OCP and PCB con-tent (Table 1).
2.4. Total Organic Carbon
[image:4.595.209.537.214.552.2]according to the method published by Vogel et al. [22]. The soil TOC content
(Table 1) was determined by subtraction of total inorganic carbon from total
carbon of the respective soil. In brief, the total carbon content of the samples was determined using combustion with pure oxygen at 950˚C and quantification of evolving carbon dioxide by infrared technology. For total inorganic carbon evaluation, samples were mixed with hot phosphoric acid and produced carbon dioxide was detected.
2.5. Material Homogeneity
The soils were mixed with a drum hoop mixer (ELTE 650/RGM, J. Engelsmann AG, Ludwigshafen, Germany) for 24 h and homogenised using the cross-riffling procedure (sample divider PT100, Retsch Technology GmbH, Haan, Germany). Of the resulting 56 bottles (content around 42 g soil each), four were chosen for inter- and intra-bottle homogeneity testing. Every bottle was analysed in tripli-cate using solid-liquid-extraction (SLE) in accordance with DIN 10382 (see sec-tion 2.7) and detecsec-tion by GC-MS. Homogeneity was assessed using ANOVA.
2.6. Stability
During the project, stability of the materials was checked by analysing a control sample every week. For this purpose, 10 g of the soil with 9.2% TOC were ex-tracted in accordance with DIN ISO 10382 (Table 3). The median recovery after 50 days was 93.9% and thus, materials were judged stable during the period of investigation.
2.7. Analysis
2.7.1. Extraction
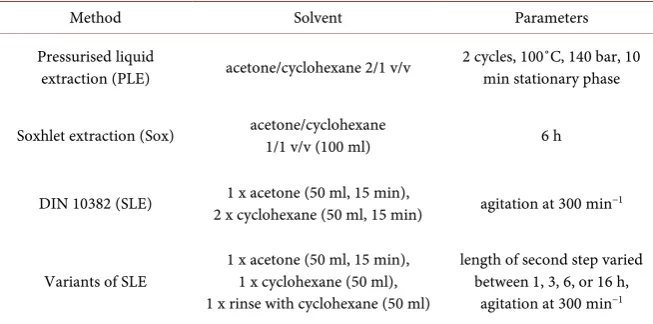
[image:5.595.208.535.572.734.2]PLE, Soxhlet extraction (Sox), as well as variations of SLE were evaluated. All glassware was rinsed with cyclohexane and acetone before experiments. For every analysis, 10 g of soil spiked with 500 µl of internal standard solution (con-centration see 2.1) prior to extraction were used. Extraction parameters are summarised in Table 3.
Table 3. Overview of applied extraction methods.
Method Solvent Parameters
Pressurised liquid
extraction (PLE) acetone/cyclohexane 2/1 v/v 2 cycles, 100˚C, 140 bar, 10 min stationary phase
Soxhlet extraction (Sox) acetone/cyclohexane 1/1 v/v (100 ml) 6 h
DIN 10382 (SLE) 2 x cyclohexane (50 ml, 15 min) 1 x acetone (50 ml, 15 min), agitation at 300 min−1
Variants of SLE 1 x acetone (50 ml, 15 min), 1 x cyclohexane (50 ml), 1 x rinse with cyclohexane (50 ml)
length of second step varied between 1, 3, 6, or 16 h,
2.7.2. Pressurised Liquid Extraction (PLE)
A soil sample was weighed into a 22 ml PLE-cell and internal standard was add-ed. Subsequently, the sample was extracted according to the procedure noted in
Table 3 using a Dionex ASE 200 (Thermo Scientific, Sunnyvale, CA, USA). The
following procedure was carried out for all samples, regardless of the applied ex-traction technique: Obtained extracts were washed with deionised water (2 × 400 ml), dried over sodium sulfate, and concentrated to 5 ml using a Turbo Vap II (Biotage Concentration Workstation, Uppsala, Sweden). An aliquot of 100 µl underwent the clean-up procedure.
2.7.3. Soxhlet Extraction (Sox)
Internal standard was added to a soil sample weighed into an extraction thimble (MN645, 33 × 80 mm idxh, Macherey-Nagel GmbH & Co. KG, Düren, Germa-ny). After placing the thimble in a Soxhlet apparatus the solvent mixture was added to the equipped 250 ml round-bottom flask. The solvent was then heated to reflux. Extraction parameters can be found in Table 3. After extraction was completed the obtained extract was treated as described for PLE.
2.7.4. Solid-Liquid Extraction According to DIN ISO 10382
A soil sample, internal standard, and acetone (50 ml) were put into a 250 ml Er-lenmeyer flask. After 15 min of agitation (300 min−1, horizontal shaker HS501
digital, IKA Werke GmbH & Co. KG, Staufen, Germany) a portion of cyclohex-ane (50 ml) was added. Following an extraction period of another 15 min, the supernatant was decanted into a 1 L separating funnel. To the soil cyclohexane (50 ml) was added and it was extracted again for 15 min. Finally, the organic ex-tracts were combined and treated further as explained for PLE.
2.7.5. SLE Variants
A soil sample was weighed into a 250 ml Erlenmeyer flask and internal standard as well as acetone (50 ml) were added. After agitation for 30 min cyclohexane (50 ml) was added and the mixture was extracted for 1, 3, 6 or 16 hours (Table 3). Subsequently, the supernatant was decanted into a 1 L separating funnel and the extract was washed as mentioned for PLE.
2.7.6. Clean-Up Procedure
Prior to use, aluminium oxide (neutral, activity Super I, J. T. Baker, Avantor Performance Materials B. V., Deventer, The Netherlands) was heated to 150˚C for five hours and left to cool in a desiccator. Subsequently, the dried aluminium oxide was deactivated using 10 wt % water. After storing in the absence of air for one day it was ready to use.
2.7.7. GC-MS Measurements
GC-MS analysis was competed using an Agilent GC 6890, MSD 5973N (Agilent Technologies, Waldbronn, Germany) with a HT 8 column (50 m, 0.22 mm i.d., 0.25 µm f.t.) (SGE Analytical Science, Ringwood, Australia). The carrier gas was helium (He 5.0) at a flowrate of 1ml/min. The injector was split/splitless, 1 µl of sample was injected with a split flow 20 ml/min at 1 min. The oven was pro-grammed with an initial hold of 1 min at 50˚C, followed by a ramp of 50˚C/min to 168˚C, a second ramp of 4˚C/min to 310˚C, and a final hold time of 15 min. The mass spectrometer parameters were EI 70 eV, selected ion mode (SIM), with a solvent delay of 6 minutes.
Instrument (Agilent Technologies, Waldbronn, Germany) Agilent GC 6890, MSD 5973N
Carrier Gas He 5.0, 1 ml/min
MSD Parameters EI 70 eV, selected ion mode (SIM), solvent delay 6 min Injection split/splitless injector, 1 µl, split flow 20 ml/min @ 1 min
Liner (Gerstel GmbH & Co. KG, Mühlheim an der Ruhr, Germany) glass liner, baffled and deactivated
Column HT 8, 50 m, 0.22 mm inner diameter, 0.25 µm film thickness (SGE Analytical Science, Ringwood, Australia)
Oven Programme 1 min at 50˚C, with 50˚C/min to 168˚C, with 4˚C/min to 310˚C, 15 min at 310˚C
PTV Gerstel KAS 4 (Gerstel GmbH & Co. KG, Mühlheim an der Ruhr, Germany)
2.8. Quality Assurance
Prior to the start of the extractions of the model soils, a certified reference ma-terial (ERM-007a) was analysed in accordance with DIN ISO 10382 to ensure adequate operation of methodology.
All extractions were carried out in quadruplicate. One control sample was analysed every week (section 2.2). The average standard deviation of compound concentrations in the control samples was 13.5% while the same value in the homogeneity studies was 8.1%.
The initial calibration used 12 points in the linear working range (0.01 - 5 µg). Two points were recalibrated during every measurement sequence. The mea-surement system performance was checked by evaluation of the area of the sig-nal of PCB 198 (injection standard). The GC-liners were replaced in between runs or after a maximum of 100 injections. A blank value (solvent only) was measured after every sample run to ensure that carry-over was not significant.
2.9. Statistics
statistic values including mean, median, standard deviation of the mean, and median absolute deviation as the dispersion estimate for the median were calcu-lated. Hierarchical cluster analysis versus the extraction method was carried out. Euclidian distances and Ward linkage were used.
The above was carried out for any analyte under consideration separately, for groups of chemically similar behaving analytes, and all results of the study (see correspondingly sections 3.1 to 3.3 of this paper). As long as different analyte le-vels had to be combined or compared, statistical analysis referred to normalised values, i.e. recovery rates obtained from normalisation against the spiked values.
Recovery rates were calculated using measurement results and the gravimetric data for spiking, treated as above, and dis-played in graphs as shown (for the low-level TOC) under Figure 2.
Cluster analysis aimed at defining the best extraction procedure (assessed by the recovery rate) and included all analytes not (overwhelmingly) restricted (re-coveries above 100% or clearly not normal data distribution). For the graph shown under Figure 4, analytes showing these peculiarities have been excluded, namely PCB 28, 52, 138; dieldrin, and methoxychlor.
3. Results and Discussion
In order to perform the data analysis in an extensive, yet comprehensible way a simplification approach was used. At first, the recovery of all analyte groups was evaluated separately in each soil and for each extraction method. As a next step, the results were judged independently of the different soil matrices. Finally, the data were reviewed for all analytes and matrices combined.
3.1. Analyte Group Specific Evaluation
Since the spiked PCBs vary only slightly in their structure, they were expected to behave quite similarly during extraction and clean-up. The OCPs however are a much more diverse group. They differ greatly in polarity, stability, and volatility
[24]. Hence, uniform extraction behaviour was not expected and an evaluation focussing on the different substance classes was thought to be more helpful.
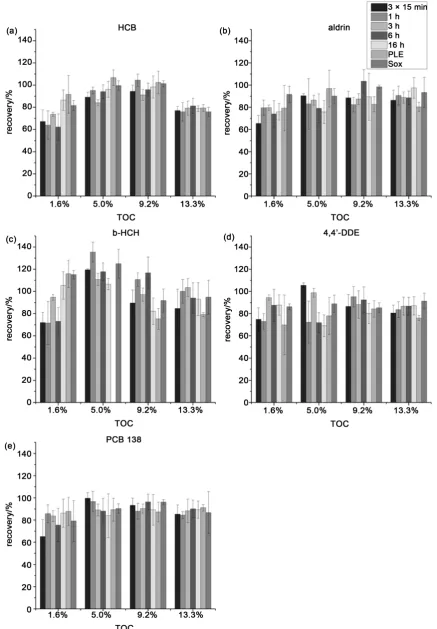
3.1.1. Dependence on Soil Type
ever, the mean values and standard deviations calculated for each separate ex-traction method are most similar for the soil of highest TOC and they differ the most for the soil with low TOC. In the latter case prolonged extraction time and more drastic conditions (PLE, Soxhlet extraction) lead to higher HCB recovery. Nevertheless, none of these variations are statistically significant and no general rule can be deduced. Of all the analytes which were evaluated the standard devi-ations are always lowest for HCB as it can be very well measured using a GC MS system. This is also the reason why HCB is sold as a com-pound on which to judge system performance.
Concerning the analyte aldrin (Figure 1(b)), the results are fairly similar. Overall, a minimum recovery of (65% ± 7%) (1.6% TOC, 3 × 15 min agitation SLE) and maximum of (103% ± 11%) (9.2% TOC, 6 h agitation SLE) were achieved. The mean extraction efficiencies do however not differ as much as for HCB. Regardless, the differences between extraction methods are also not statis-tically significant. In the case of aldrin it has to be noted that it is known to de-grade into its epoxy analogue dieldrin very quickly [28][29]. As a comparison with the values obtained for dieldrin recovery showed (data not displayed) it is possible that part of the aldrin has already been converted. This is also supported by comparing median values of all recoveries for aldrin and dieldrin. The me-dian of aldrin (87%) is lower than the meme-dian for Dieldrin (107%).
In the case of the HCH group (Figure 1(c)) findings do not differ much from those described for the other analytes. It is however noticeable that the standard deviations are higher (up to 19%) and the recoveries are the lowest in case of the model soil with 1.6% TOC content (compare HCB). For this matrix slightly bet-ter recoveries are achieved as well when the SLE time is longer or a more intense method like Soxhlet extraction or PLE is used.
As a representative of the group of DDT, its metabolites, and related com-pounds (henceforth called DDX), the graph for 4,4’ DDE is shown (Figure 1(d)). Recovery rates range from (69% ± 10%) (5.0%, 16 h agitation SLE) to (106% ± 2%) (5.0% TOC, 3 × 15 min agitation SLE). A clear dependency of re-covery on soil type cannot be determined. 4,4’ DDE is the most stable of the DDT metabolites. For the other DDX, high overestimations were found in some cases (>140%, data not considered).
This instance is illustrated in Figure 2 in which the recoveries for all analytes in the low-level TOC model soil can be found. Concerning the 3 × 15 minute and 1 hour SLE, the recovery values of most analytes are below 1. This is the generally pected case, as the total analyte content may not be available for ex-traction due to formation of NER. With a longer exex-traction period (16 hours) or the use of Soxhlet extraction the apparent recovery of the DDX increases drasti-cally to levels above 100%. This increase is attributed to analyte decomposition
Figure 2. Recoveries as assessed for the measurands under consideration in the low-level TOC soil using SLE with 3 × 15 min, 1 h, 16 h and Soxhlet extraction. All “explainable” values are below the unity line (recovery = 1), all unexpected above.
Judging from the data obtained during this study PCBs do not seem to be a point of concern during SLE from soils. The data for PCB 138 are shown in
Fig-ure 1(e). A connection between longer agitation times and higher recoveries
cannot be found in this case.
Considering all the results, it can be concluded that the analyte recovery is not significantly dependent on the TOC content of the model soils used in this study. No relationship can be observed. Of course, fluctuations in recovery can-not solely be attributed to this soil property [32]. Regardless, it was unexpected how little impact the TOC content seemed to have. It has been discussed before that the type of organic matter which makes up the TOC content has a greater impact on NER formation and extractability of pollutants [33]. Concerning OCPs and PCBs especially the aromaticity of soil organic matter should have an influence on analyte recovery [34]. A detailed characterisation of the soil organic matter in the model soils could lead to some insight.
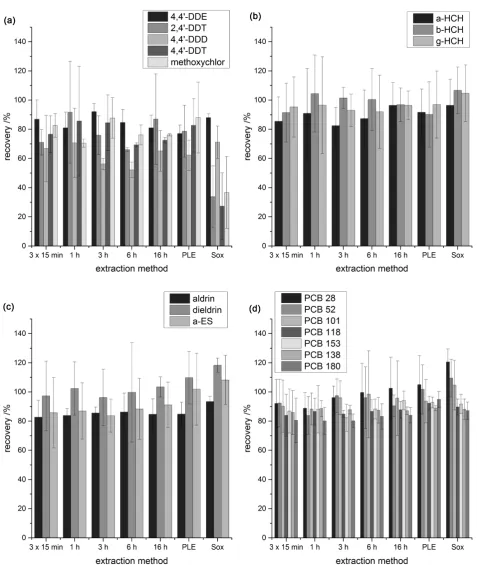
3.1.2. Dependence on Extraction Method
Figure 3. Recovery of (a) DDX, (b) HCH, (c) aldrin, dieldrin, and α-ES, and (d) PCB in % of spiked concentration using different extraction techniques. The error bars indicate the standard deviation (n = 4).
re-evaluated independent of the amount of soil organic matter. Figure 3(a)
h agitation SLE). The degradation products of DDT, 4,4’ DDE and 4,4’ DDD, generally show acceptable recovery for all extraction methods. With recoveries as low as 27% of the spiked concentration, the use of Soxhlet is not suitable for extraction of 2,4’ DDT, 4,4’ DDT, and methoxychlor. This can be associated with the thermolability of these analytes which leads to degradation during the ex-traction cycles [35]. The comparably low recovery of DDX using Soxhlet has al-ready been noted by several researchers [36]. Surprisingly, Soxhlet extraction is widely used for these analytes. The standard deviations for all DDX except 4,4’ DDE are relatively high, up to 38%. This can be attributed to the condition of the GC liner and is discussed in Section 3.3.
The extraction of the HCH (Figure 3(b)), aldrin, dieldrin, and α-endosulfan (α ES) (Figure 3(c)) is possible with all employed ex-traction methods. Recove-ries range from (83% ± 12%) (aldrin, 3 × 15 min SLE) to (118% ± 5%) (dieldrin, Soxhlet) with accepta-ble standard deviations. Yet, it is to be noticed that the mean value of dieldrin is higher than that of aldrin for all experiments. A possible explanation for this effect might be the conversion of aldrin into the more stable dieldrin in soils (see above) [28]. In literature there are already some studies avail-able which deal with a comparison of OCP extraction from soils using different techniques. Most of them focus on Soxhlet, PLE, ultrasonic-assisted extraction, and microwave-assisted extraction, which are not found to differ much in extrac-tion efficiency [37]. Our study is able to show that SLE also performs satisfactory. Concerning the PCBs (Figure 3(d)) a review of the data does not give a most favourable extraction method, either. Admittedly, the mean recovery of the PCBs with less chlorine substituents seems to increase slightly when the agita-tion time is longer. Since PCBs are considered very thermostable, Soxhlet is also applicable and yield satisfying results. Previously published studies have also shown that results from Soxhlet extraction, PLE, and microwave-assisted extrac-tion are usually comparable for PCBs [38][39][40]. In the standard EN 16167 [41]
which describes the extraction of PCBs from sludge, treated biowaste, and soil the duration of the SLE is required to be 12 hours. The results of our study do however demonstrate that such a long extraction is not necessary for the matrix soil.
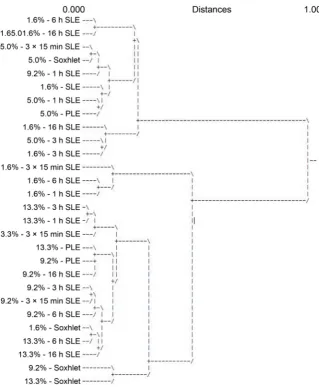
In summary, no preferred extraction method for any analyte group could be identified. The results of this study do not lead to the assumption that prolonged SLE time leads to better recovery. This is supported by cluster analysis as shown
in Figure 4. There are clearly two groups differing from each other. The second
group encompasses all extractions of the 13.3% TOC soil. As for the other soils, no clear assignment to one group is evident. The same holds for the different ex-traction methods. Hence, an exex-traction method with superior performance can-not be identified.
3.2. Evaluation for Total Analyte Spectrum
Figure 4. Hierarchical clustering of all data obtained sorted by extraction method (Eucli-dian distance, Ward linkage).
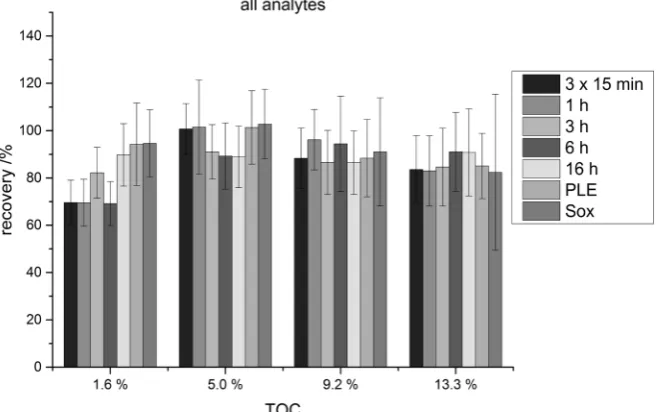
Figure 5. Recovery of all analytes (in % of spiked concentration) from soils of varying
[image:14.595.253.497.502.690.2]soil TOC content and applied extraction technique. For this reason, the data set was re-evaluated using the mean recoveries of all analytes. To verify the previous results, Figure 5 shows the recoveries for all analytes in dependence of model soil TOC. Generally, all extraction methods give more or less the same results, independent of the soil type. Concerning the soil with the lowest TOC however, prolonged agitation and the use of other extraction techniques lead to higher mean recoveries by about 20%. This has also been noted for single analytes, as described in the previous section. When taking into account the standard devia-tions which are in the range of 10 20%, the t-test at a 95% confidence level does however give as a result that none of these findings differ significantly. There-fore, it is possible to neglect classification of the data altogether and handle them as a single population. Figure 6 illustrates this approach. The differences in the performance of certain extraction techniques are greatly diminished when all analytes and all model soils are considered simultaneously. Recoveries range from 86% (3 × 15 min) to 93% (PLE, Sox). The standard deviations exceed the differences between the means by far. Hence, the performance of all extraction methods can be seen as equivalent. The more intense extraction techniques do not lead to a significantly better analyte recovery than SLE. However, they do offer some advantages (Table 4). An analysis done with PLE or Soxhlet requires less solvent and the washing step is facilitated as no matrix particles get into the solvent phase as may be the case during decanting from an Erlenmeyer flask. PLE is also faster and can be automated. Additionally, the manual work load is lower. Nevertheless, PLE and Soxhlet should preferrably be used for the extrac-tion of thermolabile analytes in combinaextrac-tion with labelled internal standards (see Sections 3.1 and 3.3). Additonally, they call for trained personnel, whereas SLE is relatively easy to execute.
Figure 6. Recovery of all analytes (in % of spiked concentration) using different
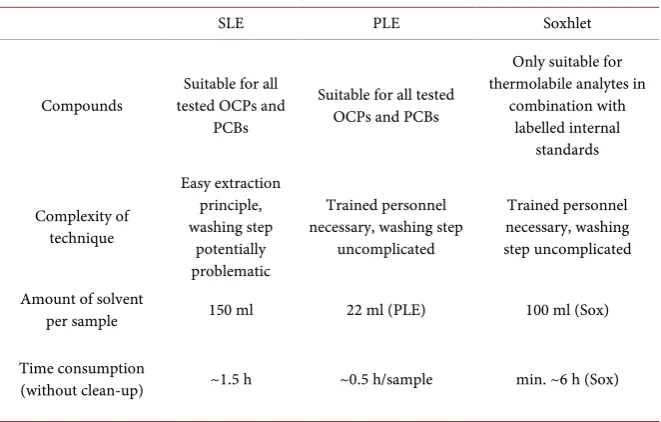
Table 4. Advantages and disadvantages of SLE, PLE, and Soxhlet.
SLE PLE Soxhlet
Compounds tested OCPs and Suitable for all PCBs
Suitable for all tested OCPs and PCBs
Only suitable for thermolabile analytes in
combination with labelled internal standards Complexity of technique Easy extraction principle, washing step potentially problematic Trained personnel necessary, washing step
uncomplicated
Trained personnel necessary, washing step uncomplicated
Amount of solvent
per sample 150 ml 22 ml (PLE) 100 ml (Sox)
Time consumption
(without clean-up) ~1.5 h ~0.5 h/sample min. ~6 h (Sox)
3.3. Use of Internal Standards and GC Liners
Undoubtedly, the GC liner has a great influence on the reproducibility of ana-lytical results. Its inertness is of decisive importance, as analytes may adsorb to active sites in the inlet system and are thus lost to analysis [31]. When matrix contami-nated samples are injected, high boiling residues accumulate in the lin-er [42]. These are known to promote the breakdown of several OCPs, for exam-ple endrin and DDT, thereby leading to underestimations [43] [44] [45]. This phenomenon has been used to judge the performance of inert liners and capil-lary columns [46][47][48].
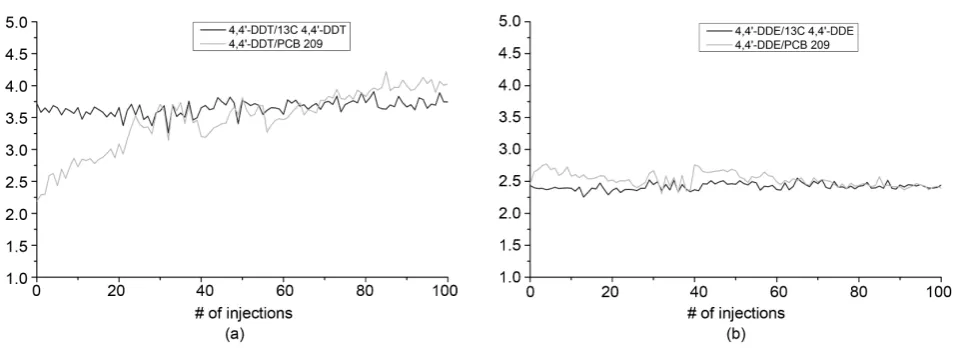
In this study, an unexpected reverse effect was noticed. In several cases the analyte content was greatly overestimated (>140%) for the thermolabile DDX and dieldrin. To gain insight into this problem, a soil extract of the campaign was additionally spiked with 13C-labelled standards and injected 100 times,
starting with a new liner. The results for the thermolabile 4,4’ DDT and the ther-mostable 4,4’ DDE are shown in Figure 7. For both analytes the ratio of the native and 13C-labelled substance remain more or less the same for all injections.
Howev-er, when PCB 209 is employed as internal standard it can be noticed that after 100 injections the ratio of 4,4’ DDT/PCB 209 has increased by a factor of around 1.5, even though the area of PCB 209 does not decrease. This is not the case for 4,4’ DDE: The performance of the labelled standard and PCB 209 is comparable.
Figure 7. Ratios of the area of 4,4’-DDT and 4,4’-DDE versus the 13C-labelled substances and PCB 209 as internal standard over the course of 100 injections.
problem, it is advisable to use for example matrix calibration, analyte protec-tants, or labelled standards [50][51]. The latter may be a simple solution, but high financial cost is associated with this approach. In this study, it could be shown that the use of labelled standards for critical analytes helps to counter-balance changing conditions in the injection system.
4. Conclusion
Based on the data obtained during this study, no relation between the TOC con-tent of the model soils and analyte recovery could be identified. Additionally, no clear correlation between the duration of SLE and recovery of analytes could be found. For PLE and Soxhlet extraction, analyte recoveries are comparable to those of SLE. However, the analysis of thermolabile pesticides is only appropri-ate when used in combination with 13C-labelled standards. When taking into
account the typically high standard deviations, SLE with short extraction times are also suitable for extraction of PCBs and OCPs from soil. To overcome matrix effects during GC MS measurements it is preferred to use isotopically labelled standards. However, for certain analytes, e.g. PCBs, other internal standards may be applicable.
Acknowledgements
The authors thank P. Hoelzmann (Freie Universität Berlin) for the TOC mea-surements and U. Kalbe (BAM) for providing RefeSol and compost.
References
[1] United Nations Environment Programme (2001) Stockholm Convention on Persis-tent Organic Pollutants.
[2] Barrie, L.A., Gregor, D., Hargrave, B., Lake, R., Muir, D., Shearer, R., Tracey, B. and Bidleman, T. (1992) Arctic Contaminants: Sources, Occurrence and Pathways.
Science of the Total Environment, 122, 1-74.
in Arctic Marine Food Chains: Accumulation of Specific Polychlorinated Biphenyls and Chlordane-Related Compounds. Environmental Science & Technology, 22, 1071-1079. https://doi.org/10.1021/es00174a012
[4] Willett, K.L., Ulrich, E.M. and Hites, R.A. (1998) Differential Toxicity and Envi-ronmental Fates of Hexachlorocyclohexane Isomers. Environmental Science & Tech- nology, 32, 2197-2207. https://doi.org/10.1021/es9708530
[5] United Nations Environment Programme (2007) Global Monitoring Plan on Per-sistent Organic Pollutants.
[6] Bollag, J.M. and Loll, M.J. (1983) Incorporation of Xenobiotics into Soil Humus.
Experientia, 39, 1221-1231. https://doi.org/10.1007/BF01990359
[7] Haider, K., Spiteller, M., Reichert, K. and Fild, M. (1992) Derivatization of Humic Compounds: An Analytical Approach for Bound Organic Residues. International Journal of Environmental Analytical Chemistry, 46, 201-211.
https://doi.org/10.1080/03067319208027010
[8] Roberts, T.R. (1984) Non-Extractable Pesticide Residues in Soils and Plants. Pure and Applied Chemistry, 56, 945-956. https://doi.org/10.1351/pac198456070945 [9] Gevao, B., Semple, K.T. and Jones, K.C. (2000) Bound Pesticide Residues in Soils: A
Review. Environmental Pollution, 108, 3-14.
[10] Barriuso, E., Benoit, P. and Dubus, I.G. (2008) Formation of Pesticide Nonextracta-ble (Bound) Residues in Soil: Magnitude, Controlling Factors and Reversibility. En-vironmental Science & Technology, 42, 1845-1854.
https://doi.org/10.1021/es7021736
[11] Gevao, B., Jones, K.C. and Semple, K.T. (2005) Formation and Release of Non-Ex- tractable 14C-Dicamba Residues in Soil under Sterile and Non-Sterile Regimes. En-vironmental Pollution, 133, 17-24.
[12] Scheunert, I. and Schroder, P. (1998) Formation, Characterization and Release of Non-Extractable Residues of [14C]-Labeled Organic Xenobiotics in Soils.
Environ-mental Science and Pollution Research, 5, 238-244. https://doi.org/10.1007/BF02986407
[13] Barriuso, E., Houot, S. and SerraWittling, C. (1997) Influence of Compost Addition to Soil on the Behaviour of Herbicides. Pest Management Science, 49, 65-75. https://doi.org/10.1002/(SICI)1096-9063(199701)49:1<65::AID-PS488>3.0.CO;2-Z [14] Nestler, A. (2007) Bestimmung der Messunsicherheit für die Verfahren und Metho-
den zur Bodenanalytik des Anhangs 1 der Bundes-Bodenschutz- und Altlasten- verordnung. Ph.D. Thesis, Freie Universität, Berlin.
[15] Li, Y.F. and Macdonald, R.W. (2005) Sources and Pathways of Selected Organoch-lorine Pesticides to the Arctic and the Effect of Pathway Divergence on HCH Trends in Biota: A Review. Science of the Total Environment, 342, 87-106.
[16] Bakore, N., John, P.J. and Bhatnagar, P. (2004) Organochlorine Pesticide Residues in Wheat and Drinking Water Samples from Jaipur, Rajasthan, India. Environmen-tal Monitoring and Assessment, 98, 381-389.
https://doi.org/10.1023/B:EMAS.0000038197.76047.83
[17] Aichner, B., Bussian, B., Lehnik-Habrink, P. and Hein, S. (2013) Levels and Spatial Distribution of Persistent Organic Pollutants in the Environment: A Case Study of German Forest Soils. Environmental Science & Technology, 47, 12703-12714. https://doi.org/10.1021/es4019833
https://doi.org/10.1007/s11368-010-0241-3 [19] Fraunhofer IME, Schmallenberg, Germany.
http://www.refesol.de/english/index.shtml
[20] Düwel, O., Siebner, C.S., Utermann, J. and Krone, F. (2007) Gehalte an Organischer Substanz in Oberböden Deutschlands. Bundesanstalt für Geowissenschaften und Rohstoffe.
https://www.google.ie/url?sa=t&rct=j&q=&esrc=s&source=web&cd=1&cad=rja&ua ct=8&ved=0ahUKEwiasZyJiNDUAhUqKcAKHWF6A3gQFggvMAA&url=https%3 A%2F%2Fwww.bgr.bund.de%2FDE%2FThemen%2FBoden%2FProdukte%2FSchrif ten%2FDownloads%2FHumusgehalte_Bericht.pdf%3F__blob%3DpublicationFile&
usg=AFQjCNFl395ygTKjYGMiLN2IP9T5wSeZuw
[21] Bundes-Bodenschutz- und Altlastenverordnung (1999).
[22] Vogel, S., Märker, M., Rellini, I., Hoelzmann, P., Wulf, S., Robinson, M., Steinhübel, L., Di Maio, G., Imperatore, C., Kastenmeier, P., Liebmann, L., Esposito, D. and Seiler, F. (2016) From a Stratigraphic Sequence to a Landscape Evolution Model: Late Pleistocene and Holocene Volcanism, Soil Formation and Land Use in the Shade of Mount Vesuvius (Italy). Quaternary International, 394, 155-179.
[23] DIN ISO 10382 (2002) Bodenbeschaffenheit—Bestimmung von Organochlorpesti- ziden und polychlorierten Biphenylen—Gaschromatographisches Verfahren mit Elektronenein fang-Detektor.
[24] Shen, L. and Wania, F. (2005) Compilation, Evaluation, and Selection of Physi-cal-Chemical Property Data for Organochlorine Pesticides. Journal of Chemical & Engineering Data, 50, 742-768. https://doi.org/10.1021/je049693f
[25] Wang, W., Meng, B., Lu, X., Liu, Y. and Tao, S. (2007) Extraction of Polycyclic Aromatic Hydrocarbons and Organochlorine Pesticides from Soils: A Comparison between Soxhlet Extraction, Microwave-Assisted Extraction and Accelerated Sol-vent Extraction Techniques. Analytica Chimica Acta, 602, 211-222.
[26] Hofman, J., Rhodes, A. and Semple, K.T. (2008) Fate and Behaviour of Phenanth-rene in the Natural and Artificial Soils. Environmental Pollution, 152, 468-475. [27] United States Environmental Protection Agency (2007) SW-846, Method 8081B:
Organochlorine Pesticides by Gas Chromatography.
[28] Ferguson, J.A. and Korte, F. (1977) Epoxidation of Aldrin to Exo-Dieldrin by Soil Bacteria. Applied and Environmental Microbiology, 34, 7-13.
[29] Jorgenson, J.L. (2001) Aldrin and Dieldrin: A Review of Research on Their Produc-tion, Environmental Deposition and Fate, BioaccumulaProduc-tion, Toxicology, and Epi-demiology in the United States. Environmental Health Perspectives, 109, 113-139. [30] Foreman, W.T. and Gates, P.M. (1997) Matrix-Enhanced Degradation of p,p’-DDT
during Gas Chromatographic Analysis: A Consideration. Environmental Science & Technology, 31, 905-910. https://doi.org/10.1021/es960671q
[31] Erney, D.R., Gillespie, A.M., Gilvydis, D.M. and Poole, C.F. (1993) Explanation of the Matrix-Induced Chromatographic Response Enhancement of Organophospho-rus Pesticides during Open Tubular Column Gas Chromatography with Splitless or Hot On-Column Injection and Flame Photometric Detection. Journal of Chroma-tography A, 638, 57-63.
[32] Pignatello, J.J. (1998) Soil Organic Matter as a Nanoporous Sorbent of Organic Pol-lutants. Advances in Colloid and Interface Science, 76-77, 445-467.
Environ-mental Science & Technology, 33, 2193-2203. https://doi.org/10.1021/es981071p [34] Xing, B. (1997) The Effect of the Quality of Soil Organic Matter on Sorption of
Naphthalene. Chemosphere, 35, 633-642.
[35] Evans, J., Kaake, R.H., Orr, M. and Watwood, M. (1998) A Comparison of Ultraso-nication and Soxhlet Methods for DDT Extraction from Soil. Journal of Soil Con-tamination, 7, 589-597.
[36] Hubert, A., Wenzel, K.-D., Manz, M., Weissflog, L., Engewald, W. and Schüürmann, G. (2000) High Extraction Efficiency for POPs in Real Contaminated Soil Samples Using Accelerated Solvent Extraction. Analytical Chemistry, 72, 1294-1300. https://doi.org/10.1021/ac991005l
[37] Salvadó, V., Alcaide, A., Carandell, N. and Hidalgo, M. (2001) Evaluation of Extrac-tion Procedures of Organochlorine Pesticides from Natural Waters and Sediments.
International Journal of Environmental Analytical Chemistry, 81, 243-256. https://doi.org/10.1080/03067310108044247
[38] Wang, P., Zhang, Q., Wang, Y., Wang, T., Li, X., Ding, L. and Jiang, G. (2010) Evaluation of Soxhlet Extraction, Accelerated Solvent Extraction and Microwave- Assisted Extraction for the Determination of Polychlorinated Biphenyls and Poly-brominated Diphenyl Ethers in Soil and Fish Samples. Analytica Chimica Acta, 663, 43-48.
[39] Zuloaga, O., Etxebarria, N., Fernández, L.A. and Madariaga, J.M. (1998) Compari-son of Accelerated Solvent Extraction with Microwave-Assisted Extraction and Soxhlet for the Extraction of Chlorinated Biphenyls in Soil Samples. TrAC Trends in Analytical Chemistry, 17, 642-647.
[40] Sporring, S., Bøwadt, S., Svensmark, B. and Björklund, E. (2005) Comprehensive Comparison of Classic Soxhlet Extraction with Soxtec Extraction, Ultrasonication Extraction, Supercritical Fluid Extraction, Microwave Assisted Extraction and Ac-celerated Solvent Extraction for the Determination of Polychlorinated Biphenyls in Soil. Journal of Chromatography A, 1090, 1-9.
[41] DIN EN 16167 (2012) Schlamm, behandelter Bioabfall und Boden-Bestimmung von polychlorierten Biphenylen (PCB) mittels Gaschromatographie mit massenspektro- metrischer Detektion (GC-MS) und Gaschromatographie mit Elektroneneinfang- detektion (GC-ECD).
[42] Wylie, P.L., Klein, K.J., Thompson, M.Q. and Hermann, B.W. (1992) Using Elec-tronic Pressure Programming to Reduce the Decomposition of Labile Compounds during Splitless Injection. Journal of High Resolution Chromatography, 15, 763- 768. https://doi.org/10.1002/jhrc.1240151112
[43] Phillips, D.D., Pollard, G.E. and Soloway, S.B. (1962) Insecticide Analysis, Thermal Isomerization of Endrin and Its Behavior in Gas Chromatography. Journal of Agri-cultural and Food Chemistry, 10, 217-221. https://doi.org/10.1021/jf60121a014 [44] United States Environmental Protection Agency (1999) SW-846, Method 8080A:
Organochlorine Pesticides by Gas Chromatography. Organochlorine Pesticides and Polychlorinated Biphenyls by Gas Chromatography.
Open-Tubular Columns with PEG 20M via the Gas Phase. Journal of Chromato-graphy A, 144, 253-256.
[48] Stan, H.J. and Goebel, H. (1984) Evaluation of Automated Splitless and Manual On-Column Injection Techniques Using Capillary Gas Chromatography for Pesti-cide Residue Analysis. Journal of Chromatography A, 314, 413-420.
[49] Rahman, M.M., Abd El-Aty, A.M. and Shim, J.-H. (2013) Matrix Enhancement Ef-fect: A Blessing or a Curse for Gas Chromatography?—A Review. Analytica Chimi-ca Acta, 801, 14-21.
[50] Maštovská, K., Lehotay, S.J. and Anastassiades, M. (2005) Combination of Analyte Protectants to Overcome Matrix Effects in Routine GC Analysis of Pesticide Resi-dues in Food Matrixes. Analytical Chemistry, 77, 8129-8137.
https://doi.org/10.1021/ac0515576
[51] Tsipi, D., Botitsi, H. and Economou, A. (2015) Mass Spectrometry for the Analysis of Pesticide Residues and Their Metabolites. John Wiley & Sons, Hoboken, NJ.
Submit or recommend next manuscript to SCIRP and we will provide best service for you:
Accepting pre-submission inquiries through Email, Facebook, LinkedIn, Twitter, etc. A wide selection of journals (inclusive of 9 subjects, more than 200 journals)
Providing 24-hour high-quality service User-friendly online submission system Fair and swift peer-review system
Efficient typesetting and proofreading procedure
Display of the result of downloads and visits, as well as the number of cited articles Maximum dissemination of your research work
Submit your manuscript at: http://papersubmission.scirp.org/