An Econometric Approach of Computing
Competitiveness Index in Human Capital
Salahodjaev, Raufhon and Nazarov, Zafar
Institute of Forecasting and Macroeconomic Research, Uzbekistan,
Employment and Disability Institute, Cornell University, USA
2013
Online at
https://mpra.ub.uni-muenchen.de/55273/
An Econometric Approach of Computing Competitiveness Index
in Human Capital
Raufhon Salahodjaev,1
Institute for Forecasting and Macroeconomic Research, Uzbekistan
Zafar Nazarov,
Employment and Disability Institute, Cornell University, USA
The aim of this paper is to provide methodology of estimating oneof the components (pillar) of the Global Competitiveness Index (GCI), health and primary education (HPE) pillar for not included in the Global Competitiveness Report countries using conventional econometric techniques.Specifically, using the weighted least square and bootstrapping methods, we enable to compute the HPE for two countries of the former Soviet Union, Uzbekistan and Belarus and then compare the computed indices to the indices of other countries. This allows us to understand the current situation in human capital development in these two countries.
Copyright © 2013 JAEBR
Keywords: Competitiveness, Uzbekistan, developing economies, human capital, econometric
1. Introduction
Global Competitiveness Index (GCI) is estimated by the experts of World Economic Forum. This measure provides information on overall competitiveness of the particular country in human capital, markets, macroeconomic environment and institutions compared to other countries of the world. Mainly, the GCI consists of 12 pillars that are calculated based on statistical data obtained from internationally recognized agencies, notably by the United Nations Educational, Scientific and Cultural Organization (UNESCO), the IMF, and the World Health Organization (WHO). Then, the findings for the majority of countries are published in the Global Competitiveness Report. For example, the most recent report, published in 2012, contains information on GCIs for 139 countries. Surprisingly, the report
doesn’t provide GCIs for several developing countries such as Belarus, Cuba, Uzbekistan,
Cambodia and others. To fill this gap in the report, we provide methodology of estimating one of the components (pillar) of the GCI, health and primary education (HPE) pillar for not included in the report countries, using information on the GCI and country specific information of all the countries included in the report. Specifically, we compute the HPE pillar for two countries of the former Soviet Union, Uzbekistan and Belarus and then compare the computed indices to the indices of other countries to understand the current situation in human capital development in these two countries.
1
It should be noted that the competitiveness index in human capital is an important tool in evaluation of the overall economic stability of the country. The positive impact of human capital on productivity, poverty and health has been demonstrated by many studies in the literature (Becker, 1964; Mincer, 1974; Becker and Lewis, 1973; Psacharopolus, 1994; Belamy, 1999). For example, several studies supported by World Bank have demonstrated that an additional year of primary education increases labor productivity by 10-30% (Psacharopolus, 1994). Another research using data on thirteen low income countries shows that postsecondary education increases farm production by eight percent. In addition, a 10%
increase in girls’ enrollment in primary education leads to a substantial decrease in infant
mortality (4.1 deaths per 1000) (Belamy, 1999). Finally, the high enrollment in primary education is one of the most effective ways to reduce poverty in developing countries (Psacharopolus, 1994). Thus, having a better understanding on relative development of human capital in the developing countries enables policymakers to make timely policy interventions to address unmet needs of the general population.
2. Human development in Uzbekistan: A country snapshot
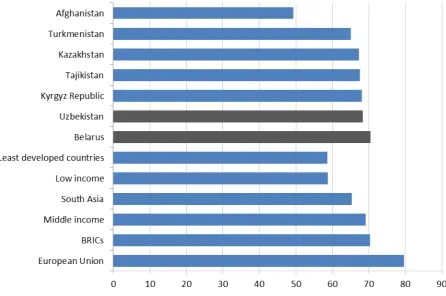
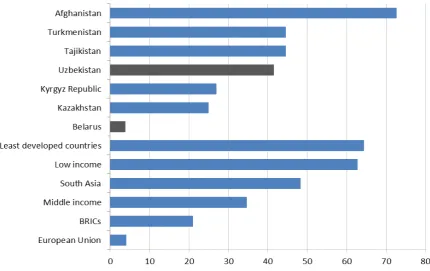
[image:3.595.82.525.526.686.2]Uzbekistan is a double landlocked country located in the Central Asian region. The country has acquired its independence with the collapse of Soviet Union in 1991. The area of the country is approximately 447 thousand square kilometers, which makes it 57th largest in the world. In 2012 Uzbekistan recorded 8.3% economic growth rate compared to 2.7% global average. Life expectancy at birth in the country reached 68.4 years2 exceeding South Asia. Middle income countries and currently is the highest in the Central Asian region (see figure 1). With the population more than 29 million people compared to 12 million in 1970 it is the most inhabited in the Central Asia. The high population growth rates that were observed in the 1970s have fallen more than three times by 2000. However, they picked up an upward trend since then. Significant change in population growth rates can be mainly explained with declining birth and fertility rates from 1980 to 2000, as well as economic instability in the country. The decrease of population growth had impact on the demographic structure. The share of population aged 0-14 declined from 45% in 1970 to 29% in 2010 while the share of population aged 65+ has been increasing since 1990 (see table 1). Human development has been one of the key priorities of the socio-economic policy of Uzbekistan. In the framework of this health care and education have observed significant changes since 1991.
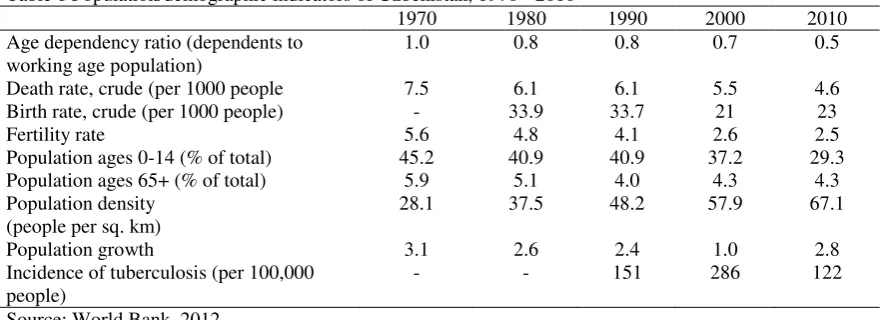
Table 1 Population/demographic indicators of Uzbekistan, 1970 - 2010
1970 1980 1990 2000 2010 Age dependency ratio (dependents to
working age population)
1.0 0.8 0.8 0.7 0.5
Death rate, crude (per 1000 people 7.5 6.1 6.1 5.5 4.6 Birth rate, crude (per 1000 people) - 33.9 33.7 21 23
Fertility rate 5.6 4.8 4.1 2.6 2.5
Population ages 0-14 (% of total) 45.2 40.9 40.9 37.2 29.3 Population ages 65+ (% of total) 5.9 5.1 4.0 4.3 4.3 Population density
(people per sq. km)
28.1 37.5 48.2 57.9 67.1
Population growth 3.1 2.6 2.4 1.0 2.8
Incidence of tuberculosis (per 100,000 people)
- - 151 286 122
Source: World Bank, 2012
2
Figure 1 Life expectancy at birth, total (years) Source: World Bank, 2012 or latest
2.1 Health care reforms
Reforms in the health care system of Uzbekistan are conducted in phases, with the high importance of this sector on social and economic life. They were aimed to eliminate the flaws of Semashko model in order to satisfy the population needs. Semashko, highly centralized health system, sacrificed the health care quality in favor of high number of medical stuff and hospital beds. The reforms in health care system were mainly initiated to increase efficiency of government funding, support decentralization of the health care system and encourage the development of private sector. Declined dependency of health care units from capital city and rational use of assets allowed government to establish a health care that was able to meet the
Uzbek nation needs. The beginning of the reforms is associated with the “Law on Health Protection” (1996) and the “Presidential Decree on the reform of the health care system”
(1998). Later, two important projects were implemented in the framework of the reforms.
The first project “Health 1” (1998–2005; formerly known as “Health”) was carried out by
Uzbek Government and the World Bank. As a result of the project in the piloted regions a number of new approached and infrastructural facilities were introduced in the area of rural health care. The new mechanisms for the most part featured general practice clinical practices and a per capita funding system for rural primary care clinics.
The success of the “Health 1” entailed the follow up projects “Health 2” and “Women and Child Health Development”. These projects were joint collaboration of Uzbek
government and a number of international institutions aimed to transform rural health reforms from piloted regions to the countrywide level and set the foundation of the health care reforms in the cities.
care, specialized surgery centers, cardiology, urology and eye microsurgery centers were established. The substantial progress has been achieved in the area of emergency services. While emergency facilities are equipped with the latest technological achievements the delivery of emergency service remains free of charge. Increasing access and quality of emergency care both in rural and urban areas have gradually lowered the death rates (see table 1).
2.2 Education reforms
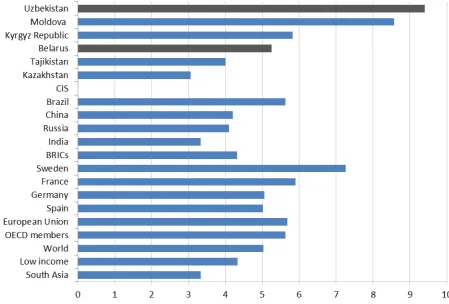
Education is considered and important tool to fight poverty and eliminate gender inequality, raise labor productivity and competitiveness of economy. One of the striking examples of Uzbek education system is the government expenditure that reached 9.5% as a share of GDP in 2011 (see figure 2) (more than annual average of OECD, BRICs and South Asia). Despite the collapse of centralized soviet system the country continues to offer quality education to its people. Uzbek education system is one of the few reformed in the post-soviet area. The education sector prior to independence was completely different that Uzbekistan faced the challenge establishing anew to address a wide spectrum of issues on policy, planning and administration of education (ADB, 2006). In comparison to many Commonwealth of Independent States (CIS) countries, Uzbekistan have gone further by abating Soviet degree system and introducing new two level system (Bachelors and Masters degrees) based on the premier examples of developed countries. The government developed a number of programs in education system. One of them National Program for Personnel Training (NPPT) adopted in 1997. NPPT announced the following improvements to existing education system:
protraction of senior secondary education (SSE) from 2 to 3 years;
reorganization of the agencies responsible for education services Ministry of Public Education (MOPE) and the Ministry of Higher and Secondary Specialized Education (MOHSSE);
increasing wages in the education system
decentralization of the education institutions aimed to promote higher standards of public governance and efficient use of financial resources
updating the curriculum, materials and learning techniques in accordance with the latest trends in the global education
Consisting of three stages it was completed in 2010. Another significant project in the primary education was the National Program for School Education Development (2004 - 2009). The purpose of the project was to improve the quality of public schools in accordance with the international standards. Primary and secondary education was protracted from 11 to 12 years by 2009. Additionally the project aimed to decrease the gap between urban and rural schools.
Figure 2 Public spending on education, total (% of GDP)
Source: World Banks 2012 or latest; CIA Factbook
3. Human development in Belarus: A country snapshot
Located in the heart of Europe, with the population of 10 million people Belarus occupies the area of 208 thousand sq. kilometers. As other former Soviet states Belarus’s economic growth model is associated with a state-led role and significant income
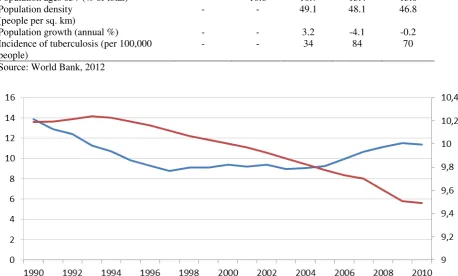
redistribution. In the early 1990’s Belarus has suffered from economic collapse and marked fall in output. Declining production, high inflation rates alongside with deterioration of health care and education system had negative impact on population growth (see table 2). The population of Belarus has decreased from 10.2 million in 1990 to 9.4 million in 2010; following a substantial decline in the birth rate since the independence of the country (see figure 3). Yet life expectancy at birth is above in comparison to majority of the CIS countries and equal to the average of BRICs, at 70.5 years (2012) (see figure 1) with mortality rate at a moderate level compared to the same countries (see figure 4). The main reasons of premature mortality (age below 65) in the country are diseases of the circulatory system (223), external causes (162), cancer (84), suicide (28) and car accidents (14.6) per 100 000) (WHO Regional
Table 2 Population/demographic indicators of Belarus, 1970 - 2010
1970 1980 1990 2000 2010 Age dependency ratio (dependents to
working age population)
- 0.5 0.5 0.4 0.4
Death rate, crude (per 1000 people - 9.6 10.7 13.5 14.5 Birth rate, crude (per 1000 people) - 16.3 13.9 9.4 11.4
Fertility rate 2.4 2 1.9 1.3 1.4
Population ages 0-14 (% of total) - 22.7 23.0 18.6 15.0 Population ages 65+ (% of total) - 10.6 10.7 13.4 13.6 Population density
(people per sq. km)
- - 49.1 48.1 46.8
Population growth (annual %) - - 3.2 -4.1 -0.2 Incidence of tuberculosis (per 100,000
people)
- - 34 84 70
Source: World Bank, 2012
Figure 3 Population, total in millions (right scale); Birth rate crude per 1000 (left scale) Source: World Bank, 2012
Sustainable economic development of Belarus cannot be accomplished without enhancing the socio-demographic indicators. According the United Nations Report with the GDP per capita at 5800$ Belarus was ranked 61st by the human development index in 2010.
Such progress can’t be achieved without properly functioning health care and education
system (Tozik, 2011).
[image:7.595.87.546.162.438.2]Figure 4 Mortality rate, infant (per 1,000 live births) Source: World Bank, 2011
According to the Deputy Prime Minister of the Republic of Belarus A. Tozik “Today the understanding of the great importance of highly educated people in the modern society is as high as ever. The vast majority of Belarusians see decent education as a prerequisite for ensuring high living standards for themselves and their children. Therefore the government has been implementing a set of measures fostering up-to-date, efficient education system meeting the demands of the global innovation society and accessible to everyone”.
The education system of the country could be described as inheriting national as well as soviet school traditions with the fresh flow of latest global education trend. These guarantee equal access, continuity of education process and government support. Currently there are 450,000 people working in 10 thousand educational institutions. In order to keep human development in line with the pace of economic growth education reform has been set out and funding increased more than 1.5 times in the last few years reaching 5.1% of GDP (2010).
Currently national education system is facing a number of challenges:
low level of integration into European education system. The integration into global network would adjust the content of system and increase the recognition of Belarusian diplomas.
increase competition of educational institutions, which should foster the quality and unleash potential of Belarusians born after independence
narrow the gap between prominent western institutions and keep up with the pace of emerging South Asian education system.
4. Methodology and Data
The construction of any index is based on two components: the set of observed characteristics and weights assigned to the corresponding set of characteristics. For example, the index value of the health and primary education pillar of the GCI can be given as follows
M m m m i X HPE 1 (1)If the complete set of variables included inXmis known, then the computation of
m
based on observed indices of countries and corresponding values of Xm is quite trivial. Specifically, by utilizing any linear programming solver, one can directly compute values for each element ofm and then compute the value of the index for any country for which it has
not been provided by international organizations. However, in many situations, a subset of characteristics given inXm is not completely observed or known to researchers. Some
elements ofXm, which do not have substantial contribution toHPE relative to the observed elements are not fully discernible. In this case, the relationship between the index and corresponding two components can be decomposed into two parts: the part with observed characteristics,Xkand unobserved characteristics,Xl.
i K k k k L l l l K k k k
i X X X
HPE
1 1 1
(2)
Assuming that the unobserved characteristics used in computation of HPEi are
uncorrelated with the observed characteristics and assuming that the vector of Xk includes
the set of observed characteristics that explains most variation in HPEi, then by applying the
OLS method to expression (2) one would be able to receive the consistent estimates for each element of vectork.
Finally, variance of icould be a function of some characteristics that are directly
known to researchers. For example, the variance of i may substantially fluctuate with the
measure of economic development of the country such as GDP per capita and life expectancy. A statistical issue related to non-constant variance in the regression analysis leads to inefficient point estimates. One of the ways of obtaining heteroscedactisity-consistent a standard error is to appropriately transform both HPEi and Xk with the variables leading to
the non-constant variance ofi. This transformation procedure is also known in the literature
Finally, to increase the reliability of the computed index using the econometric modeling technique discussed in this paper, the level of uncertainty around the predicted value of HPEi should be computed using the conventional bootstrapping technique. Specifically, each element of kmust be perturbed by a random draw from multivariate normal distribution centered at zero with covariance matrix equal to the estimated covariance matrix for the entire set of parameters of equation (2) and the human capital competitiveness index should be recomputed withT iterations.
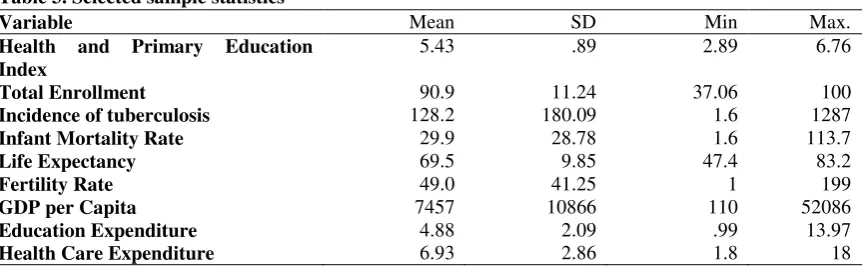
[image:10.595.86.518.335.468.2]For the purpose of exposition, in this paper, we estimate theHPEi index for two countries, Uzbekistan and Belarus, for which this index has not been computed by World Economic Forum. To do this, we use data pulled from the World Bank,WDI 2011 and World Economic Forum. In particular, in The Global Competitiveness Report 2011-2012, we obtain the major observed characteristics included in computation of the index such as the total enrollment in primary education, the incidence of tuberculosis, the infant mortality rate, the average life expectancy, fertility rate and a total expenditure on education and health care. The data on the human capital competitiveness index for each country is obtained from the World Competitiveness Report. Table 3 presents selected sample statistics on key variables used in our analyses.
Table 3. Selected sample statistics
Variable Mean SD Min Max.
Health and Primary Education Index
5.43 .89 2.89 6.76
Total Enrollment 90.9 11.24 37.06 100 Incidence of tuberculosis 128.2 180.09 1.6 1287 Infant Mortality Rate 29.9 28.78 1.6 113.7
Life Expectancy 69.5 9.85 47.4 83.2
Fertility Rate 49.0 41.25 1 199
GDP per Capita 7457 10866 110 52086
Education Expenditure 4.88 2.09 .99 13.97 Health Care Expenditure 6.93 2.86 1.8 18 Source: World Bank, WDI 2011 and WEF
5. Empirical results
The adjusted R squared statistic of the regression analysis using the weighted-least squares method is equal to 92% (see table 4). This implies that the set of observed characteristics included in Xkexplains the substantial variation inHPE for available countries. Results also indicate on negative associations between the fertility rate, infant mortality rate, incidence of tuberculosis and the measure of human capital, which confirm findings of other studies in the literature (Becker, Murphy, and Tamura, 1990). Furthermore, positive relationships between total enrollment in primary education, life expectancy and
HPEare consistent with common beliefs that the substantial school enrollment and life expectancy leads to the superior human capital development (Lorentzen, McMillan and Wacziarg, 2008).
Table 4 Results of Human Capital Competitiveness Index (WLS regression)
Variable Coefficient Std. error t-Statistic Prob.
Total Enrollment 0.020 0.0038 5.23 0.000
Incidence of tuberculosis -0.00066 0.0002 -3.57 0.001 Infant mortality rate -0.0097 0.003 -3.10 0.003 Human capital expenditure 0.00102 0.0031 0.16 0.870
Life expectancy 0.0313 0.0094 3.33 0.001
Fertility rate -0.0036 0.0011 -3.27 0.002
Constant 1.842 0.9288 1.98 0.051
Adjusted R-squared = .94, Number of observations = 87
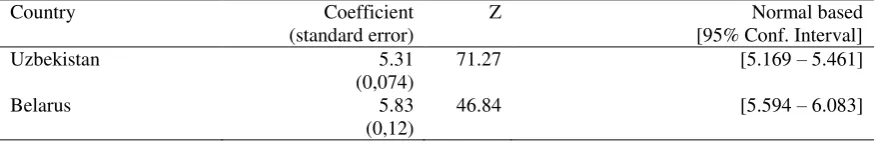
Table 5 Results from bootstrapping
Country Coefficient
(standard error)
Z Normal based
[95% Conf. Interval]
Uzbekistan 5.31
(0,074)
71.27 [5.169 – 5.461]
Belarus 5.83
(0,12)
[image:11.595.80.520.212.284.2]Table 6 Rank of imputed values for the health and primary education index (2011-2012)
RANK COUNTRY INDEX
1 Finland 6.76
2 Belgium 6.75
3 Singapore 6.65
4 New Zealand 6.61
5 Iceland 6.59
6 Canada 6.58
7 Netherlands 6.54
8 Switzerland 6.53
9 Japan 6.52
10 Australia 6.51
11 Ireland 6.49
12 United Kingdom 6.42
13 Korea, Rep, 6.38
14 France 6.37
15 Barbados 6.35
16 Sweden 6.35
17 Austria 6.32
18 Italy 6.28
19 Norway 6.28
20 Qatar 6.28
21 Germany 6.27
22 Estonia 6.26
23 Slovenia 6.26
24 Luxembourg 6.26
25 Hong Kong 6.25
26 Denmark 6.24
27 Malta 6.22
28 Bahrain 6.17
29 Brunei Darussalam 6.17
30 China 6.16
31 Malaysia 6.14
32 Lebanon 6.12
33 Portugal 6.12
34 Israel 6.11
35 Greece 6.09
36 Tunisia 6.09
37 Costa Rica 6.08
38 Poland 6.06
39 UAE 6.06
40 United States 6.05
41 Slovak Republic 6.04
42 Spain 6.04
43 Sri Lanka 6.00
44 Lithuania 5.99
45 Uruguay 5.98
46 Croatia 5.96
47 Latvia 5.94
48 Czech Republic 5.91
49 Iran 5.91
50 Belarus 5.83
51 Serbia 5.82
52 Belize 5.81
53 Hungary 5.81
54 Mauritius 5.81
55 Argentina 5.8
56 Bulgaria 5.8
57 Bosnia & Her 5.79
58 Montenegro 5.79
59 Trinidad & Tobago 5.79 60 Saudi Arabia 5.78
61 Syria 5.77
62 Puerto Rico 5.76
63 Indonesia 5.74
64 Albania 5.73
65 Romania 5.72
66 Georgia 5.7
67 Russian Federation 5.7
68 Mexico 5.69
69 Chile 5.68
70 Ecuador 5.68
71 Jordan 5.67
72 Vietnam 5.66
73 Ukraine 5.64
74 Guyana 5.62
75 Turkey 5.62
76 Kuwait 5.6
77 Colombia 5.58
78 Panama 5.55
79 Macedonia, FYR 5.53
80 Oman 5.52
81 Algeria 5.5
82 Thailand 5.49
83 Venezuela, RB 5.48
84 Kazakhstan 5.46
85 Moldova 5.46
86 Brazil 5.45
87 Suriname 5.44
88 Honduras 5.43
90 Tajikistan 5.39
91 Morocco 5.38
92 Philippines 5.38
93 Armenia 5.37
94 Cape Verde 5.36
95 Egypt, Arab Rep, 5.36
96 Peru 5.36
97 Mongolia 5.35
98 Uzbekistan 5.32
99 Nicaragua 5.3
100 Guatemala 5.28
101 India 5.25
102 Madagascar 5.24
103 Bolivia 5.2
104 Kyrgyz Republic 5.15 105 Azerbaijan 5.12
106 Jamaica 5.11
107 Paraguay 5.1
108 Bangladesh 5.01
109 Dominica 5.00
110 Benin 4.89
111 Cambodia 4.86
112 Rwanda 4.78
113 Tanzania 4.67
114 Namibia 4.64
115 Nepal 4.64
116 Cameroon 4.54
117 Ethiopia 4.5
118 Botswana 4.46
119 Kenya 4.46
120 Senegal 4.46
121 Pakistan 4.36
122 Uganda 4.33
123 Ghana 4.29
124 Zimbabwe 4.29
125 Gambia, The 4.21
126 Burundi 4.2
127 Yemen, Rep, 4.15
128 Malawi 4.13
129 Mauritania 4.03
130 Zambia 3.97
131 South Africa 3.96 132 Mozambique 3.81 133 Timor-Leste 3.81
134 Swaziland 3.6
135 Lesotho 3.53
136 Mali 3.44
137 Burkina Faso 3.4 138 Cote d'Ivoire 3.35
139 Haiti 3.32
140 Nigeria 3.28
141 Chad 2.96
Source: The Global Competitiveness Report
6. Conclusion
The purpose of this study is to provide methodology of computing the index of the health and primary education pillar of the GCI for developing countries for which the index has not been provided by international organizations. For the purpose of exposition, we use our method to compute the indices for the two countries of the former Soviet Union and compare them with the indices of other countries. Using the proposed method, we find that Belarus and Uzbekistan are ranked 47th and 94th, respectively, in human capital development. Moreover, the empirical strategy enables us to understand main determinants of the human capital competitiveness index. As is expected, increases in life expectancy and total enrollment in primary education make human capital more competitive, whereas increases in the incidence of tuberculosis, infant mortality rate have detrimental impacts on human capital development.
The estimated scores can be used by policymakers of Uzbekistan and Belarus to elaborate a set of policies aimed to promote competitiveness of human capital relative to other countries. For example, Uzbekistan can improve its rank by improving its current situation in life expectancy, fertility, incidence of tuberculosis, and infant mortality. However, to reach the targeted levels, the government should implement a number of public policies aimed to increase the quality of life, enrollment in post-secondary education, and use of preventive care by women.
References
ADB. 2006. Country Strategy and Program: Uzbekistan, 2006–2010. Manila 9, 13.
Becker G. S. 1964. (1993, 3rd ed.). Human Capital: A Theoretical and Empirical Analysis,
with Special Reference to Education. Chicago, University of Chicago Press
Becker G. S., Lewis G. 1973. On the Interaction between the Quantity and Quality of Children. The Journal of Political Economy 81, 279-288
Becker G.S, Murphy K.M, Tamura R. 1990. Human Capital, Fertility, and Economic Growth.
Journal of Political Economy 98, 5
Belamy C, 1999. The State of the World's Children 1999: Education. UNICEF. Available at http://www.unicef.org/sowc99/
Efron B., Tibshirani R. J. 1993. An Introduction to the Bootstrap. Mathematical Reviews (MathSciNet) Chapman and Hall, New York.
Hoffmann, J. 2010. Linear Regression Analysis: Applications and Assumptions, Second Edition (2010). Stata version. Unpublished;
Lorentzen, P., McMillan, J., Wacziarg, R. 2008. Death and development, Journal of Economic Growth 13:2, 81-124
Schwab, K., Sala-i-Martin, X., 2012. The Global Competitiveness Report 2011-2012, World Economic Forum. Available at http://www.weforum.org/reports/global-competitiveness-report-2011-2012