Abstract— Cross-species studies using microarray gene expressions help discover genetic diversity among different species, the results of which are fundamental to comparative genomics. Various approaches have been used for cross-species studies, such as homogeneity test and cluster analysis. A homogeneity test provides a homogeneity significance ranking for each gene pair whilst cluster analysis looks at the discovery of co-expressed meta-genes. We propose a unified method to extract both homogeneous and heterogeneous expression patterns across species. The basic idea is to model the sum and difference of expressions across species using multi-scale Gaussians which reveal information about homogeneous and heterogeneous expression patterns respectively. We show using both simulated and real data that the proposed method is suited to identifying both homogeneous and heterogeneous gene expression patterns.
I. INTRODUCTION
ROSS-species study compares multiple data sets from biological/medical experiments for revealing how genes are conserved among distantly related species [1]. For instance, it is assumed that the primary structure of an orthologous gene will be conserved when species evolve even if their evolutionary distance is large [2]. Biological investigation in one species on conserved genes can therefore be tested in another species if two species are related. For instance, clinic trials for disease intervention are conducted on mice prior to being tested on human and there have been many human-mice species comparison studies [3-7]. However, gene expression levels vary significantly across species due to sample variation, technique resolution, posing a challenging issue in cross-species studies [1, 2, 8-10].
Two types of quantitative analytical approaches are typically used for cross-species analysis. The first approach tests homogeneity gene expressions across species. For example, the homogeneity test based on correlation was used to determine the genetic components of alcohol consumption between human and rats [11]. Those genes with large correlation coefficients across the two species were classified as homogeneous genes. In extension to correlation analysis which captures only second order and linear information, some studies looked at higher order statistics such as mutual information to detect early stress responses in rodent models
ZiHua Ynag is with University of Queen Mary, UK (e-mail: [email protected]). Abdullatif Alwatban is with University of Exeter (e-mail: asa220@ex. colostate.edu). Richard Everson is with University of Exeter (e-mail: [email protected]). Zheng Rong Yang is with University of Exeter (e-mail: [email protected]).
of lung injury across species [12]. Evolutionary conservation is a complex implementation of correlation analysis for cross-species analysis [13-15]. Both correlation analysis and mutual information rely on large sample sizes. When examining homogeneity across more than two species, the Fisher combined probability test [16] is used when the species number is sufficiently large. It combines p values derived from significance analysis carried out separately in each species to deliver a combined p value of the dependence across species [17-19]. The Fisher combined probability test is unreliable when some p values are extremely small [20].
The second approach uses multivariate analysis such as unsupervised and supervised learning algorithms for cross-species studies. Supervised learning algorithms are used to examine whether a pattern reserved in one species can be a predictive factor for the other species. The algorithms used for supervised cross-species analysis include artificial neural network [21], linear discriminant analysis [22] and k-nearest neighbors [22]. For instance, artificial neural network algorithm was used for identifying conserved and divergent transcriptional modules across species [23], linear discriminant analysis was used for lung injury biomarker detection across multiple species [24], k-nearest neighbor algorithm was used for probe sequence identification [25]. Because phenotypic data are not always available or difficult to acquire, unsupervised learning algorithms are often used in real applications. Nonnegative matrix factorization [26, 27] is such an unsupervised learning algorithm and has been used to analyze common meta-genes across two species [28-30]. Using nonnegative matrix factorization (NMF), a gene expression matrix is decomposed in to a meta-gene expression matrix and a coefficient matrix of individual gene contributions to the meta-genes. Mathematically the expression level of a gene is a linear combination of the expression levels of all meta-genes. Based on the magnitude of coefficients, one can quantify the relationship of each gene to a meta-gene, giving a partition or cluster of the data. Common meta-genes can then be identified across species by inspecting separate NMF models. Cluster analysis as another set of important unsupervised learning algorithms for partitioning data. Each cluster corresponds to a meta-gene. Clustering algorithms including k-means algorithm, mixture models and self-organizing map [31] have been used for cross-species study [32-35]. When clustering gene expression data for cross-species analysis, data can be separately or jointly analyzed. However in cross-species studies it models gene expression matrices of two species separately and
Multi-Scale Gaussian Mixtures for Cross-species
Study
ZiHua Yang, Abdullatif Alwatban, Richard Everson and Zheng Rong Yang
requires a post analysis to compare two species. In addition, the determination of the number of meta-genes is based on a priori knowledge. In case such knowledge is unavailable, it is then difficult to accurately identify meta-genes.
Cluster analysis partitions data explicitly. During cluster analysis, each data point is assigned to a cluster and a cluster represents a meta-gene. When using cluster analysis for cross-species, one can model a gene expression matrix for each species separately [36-38] or model a combined gene expression matrix from multiple species [2, 32, 39]. Separate clustering suits any data size because each species is modelled individually to generate a cluster model through an unsupervised learning process. After individual cluster models have been generated, follow-up-manual work extracts co-expressed patterns across species. Combining expression matrices across species into one matrix, on the other hand, can avoid the difficulty of manual work [39]. Using combined expression matrix for cross-species analysis, gene expression matrices are normalized separately and then are merged into one matrix for using cluster analysis. Using this approach, we do not need a follow-up-manual comparison. Clusters of genes from multiple species directly show the co-expression of genes across species. However this approach has a stringent requirement of data pairing, i.e. all the expression matrices must have the same number of samples. Moreover, when the number of species becomes large, the number of samples is likely to be larger than the number of genes, i.e. the number of variables is larger than the number of instances in the context of machine learning. In this case, cluster analysis model can be unreliable.
A major distinction between the two quantitative approaches is the focus on co-expressed genes versus the focus on co-expressed meta-genes. A homogeneity test can detect exactly which subset of genes is co-expressed across species and measure the significance of co-expressions for gene ranking. Cluster analysis does not produce statistics of significance but summarises information based on meta-genes. One critical issue for cluster analysis is that cluster structures are often badly estimated when data noise is large. For instance, two overlapped clusters can easily be merged into one. When a cluster structure (or multiple cluster structures using separate clustering approach) is wrongly estimated, true homogeneous co-expressed genes can hardly be accurately predicted.
We introduce a new method using the multi-scale Gaussian (MSG) model for probabilistic cross-species analysis. We use MSG to model the sum and difference of DEs across two species. We use simulated and real data to illustrate the successful detection of both homogeneous and heterogeneous differential expression patterns (DEPs) using the proposed method.
II. METHODS AND MATERIALS A. Multi-scale Gaussian
The multi-scale Gaussian model is a mixture model [40-42], composed of two components which have similar or identical centres but different variances. We denote a vector
by Z{zn}nN1. We assume that Z follows a mixture of two Gaussians, one with a small variance which is referred to as the null density while the other with a large variance referred to as the alternative density. A standard multi-scale Gaussian density function f(z|) given model parameters
) , , , , ,
(0 102 12 w0 w1
has the form:
) , | ( ) , | ( ) |
(z w0 z 0 02 w1 z 112
f G G
where
2
2 1 2
2 exp ( )
2 1 ) |
( 2
m m
m
m, z
z m
G
which is centred at
m with standard deviation m (m = 0, 1);w
m is the mixing coefficient or weight satisfying1 1
0w
w ; 0 is the standard deviation of the null density, 0
1
is the standard deviation of the alternative density. This model is also called a two-component hierarchical normal mixture model. In this model, G(z|0,02) models the uninformative part of the data (null data -little variation from zero) and G(z|1,12) models the informative part (alternative data - large deviation from zero). A small
0 naturally leads to a sharp peak centred at
0. However the density modelled by G(z|1,12) can extend infinitely to two tails when 10, G(z|1,12) is approximates a uniform distribution and the identification of null data is straightforward. The likelihood function is defined as
Nn n
z f Z
P
1
) | ( ) |
(
We place (conjugate) inverse gamma distributed priors on the variances:
) exp(
) ( )
, |
( 2
) 1 ( 2
2
m m
m a m a m m m
m b
a b b a
IG m m
The mixing coefficients are modelled using non-informative priors and we assign each of 0 and 1 a Gaussian prior with zero mean and small deviations m:
m~G(0,
m2).Moreover |z|0 indicates null data. Such a mixture can learn G(z|0,02) for data with a property of |z|0. Therefore |0|0 should be true if sufficient data have
1 0 1 0 1 1 1 1 1 1 1 0 0 0 ) , 0 ( ) exp( ) ( )} | ( ) | ( { ) | ) | ( ) , | ( m mm m m m
a m a m N
n n n
b a b , z w , z w P( Z P Z P m m G G G
where (a0 ,a1 ,b0 ,b1 ,0 ,1) is the hyper-parameter set. The log-posterior can be written as:
N
n n m m
B f Z P 1 1 0 log ) | ( log ) , | (
log z
Here 2 5 . 0 log ) 1
( m m m m m m
m a b
B
and mm2 . The model parameters are estimated by maximising the posterior, giving the iterative variance updates
2 2 2 , 2 , 2
m m n m n m n m a b z where
n,m is defined as:) ( ) , | ( 2 , n m m n m m n z f z w
G
The iterative update rule for the mixing coefficients can be written as: wm(1/N)
nN1n,m and the iterative update rule for each center is:m m n m m m n m n m m z
, 0 ,where m00. The learning process is initiated by assigning 0.5 to wm, 1 to m, and 0 to m We set m00 to reflect our observation that the null data are distributed around zero. Setting wm0.5 assumes that there are roughly an equal number of alternative and null data initially when there is no a priori knowledge. We also set m1 and m0 initially. For both Gaussians, the variance hyper-parameters a0 and
1
a were set to one.
b0 was set to be the standard deviation of 90% of the smallest absolute data as we assume that the majority of data correspond to those of null genes. b1 was the 90th percentile of all data. Bayesian learning has desirable
convergence properties [43, 44]. The convergence of multi-scale Gaussians is usually determined by the maximum learning cycle and parameter stability. After convergence is achieved, the null density and the alternative density are estimated for each gene. The Bayes rule is then used to determine whether a data is alternative.
B. Using multi-scale Gaussian mixture
To use multi-scale Gaussian to model differential expressions (DEs) for a microarray expression data, we denote a DE matrix by X {xn}nN1d. It has N rows of genes or probe sets. We use the biological significance [45, 46] of the expression data and denote it by ZE(X).
C. Cross-species differential expression pattern discovery We aimed to discover two kinds of cross-species differential expression patterns (DEPs). The first refers to the subset of genes with similar DE direction as well as magnitude across species - homogeneous DEP. The second refers to a subset of genes with opposite DE directions across species - heterogeneous DEP. Homogeneous DEPs inform how two species demonstrate similar response to stress whilst heterogeneous DEPs infer species diversity.
We denoted two DE matrices by N dx
n n
X {x } 1 and y
d N n n
Y{y } 1 . Both matrices have N rows of genes or probe sets. From X and Y, we denoted a co-differential expression vector by ZE(X)E(Y), where ( ,) has two operations for the two kinds of DEPs. Here the sum function + was used for revealing homogeneous DEP (DEP0) across species and the difference function was used to explore heterogeneous DEP (DEP1) across species.
D. Experimental design
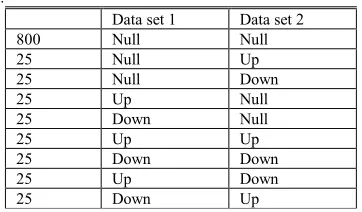
You Simulated data were designed to evaluate the method in identifying DEP0s and DEP1s. We simulated 1000 genes across two species, each with ten control and ten test samples. The control samples and the test samples of non-DEGs were random samples of a normal distribution of mean ten and a varying standard deviation. The standard deviation values were 0.1, 0.2, 0.3, 0.4, 0.5, 0.6, 0.7, 0.8, 0.9 and 1. The test samples of DEGs were random samples of a normal distribution with mean ten, plus (minus) one unit for up (down) regulated genes. Table 1 shows how these 1,000 genes were distributed in two data sets.
We used two measurements to evaluate algorithms for the simulated data, i.e. sensitivity and false discovery proportion. The sensitivity was derived as follows for different algorithms. The Fisher test and correlation analysis return vectors of p values for the genes. Suppose the design vector is denoted as t. The sensitivity was calculated using
) 1 ( /# ) & 1 (
# t pp0 t , where p0 is the critical p value and
#(
x
)
means of the number of x. The false discoveryproportion was calculated using
) ( /# ) & 0 (
[image:3.612.345.526.466.572.2]# t pp0 pp0 . The largest sensitivity approaches one meaning that the p values for all the designed dependent/independent (homogeneous/heterogeneous) genes
Table 1. Experimental design of simulated data with combinations of non-DEGs (Null), up-regulated DEG (UP) and down-regulated DEG (Down).
Data set 1 Data set 2 800 Null Null 25 Null Up 25 Null Down
25 Up Null
25 Down Null
25 Up Up
25 Down Down
25 Up Down
approach zero. The smallest sensitivity will approach zero. The smallest false discovery proportion is zero if none of the designed non-dependent/independent genes has its p value less than a critical p value. MSG returns a vector of the posterior probabilities (P) for the designed dependent/independent genes. Therefore the sensitivity was calculated using #(t1&PP0)/#(t1), where
P
0 is the critical posterior probability. The false discovery proportion was calculated using #(t0&PP0)/#(PP0).A clustering approach will return two vectors of cluster memberships for genes. We therefore used different measurement techniques for calculating the sensitivity and false discovery proportion. Moreover, the separate clustering approach returns two separate models, we therefore used correlation to pair clusters from two models. We scanned the clusters of one model for one data set one by one and found one cluster from the other model with maximised correlation which is larger than a pre-defined threshold. We denoted the membership vectors as fA and fB. For one cluster (say k),
} {fA k
k
A
and Bk {fBk} denote genes from two data sets A and B. For the sum function, a commonality proportion for the cluster was calculated as
) (
/#
# Ak
Bk Ak
Bkk
. For the difference function, a uniqueness proportion for the cluster was calculated as
) (
/# ) (
\ ) (
# Ak
Bk Ak
Bk kA
Bkk
. k was then
assigned to all genes belonging to the cluster. We denoted
each gene’s sensitivity as si. The overall sensitivity was calculated as
1) 1 (# 1
i
t i i
s t
and the false discovery proportion was calculated as
0) 0 (
# 1
i
t i i
s s
We set the critical p value to be 0.01 and the critical posterior probability to be 0.95. We downloaded a data set from the Gene Expression Omnibus (GEO, accession number GSE44337). The data set originated from a study on conserved gene differentiation in aggressive B lymphomas across human species (human diffuse large B cell) and mouse species (B6 iMyc).The human species expression data was generated using the GPL570 platform with 54,675 probe sets. It is composed of three samples of the wide type and nine tumour samples. The mouse species was generated using the GPL1261 platform with 45,101 probe sets. It is composed of three wide type samples and seven tumour samples. As both data sets have unmatched sample number between wide type and tumour, we used a one-to-one sample pairing approach, i.e., each wide type sample is paired with a tumour sample to generate a DE. Because different data sets in a cross-species study may use different platforms, we match probe sets to gene symbols. For gene symbols with more than one probe set, we selected the probe set with the maximum variance.
III. RESULTS
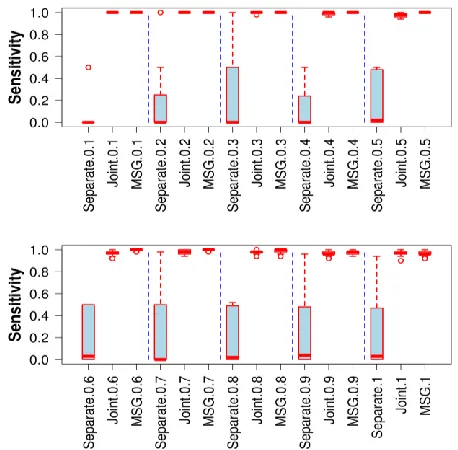
Simulation with DEP0. Fig. 1 shows the sensitivity evaluation of three approaches, separate clustering, joint clustering and MSG for identifying ten simulated DEP0 with varying noise levels. The Fisher test and correlation failed to provide meaningful results. It can be seen that the joint clustering approach and MSG were similar in performance while the separate clustering approach was very unreliable. Fig. 2 illustrates the false discovery proportions for these simulations. We can see that MSG achieved the lowest false discovery proportion among three approaches.
[image:4.612.322.551.207.432.2] [image:4.612.323.541.465.699.2]Simulation with DEP0. Fig. 3 shows the sensitivity Fig. 1. The sensitivity measures for detecting DEP0.
measures for detecting DEP1. It can be seen that only MSG worked well. Both the separate clustering approach and the joint clustering approach failed to predict independent DEGs. Fig. 4 shows the false discovery proportion. MSG's false discovery proportion is at 60% similar to that shown in detecting DEP0. However the false discovery proportion measures for the separate clustering approach and the joint clustering approach were nearly one meaning all the predicted independent DEGs were false ones.
Real data. We extracted 27 DEs for each gene in the human data set and 21 DEs for the mouse data set. After probe set - gene symbol mapping, we have selected 13,992 probe sets for
the cross-species study. Using a 0.95 as the critical posterior probability, we identified 546 homogeneous DEGs and 309 heterogeneous DEGs. Fig. 5 shows the top ten homogeneous DEGs, where six genes show homogeneous up-regulation in both species and the rest show homogeneous down-regulation in both species. We then mapped these top ten genes to Gene Ontology Biological Processes and have found that 74 are identical among 87 biological processes for the human species and 74 mice biological processes for the mice species. This shows that the biological processes are well conserved for these homogeneous DEGs.
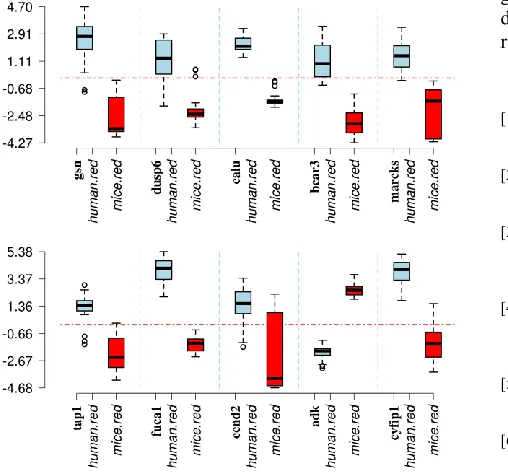
Fig. 6 shows the top ten heterogeneous DEGs. When mapping these top ten genes to Gene ontology biological processes, we have found that 68 are identical among 73 biological processes for the human species and 77 mice biological processes for the mice species.
[image:5.612.64.281.165.401.2]Table 2 summarizes the top ten homogeneous and heterogeneous DEGs across the human and mice species. Among them, several have been both tested in human and mice. For instance, TOMM5 has been tested in human and mice tissue for examining the histopathology value and used mice as the baseline assay for high-throughput phenotyping [47]. CALU has been examined in human tissue for using IRF5 as a tumour suppressor in splenic marginal-zone lymphoma [48]. BCAR3 has been studied in relation with B lymphoma in both mice and human tissue [49]. ANXA6 was studied in human tissue for lymphoma [50]. STMN1 has been studied in human tissue for its anti-cancer activity [51]. Fig. 4. The false discovery proportion measures for detecting DEP1.
[image:5.612.322.556.262.501.2]Fig. 3. The sensitivity measures for detecting DEP1.
[image:5.612.65.285.430.672.2]IV. CONCLUSION
We have presented a new method for exploring homogeneous and heterogeneous DEPs across species using multi-scale Gaussian mixtures. The algorithm is motivated by the limitations in using existing homogeneity tests and cluster analysis techniques for cross-species analysis. The former suffers from low sensitivity and the latter is often severely affected by data noise. Density function is able to model two types of data with little difficulty. They are non-differentiable (hence informative modelled by a Gaussian density with a small variance) and differentiable (hence uninformative modelled by a Gaussian with a large variance) between two species. We introduced the sum/difference functions of DEs for homogeneous and heterogeneous DEP discovery. With these functions, co-expressed genes across species can be detected using the sum function while heterogeneous DEGs can be detected using the difference function. The method is simple to implement but can be extended to deal with more
general problem settings in future work. We use simulated data and real data to illustrate the efficacy of this method in revealing both homogeneous and heterogeneous DEPs.
REFERENCES
[1] E. Kristiansson, Osterlund, T, Gunnarsson, L, Arne, G, Joakim, Larsson, DG, Nerman, O, "A novel method for cross-species gene expression analysis," BMC Bioinformatics, vol. 14, p. 70, 2013. [2] X. Zheng-Bradley, Rung, J, Parkinson, H, Brazma, A, "Large
scale comparison of global gene expression patterns in human and mouse," Genome Biol, vol. 11, p. r124, 2010.
[3] U. Ala, Piro, RM, Grassi, E, Damasco, C, Silengo, L, Oti, M, Provero, P, Di Cunto, F, "Prediction of human disease genes by human-mouse conserved coexpression analysis," PLoS Comput Biol, vol. 4, p. e1000043, 2009.
[4] A. Sweet-Cordero, Mukherjee, S, You, ASH, Roix, JJ, Ladd-Acosta, C, Mesirov, J, Golub, TR, Jacks, T, "An oncogenic KRAS2 expression signature identified by cross-species gene-expression analysis," Nat Genet, vol. 37, pp. 48-55, 2005. [5] J. Miller, Horvath, S, Geschwind, DH, "Divergence of human and
mouse brain transcriptome highlights Alzheimer disease pathways," PNAS, vol. 107, pp. 220-229, 2010.
[6] A. Rasche, Al-Hasani, H, Herwig, R, "Meta-analysis approach identifies candidate genes and associated molecular networks for type-2 Diabetes mellitus," BMC Genomics, vol. 9, p. 310, 2008. [7] E. Segal, Friedman. N, Kaminski, N, Regev, A, Koller, D, "From
signatures to models: understanding cancer using microarrays,"
Nat Genet, vol. 37, pp. S38-45, 2005.
[8] D. Allison, Cui, X, Page, GP, Sabripour, M, "Microarray data analysis: from disarray to consolidation and consensus," Nat Rev Genet, vol. 14, pp. 55-6, 2006.
[9] M. Consortium, "The microarray quality control (MAQC) project shows inter- and intraplatform reproducibility of gene expression measurements," Nat Biotechnol, vol. 14, pp. 1151-61, 2006. [10] W. Kuo, Liu, F, Trimarchi, J, Punzo, C, Lombardi, M, Sarang, J,
Whipple, ME, Maysuria, M, Serikawa, K, Lee, SY, McCrann, D, Kang, J, Shearstone, JR, Burke, J, Park, DJ, Wang, X, Rector, TL, Ricciardi-Castagnoli, P, Perrin, S, Choi, S, Bumgarner, R, Kim, JH, III, GFS, Freeman, MW, Seed, B, Jensen, R, Church, GM, Hovig, E, Cepko, CL, Park, P, Ohno-Machado, L, Jenssen, TK, "A sequence-oriented comparison of gene expression measurements across different hybridization-based technologies," Nat Biotechnol, vol. 14, pp. 832-40, 2006. [11] B. Tabakoff, Saba, L, Printz, M, Flodman, P, Hodgkinson, C,
Goldman, D, Koob, G, Richardson, HN, Kechris, K, Bell, RL, Hübner, N, Heinig, M, Pravenec, M, Mangion, J, Legault, L, Dongier, M, Conigrave, KM, Whitfield, JB, Saunders, J, Grant, B, Hoffman, PL, "Genetical genomic determinants of alcohol consumption in rats and humans," BMC Biol, vol. 7, p. 70, 2009. [12] S. Ma, Grigoryev, DN, Taylor, AD, Nonas, S, Sammani, S, Ye, SQ, Garcia, JG, "Bioinformatic identification of novel early stress response genes in rodent models of lung injury," Am J Physiol Lung Cell Mol Physiol, vol. 289, pp. L468-77, 2005.
[13] B. Liao, Zhang, JZ, "Evolutionary conservation of expression profiles between human and mouse orthologous genes," Mol Biol Evol, vol. 23, pp. 530-40, 2006.
[14] B. Dutilh, Huynen, MA, Snel, B, "A global definition of expression context is conserved between orthologs, but does not correlate with sequence conservation," BMC Genomics, vol. 7, p. 10, 2006.
[15] K. Essien, Hannenhalli, S, Stoeckert, CJ, "Computational analysis of constraints on noncoding regions, coding regions and gene expression in relation to Plasmodium phenotypic diversity,"
PLoS One, vol. 3, p. e3122, 2008.
[16] R. Fisher, "Answer to question 14 on combining independent tests of significance," Amer Statistician, vol. 2, p. 30, 1948. [17] P. Hu, Greenwood, CMT, Beyene, J, "Statistical methods for
meta-analysis of microarray data: a comparative study," Inf Syst Front, vol. 8, pp. 9-20, 2006.
[image:6.612.63.317.63.300.2][18] A. Campain, Yang, YH, "Comparison study of microarray Fig. 6. Expressions of the top ten heterogeneous genes across mice (blue)
and human (red). The boxes in light blue (red) represent the 27 DEs for each gene in the human species. The boxes in red represent 21 DEs for each gene in the mouse species. The horizontal lines in red represent the cutoffs for gene significance.
Table 2. Top ten homogeneous and heterogeneous differentially co-expressed genes. FC means Fold Change.
Homogeneous Heterogeneous Symbol FChuman FCmice Symbol FChuman FCmice
meta-analysis methods," BMC Bioinformatics, vol. 3, p. 408, 2010.
[19] G. Tseng, Ghosh, D, Feingold, E, "Comprehensive literature review and statistical considerations for microarray meta-analysis," Nucleic Acids Res, vol. 40, pp. 3785-99, 2012. [20] W. Rice, "A consensus combined P-value test and the
family-wide signi_cance of component tests," Biometrics, vol. 46 pp. 303-8, 1990.
[21] D. E. Rumelhart, McClelland, J.L, Parallel Dsitributed Processing. Cambridge, MA, USA: MIT press, 1986.
[22] R. O. Duda, Hart, P.E., Stork, D.G., Pattern Classification, 2nd ed.: Wiley-Interscience, 2000.
[23] H. Li, Zhan, M, "Identifying Conserved and Divergent Transcriptional Modules by Cross-species Matrix Decomposition on Microarray Data," J Proteomics Bioinform, vol. 2, p. 117, 2009.
[24] P. Hu, Wang, X, Haitsma, JJ, Furmli, S, Masoom, H, Liu, M, Imai, Y, Slutsky, AS, Beyene, J, Greenwood, CM, dos Santos, C, "Microarray meta-analysis identifies acute lung injury biomarkers in donor lungs that predict development of primary graft failure in recipients," PLoS One, vol. 7, p. e45506, 2012. [25] T. Royce, Rozowsky, JS, Gerstein, MB, "Toward a universal
microarray: prediction of gene expression through nearest-neighbor probe sequence identification," Nucleic Acids Res, vol. 35, p. e99, 2007.
[26] D. D. Lee, Seung, H.S., "Learning the parts of objects by non-negative matrix factorization," Nature, vol. 401, pp. 788-91, 1999.
[27] D. D. Lee, Seung, H.S., "Algorithms for non-negative matrix factorization," Adv Neural Info Proc Syst, vol. 13, pp. 556–62, 2001.
[28] P. Tamayo, Scanfeld, D., Ebert, B.L., Gillette, M.A., Roberts, C.W., Mesirov, J.P., "Metagene projection for cross-platform, cross-species characterization of global transcriptional states,"
PNAS, vol. 104, pp. 5959-64, 2007.
[29] J. M. e. a. Stuart, "A gene-coexpression network for global discovery of conserved genetic modules," Science, vol. 302, pp. 249-255, 2003.
[30] J. P. Brunet, Tamayo, P., Golub, T.R., Mesirov, J.P., "Metagenes and molecular pattern discovery using matrix factorization,"
PNAS, vol. 101, pp. 4164-9, 2004.
[31] T. Kohonen, Self-Organizing Maps. Berlin: Springer, 2001. [32] J. Cai, Xie, D, Fan, Z, Chipperfield, H, Marden, J, Wong, WH,
Zhong, S, "Modeling co-expression across species for complex traits: insights to the difference of human and mouse embryonic stem cells," PLoS Comput Biol, vol. 6, p. e1000707, 2010. [33] Z. Mi, Shen, K., Song, N., Cheng, C., Song, C., Kaminski, N.,
Tseng, G.C., "Module-based prediction approach for robust inter-study predictions in microarray data," Bioinformatics, vol. 26, pp. 2586-93, 2010.
[34] Y. Lu, He, X, Zhong, S, "Cross-species microarray analysis with the OSCAR system suggests an INSR->Pax6->NQO1 neuro-protective pathway in aging and Alzheimer's disease,"
Nucleic Acids Res, vol. 35, pp. W105-14, 2007.
[35] Y. Lu, Huggins, P., Bar-Joseph, Z., "Cross species analysis of microarray expression data," Bioinformatics, vol. 25, pp. 1476-83, 2009.
[36] M. Schlicht, Matysiak, B, Brodzeller, T, Wen, X, Liu, H, Zhou, G, Dhir, R, Hessner, MJ, Tonellato, P, Suckow, M, Pollard, M, Datta, MW, "Cross-species global and subset gene expression profiling identifies genes involved in prostate cancer response to selenium," BMC Genomics, vol. 5, p. 58, 2004.
[37] Y. Lu, He, X., Zhong, S., "Cross-species microarray analysis with the OSCAR system suggests an INSR->Pax6->NQO1 neuro-protective pathway in aging and Alzheimer's disease," NAR,
vol. 35, pp. W105–14, 2007.
[38] Y. Lu, Yi, Y, Liu, P, Wen, W, James, M, Wang, D, You, M, "Common human cancer genes discovered by integrated gene-expression analysis," PLoS One, vol. 2, p. e1149, 2007. [39] W. Huang, Cao, X, Zhong, S, "Network-based comparison of
temporal gene expression patterns," Bioinformatics, vol. 26, pp. 2944-51, 2010.
[40] P. Kramer, Kurbanmuradov, O, Sabelfeld, K, "Comparative analysis of multiscale Gaussian random field simulation algorithms," Journal of Computational Physics, vol. 226, pp. 897-24, 2007.
[41] E. Bertschinger, "Multiscale Gaussian random fields and their application to cosmological simulations," The Astrophysical Journal, vol. 137, pp. 1-20, 2001.
[42] S. Billings, Wei, H, Balikhin, MA, "Generalised multiscale radial basis function networks," Neural Networks, vol. 20, pp. 1081-94, 2007.
[43] C. M. Bishop, Pattern Recognition and Machine Learning: Springer, 2006.
[44] A. Webb, Statistical Pattern Recognition. Chichester: John Wiley & Sons Ltd, 2002.
[45] Y. Xiao, Hsiao, T.H., Suresh, U., Chen, H.I., Wu, X., Wolf, S.E., Chen, Y., "A Novel Significance Score for Gene Selection and Ranking," Bioinformatics, vol. in press, 2012.
[46] D. McCarthy, Smyth, GK, "Testing significance relative to a fold-change threshold is a TREAT," Bioinformatics, vol. 25, pp. 765–71, 2009.
[47] P. Vogel, Read, RW, Rehg, JE, Hansen, GM, "Cryptogenic organizing pneumonia in Tomm5(-/-) mice," Vet Pathol, vol. 50, pp. 65-75, 2013.
[48] V. Fresquet, Robles, EF, Parker, A, et al, "High-throughput sequencing analysis of the chromosome 7q32 deletion reveals IRF5 as a potential tumour suppressor in splenic marginal-zone lymphoma," Br J Haematol, vol. 158, pp. 712-26, 2012. [49] Y. Nakayama, Iwamoto, Y, Maher, SE, Tanaka, Y, Bothwell, AL,
"Altered gene expression upon BCR cross-linking in Burkitt's lymphoma B cell line," Biochem Biophys Res Commun, vol. 277, pp. 124-7, 2000.
[50] A. Turtoi, Sharan, RN, Srivastava, A, Schneeweiss, FH, "Proteomic and genomic modulations induced by γ-irradiation of human blood lymphocytes," Int J Radiat Biol, vol. 86, pp. 888-904, 2010.