Risk sensitivity indicator as correction
factor for cost of capital rate
Michalski, Grzegorz
Wroclaw University of Economics
19 August 2012
Online at
https://mpra.ub.uni-muenchen.de/43399/
Risk sensitivity indicator as correction factor for cost
of capital rate
1Mgr Grzegorz Michalski, PhD,
Wroclaw University of Economics,
[email protected]
Abstract
Cost of capital rate is a result of risk included in cost of debt rates and cost of equity rates.
Generally to estimate cost of capital rates with use of CAPM conception, is used information
about general risk indicator, known as beta coefficient and relations between debt and equity
rates. Such approach in unmodified version, falsely gives the similar results for enterprises
from the same sector and with similar levels of debt to equity relations. In paper is presented
risk sensitivity indicator conception which allows to differentiate cost of capital rate between
more risk sensitive businesses and less sensitive businesses.
Key words
risk sensitivity, cost of capital, enterprise value, sensitivity indicator
JEL Classification:
G32, G31, D241. The individual sensitivity on risk of the enterprise (ISRE, ϣ) indicator
Risky environment impacts of the enterprise readiness to generate added value for its owners. Level of the risk influence depends on the type of business and individual businesses flexibility and risk sensitivity. General rule is known and independent from various economic systems or factors, that higher promised profitability is usually connected with higher risk (Soltes 2004; Zmeskal, Dluhosova 2009; Soltes 2012, Polak 2012). While risk is defined in the paper as probability to have other results as forecasted, when we have to do with more sensitive on risk business, the changes in cost of capital rate are more dramatic with next portion of risk the business face. That idea is illustrated by figure 1.
Figure 1. Relation between risk level and cost of capital, including the sensitivity on risk idea.
1
Acknowledgment: Research project is financed from public sources for science and research for
years 2011-2014, by National Science Centre granted according decision nr
Source: own proposal
As shown at the figure 1, according to claims of the paper, theoretically is possible to face higher level of risk without the effect in cost of capital or with smaller effect in cost of capital rate than in cases.
One from the factors moderating the risk sensitivity is kind of the demand for the enterprise production. Some industries have the comfort of a stable demand for its production, but it is related to the volatility of realized free cash inflows. Paper use the conception of individual sensitivity on risk of the enterprise (ISRE, ϣ). That
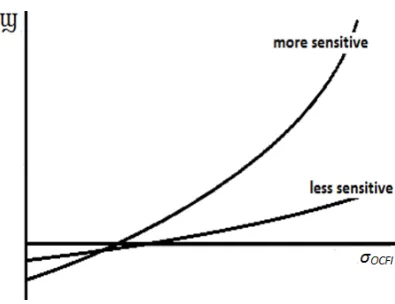
sensitiveness on risk is different and depends on factors present in enterprise business environment. Risk sensitiveness characterize the internal policy of the managing team preferences and beliefs about future position of the business. Individual sensitivity on risk of the enterprise (ISRE, ϣ) is higher for the enterprises with higher
[image:3.595.144.454.57.224.2]level of the operating cash inflows volatility (σOCFI) and smaller when that volatility is smaller.
Figure 2. Individual sensitivity on risk of the enterprise (ISRE, ϣ) as function of the operating cash inflows volatility (σOCFI).
Source: own proposal
Individual sensitivity on risk of the enterprise (ISRE, ϣ) is also an result of quality and value of total assets.
Higher level of total assets real value (TA) characterizes less sensitive enterprises, smaller level of total assets is generally typical for more sensitive enterprises.
[image:3.595.76.274.409.561.2]Source: own proposal
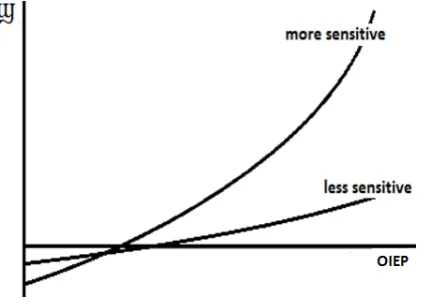
Next source of sensitiveness is originality and innovativeness of enterprise product and enterprise product market (OIEP). Individual sensitivity on risk of the enterprise (ISRE, ϣ) is higher when the enterprise issues high
[image:4.595.85.469.62.248.2]technologically or from other perspective more sophisticated products, and is smaller in opposite case.
Figure 4. Individual sensitivity on risk of the enterprise (ISRE, ϣ) as function of the innovativeness of enterprise product and enterprise product market (OIEP).
Source: own proposal
Similarly the growth of market absorption of enterprise products (MAEP) causes the individual sensitivity on risk of the enterprise (ISRE, ϣ) decrease.
Figure 5. Individual sensitivity on risk of the enterprise (ISRE, ϣ) as function of the innovativeness of market
absorption of enterprise products (MAEP).
[image:4.595.78.293.347.500.2]Sometimes is believed that bigger enterprises are less risky and smaller have higher risk level. In presented here approach, individual sensitivity on risk of the enterprise (ISRE, ϣ) is influenced by enterprise size (SIZE), but the size risk is not directly transferred on enterprise but is moderated through the individual sensitivity on risk of the enterprise (ISRE, ϣ). When the enterprise is greater, the smaller is the sensitivity and the smaller enterprise is
more sensitive.
Figure 6. Individual sensitivity on risk of the enterprise (ISRE, ϣ) as function of the enterprise size (SIZE).
Source: own proposal
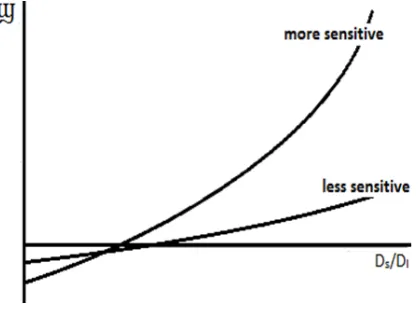
Next indicators influencing the enterprise sensitiveness, are linked with short-term financing policy (DS/DL) and
short-term investment policy (CA/CR). Individual sensitivity on risk of the enterprise (ISRE, ϣ) is higher in more
restrictive policies and smaller in more flexible policies in managing the enterprise financial cash and near cash liquid investments. Individual sensitivity on risk of the enterprise (ISRE, ϣ) is greater when the enterprise uses
[image:5.595.76.286.450.607.2]more aggressive policy and smaller when that policy is more conservative.
Figure 7. Individual sensitivity on risk of the enterprise (ISRE, ϣ) as function of the short-term financing policy (DS/DL).
Source: own proposal
Source: own proposal
Enterprise works in actual economic environment (ENV). More sensitive are enterprises operating in more unstable conditions. The hypothesis verified in the paper is presumption about relation of pressure of the general economic environment caused by instability different cycles in surrounding business environment and the financial liquidity policies realized by enterprises. The strength of that influence depends on business sensitiveness on risk. More risk sensitive businesses have higher operating cash inflows OCFI volatility, smaller total assets that average total assets in their sector, more innovative and original product or target group for its products or services, smaller than average market absorption, smaller size, and other parameters which cause higher risk sensitivity. Risk sensitivity depends on position of the enterprise in its business branch (PEBB). If the risk sensitivity should be higher, then more smart is to choose more flexible and more conservative solutions to have better results. It works in opposite direction also, the safe enterprise with strong, less sensitive positions can use more restrictive and more aggressive policies to have more enterprise value building results. So, finally individual sensitivity on risk of the enterprise (ISRE, ϣ), could be presented as function of mentioned above
indicators:
ϣ = f (CA/CR, DS/DL, SIZE, MAEP, TA, σOCFI , OIEP, ENV, PEBB, …) (1)
That indicator is used to calculate cost of capital rate:
CoC = f (krf, km, ϣ, β, kdL, kdS), (2)
Where: krf –risk free rate, km– average rate of return from average investment at the considered economy,ϣ -
individual sensitivity on risk of the enterprise (ISRE), β – raw risk coefficient including the systematic operational and systematic financial risk estimations, kdL–cost rate of long term debt, kdS –cost rate of short term
debt.
The way of including the information about the risk sensitivity could be based on CAPM based philosophy or at models using other approaches (Zmeskal, Dluhosova 2009; Dluhosova et.al. 2006). Here is used modified CAPM basing proposal.
2. FREE CASH FLOW GENERATION IN INDIVIDUAL SENSITIVITY OF RISK MODEL
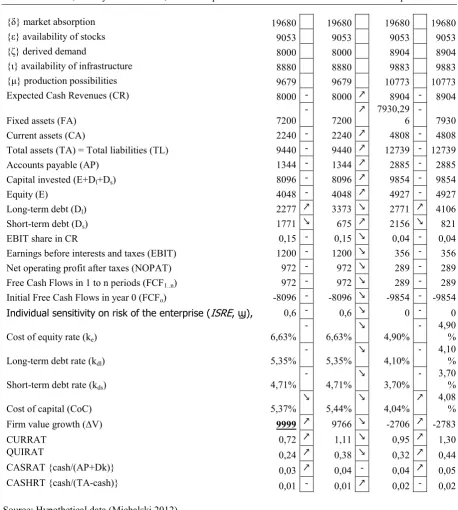
Table 1 and table 2 present the way of generating free cash flow in enterprise in the case of various policies in managing of liquidity levels. Table 2 contains the data for the most sensitive on risk enterprise and the result of it is the most effective choice with the most safe flexible and conservative managing of liquidity. Table 1 presents the same case for the most restrictive on risk enterprise. The case include adaptation of case from Michalski (2011).
Table 1. Free cash flow generation in the resistant on risk enterprise with small level of sensitivity on risk. The best restrictive-aggressive case.
Current assets investment and financing strategy Res-Agg Δ
Res-Con Δ
Fle-Agg
Δ Fle-Con
{δ} market absorption 19680 19680 19680 19680
{ε} availability of stocks 9053 9053 9053 9053
{ζ} derived demand 8000 8000 8904 8904
{ι} availability of infrastructure 8880 8880 9883 9883
{μ} production possibilities 9679 9679 10773 10773
Expected Cash Revenues (CR) 8000 - 8000 ↗ 8904 - 8904
Fixed assets (FA) 7200
- 7200 ↗ 7930,29 6 - 7930
Current assets (CA) 2240 - 2240 ↗ 4808 - 4808
Total assets (TA) = Total liabilities (TL) 9440 - 9440 ↗ 12739 - 12739
Accounts payable (AP) 1344 - 1344 ↗ 2885 - 2885
Capital invested (E+Dl+Ds) 8096 - 8096 ↗ 9854 - 9854
Equity (E) 4048 - 4048 ↗ 4927 - 4927
Long-term debt (Dl) 2277 ↗ 3373 ↘ 2771 ↗ 4106
Short-term debt (Ds) 1771 ↘ 675 ↗ 2156 ↘ 821
EBIT share in CR 0,15 - 0,15 ↘ 0,04 - 0,04
Earnings before interests and taxes (EBIT) 1200 - 1200 ↘ 356 - 356
Net operating profit after taxes (NOPAT) 972 - 972 ↘ 289 - 289
Free Cash Flows in 1 to n periods (FCF1..n) 972 - 972 ↘ 289 - 289
Initial Free Cash Flows in year 0 (FCFo) -8096 - -8096 ↘ -9854 - -9854 Individual sensitivity on risk of the enterprise (ISRE, ϣ), 0,6 - 0,6 ↘ 0 - 0
Cost of equity rate (ke) 6,63%
-
6,63%
↘
4,90%
- 4,90
%
Long-term debt rate (kdl) 5,35%
-
5,35%
↘
4,10%
- 4,10
%
Short-term debt rate (kds) 4,71%
-
4,71%
↘
3,70%
- 3,70
%
Cost of capital (CoC) 5,37%
↘ 5,44% ↘ 4,04% ↗ 4,08 %
Firm value growth (∆V) 9999 ↗ 9766 ↘ -2706 ↗ -2783
CURRAT 0,72 ↗ 1,11 ↘ 0,95 ↗ 1,30
QUIRAT 0,24 ↗ 0,38 ↘ 0,32 ↗ 0,44
CASRAT {cash/(AP+Dk)} 0,03 ↗ 0,04 - 0,04 ↗ 0,05
CASHRT {cash/(TA-cash)} 0,01 - 0,01 ↗ 0,02 - 0,02
[image:7.595.68.527.57.568.2]Source: Hypothetical data (Michalski 2012)
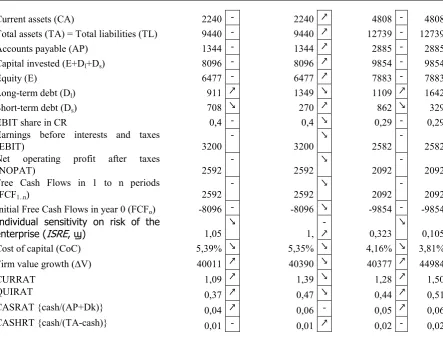
Table 2. Free cash flow generation in the sensitive on risk enterprise. The best flexible & conservative case.
Current assets investment and financing strategy
Restrictive & Aggressive
Δ Restrictive & Conservative
Δ
Flex&Aggr
Δ Flex&C ons
{γ} maximal outlets possibilities 9840 9840 9840 9840
{δ} market absorption 19680 19680 19680 19680
{ε} availability of stocks 9053 9052 9053 9053
{ζ} derived demand 8000 8000 8904 8904
{ι} availability of infrastructure 8880 8880 9883 9883
{μ} production possibilities 9679 9679 10773 10773
Expected Cash Revenues (CR) 8000 - 8000 ↗ 8904 - 8904
Current assets (CA) 2240 - 2240 ↗ 4808 - 4808 Total assets (TA) = Total liabilities (TL) 9440 - 9440 ↗ 12739 - 12739
Accounts payable (AP) 1344 - 1344 ↗ 2885 - 2885
Capital invested (E+Dl+Ds) 8096 - 8096 ↗ 9854 - 9854
Equity (E) 6477 - 6477 ↗ 7883 - 7883
Long-term debt (Dl) 911 ↗ 1349 ↘ 1109 ↗ 1642
Short-term debt (Ds) 708 ↘ 270 ↗ 862 ↘ 329
EBIT share in CR 0,4 - 0,4 ↘ 0,29 - 0,29
Earnings before interests and taxes
(EBIT) 3200
- 3200 ↘ 2582 - 2582 Net operating profit after taxes
(NOPAT) 2592
- 2592 ↘ 2092 - 2092 Free Cash Flows in 1 to n periods
(FCF1..n) 2592
- 2592 ↘ 2092 - 2092 Initial Free Cash Flows in year 0 (FCFo) -8096 - -8096 ↘ -9854 - -9854 Individual sensitivity on risk of the
enterprise (ISRE, ϣ) 1,05
↘ 1, -↗ 0,323 ↘ 0,105
Cost of capital (CoC) 5,39% ↘ 5,35% ↘ 4,16% ↘ 3,81%
Firm value growth (∆V) 40011 ↗ 40390 ↘ 40377 ↗ 44984
CURRAT 1,09 ↗ 1,39 ↘ 1,28 ↗ 1,50
QUIRAT 0,37 ↗ 0,47 ↘ 0,44 ↗ 0,51
CASRAT {cash/(AP+Dk)} 0,04 ↗ 0,06 - 0,05 ↗ 0,06
CASHRT {cash/(TA-cash)} 0,01 - 0,01 ↗ 0,02 - 0,02
Source: Hypothetical data (Michalski 2012)
3. CONCLUSIONS
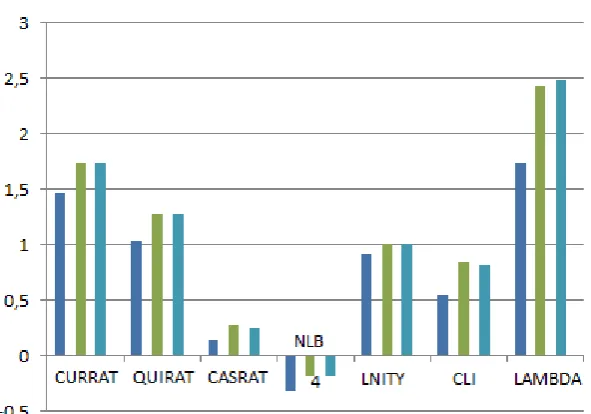
[image:8.595.79.523.61.406.2]Data used in the paper case study, confirms the model expectations. Presented in table 3 in comparison to results collected in next tables and presented in figure 9 levels of financial liquidity measures shows that presented in initial part of the paper, illustrated in example, and expected by our model relation probably exists.
Table 9. Liquidity indicators for Polish enterprises in 2008-2010.
- CURRAT QUIRAT CASRAT NLB LNITY CLI LAMBDA* 2008
(3611*) 1,47 1,04 0,14 -0,32 0,91 0,5
4 1,74
2009
(3470*) 1,74 1,28 0,27 -0,18 1
0,8
5 2,43
2010
(3530*) 1,74 1,28 0,25 -0,19 1
0,8
2 2,48
Where: CURRAT – current ratio, QUIRAT – quick ratio, CASRAT – cash ratio; NLB – net liquid balance to total assets; LNITY – static liquidity indicator (Nita 2011); CLI - comprehensive liquidity index; Lambda – modified lambda liquidity indicator (Lambda = (Liquidity static reserve + OCF) / (OCF at risk)), * - size of population.
Source: own calculations (Michalski 2011, MPB 2012).
Source: own calculations (Michalski 2011, MPB 2012).
[image:9.595.76.372.72.279.2]According to the model discussed in previous part of the paper, the liquidity strategies changes should be connected with general level of risk in Polish firms situation.
Table 10. Liquidity indicators for whole Polish economy in 2003-2010.
General (whole Polish economy) 200 3 200 4 200 5 200 6 200 7 200 8 200 9 201 0 CURRAT
(>30000*) 1,33 1,43 1,52 1,55 1,67 1,74 1,43 1,72 QUIRAT
(>30000*) 0,97 1,03 1,07 1,10 1,19 1,23 1,11 1,23 CASRAT
(>30000*) 0,17 0,20 0,22 0,23 0,29 0,31 0,30 0,32
[image:9.595.71.529.512.591.2]Where: CURRAT – current ratio, QUIRAT – quick ratio, CASRAT – cash ratio, * - size of population. Source: own calculations (Dudycz 2012, Michalski 2011, MPB 2012).
Table 11. Dynamics of liquidity indicators in Polish enterprisesin 2003-2010.
General (whole Polish economy) 2003-2004 2004-2005 2005-2006 2006-2007 2007-2008 2008-2009 2009-2010
CURRAT 7,52% 6,29% 1,97% 7,74% 4,19% -17,82% 20,28%
QUIRAT 6,19% 3,88% 2,80% 8,18% 3,36% -9,76% 10,81%
CASHRAT 17,65% 10% 4,55% 26,09% 6,90% -3,23% 6,67%
Source: own calculations (Dudycz 2012, Michalski 2011, MPB 2012).
The empirical data from Polish enterprises for 2003-2010 years suggests that for Polish enterprises managing teams risk sensitivity grows and it is illustrated by growing liquidity indicators, what is linked with model suggestion about greater risk sensitivity influence on more flexible and more conservative solutions.
Depending on the business type that the given enterprise is doing, sensibility to current assets financing method risk might vary a lot. Character of business also determines the best strategy that should be chosen whether it will be the conservative strategy (situation closer to the first variant) or aggressive one (situation closer to the first variant) or maybe some of the transitional variants similar to the Compromise strategy. The best choice is that with the adequate cost of financing and highest enterprise value growth. This depends on the structure of financing costs.
the presented financial liquidity investment efficiency model assumptions. Future studies should concern at searching new cases testing the model usefulness and identifying the constraints of that model explanations if that exists.