Abstract—Ethernet Passive Optical Networks (EPONs)
systems are progressively used by the network operators around the world to offer diverse services. Regarding subscriber density, a single state-of-the-art EPON Optical Line Terminal (OLT) can support between 2000 and 30,000 customers. Hence a practical and cost-effective survivability and maintenance mechanism is becoming the key issue to the continued development of viable EPON solutions, since a single link outage may affect many customers, causing substantial loss of revenue for the network operator and customers as well. Therefore, in this paper, we propose post-fault restoration mechanism architecture to encounter the multiple link faults in the drop distribution fiber (DDF), since most of the link faults are occurred in the DDF(s). In the proposed mechanism, the ONUs are grouped into the Restoration Groups (RGs), where each ONU is interconnected to one another by the ring topology. Once fault is occurred, the affected ONU uses the ring for sending its data to the adjacent ONU. Finally, we also proposed the Quality-of-Service (QoS) intra-scheduling and fault Dynamic Bandwidth Allocation (FDBA) which tries to satisfy the affected ONU by sending the higher-priority traffic first and giving extra bandwidth to the adjacent node of the affected node. Simulation results show that our proposed mechanism can maintain the customers QoS and system performances in terms of EF packet delay, EF queue length, packet loss and system throughputs for multiple link faults.
Index Terms—EPON, Post-Fault, DDF, Fault DBA, QoS,
System performances.
I. INTRODUCTION
assive Optical Network (PON) is regarded as one of the future technology in the first/last mile deployments. PON based Fiber-to-the-Home (FTTH) systems become attractive reality while commercial deployments are reported worldwide [1,2,3]. It is reported that by 2015, fiber-based PON will penetrate the households up to 30 percent and even can be up to 50 percent in 2020 [4]. FTTH is one of the network technologies, which have been known as the best solution to provide diverse triple-play services to the home or business with high-speed Internet access. PON not only offers huge capacity, small attenuation loss, low operational expenditures, longevity and future-proofness, but also
Manuscript received January 03, 2014; revised January 15, 2014.
Andrew Tanny Liem (email:[email protected]) is with Department of Computer Science and Engineering, Yuan-Ze University, Chung-Li, 32003, Taiwan.
I-Shyan Hwang (e-mail:[email protected]) is with Department of Information Communication, Yuan-Ze University, Chung-Li, 32003, Taiwan.
AliAkbar Nikoukar (email:[email protected]) is with Department of Computer Science and Engineering, Yuan-Ze University, Chung-Li, 32003, Taiwan.
provides the lowest energy-consuming solution for broadband access network.
Among PON systems, Ethernet Passive Optical Networks (EPONs) is considered as one of the best solutions for the access networks due to its simplicity, high data rate, and low-cost. EPON is one of the several PON architectures that commonly chosen by the network operators. EPON can deliver future ultra-high speed services far more efficiently than the other current architectures for years to come. Moreover, the capacity of EPON could be increased significantly, advancing the data rate to 10Gbps, allowing the network operators to share the same infrastructure for 64 subscribers or more. In 2009, the IEEE 802.3av standard for 10G-EPON is released with multi-data rates capability. It is projected that this next-generation 10Gbit EPON could be one of the most capable TDM-PONs to support diverse hungry multimedia services [3]. In fact, according to studies in [5], EPON bandwidth resource is increasing faster enough to cope with the bandwidth demand of subscribers. Moreover, EPON platform density is now not only focusing on the FTTH, spanning many other platforms as well, such as FTTB(uilding), FTTN(in combination with various copper-based technologies to cover the last 200–500m to subscribers) and FTTB(usiness) [6]. Currently, Japan, China and Korea are developing large-scale EPON deployments, which are built by several network operators [7]. At the end of 2011, Japan already had 21 million subscribers, followed by Korea and China, respectively. As for 2012, EPON networks had passed more than 60 million households, and more than 20 million broadband subscribers are served by EPON [7]. In conjunction with customer intensiveness, a single modern EPON Optical Line Terminal (OLT) can serve up to 30,000 customers, depending on the how many line cards, port intensiveness/card, data rate speed/port and the number of customers on a single ONU [6].
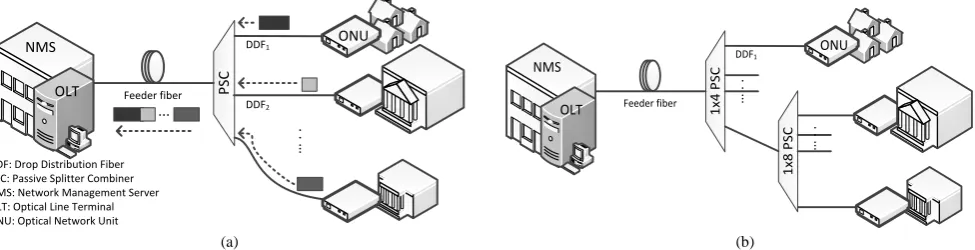
Figure 1 shows the general architecture of the EPON, where the OLT is located in the central office (CO), and is connected via the passive splitter combiner (PSC) to the multiple Optical Network Units (ONUs)/Optical Network Terminals (ONTs). The PSC is located in the remote node (RN), allowing a single point of feeder fiber to be shared for many subscribers. In the downstream direction, when the signal is arriving at the PSC, it splits the signal by power division to each drop distribution fiber (DDF). In contrast, in the upstream direction, the OLT has the entire channel bandwidth to broadcast the control messages and data packets to each ONU since the directional properties of the splitter or coupler is used. Moreover, the entire ONUs must share the common transmission channel towards the OLT, and only a
Multiple Link Faults Restoration Mechanism in
An Enhanced EPON Architecture
Andrew Tanny Liem, I-Shyan Hwang and AliAkbar Nikoukar
single ONU may upload upstream data in its transmission timeslot to avoid data collisions. Therefore, the IEEE 802.3ah standard has developed a Multipoint Control Protocol (MPCP), thus each ONU transmits within a dedicated timeslot and the OLT receives a continuous stream of collision-free packets from each ONU [3]. Additionally, an EPON also can be designed with a single optical PSC or more, which is called cascaded architecture as shown in Fig. 1(b).
MPCP is merely a supporting protocol that facilitates the implementation of various bandwidth allocation algorithms in EPON. The MPCP relies on two Ethernet control messages, GATE and REPORT, to allocate bandwidth to each ONU. The GATE message is used by the OLT to allocate the upstream transmission window to each ONU, and the REPORT message is used by ONUs to report its local queue-length to the OLT. An ONU can support up to eight priority queues as defined in 802.1q [8]. After receiving all the report messages based on the queue state information from entire ONUs, the OLT executes a Dynamic Bandwidth Allocation (DBA) to calculate and allocate the timeslots to each ONU. The DBA plays a key role to provide more efficient bandwidth allocation for each ONU to share network resources and offer the better Quality of Services (QoS) for the end users. Moreover, it can be observed that the operational expenditure (OpEx) of EPON can be categorized low because it does not have any active components between the OLT and ONU, which is more tended to failure. Hence, the network operator does not need for providing, monitoring and maintaining any electrical power or batteries outside the plant.
Although EPON has many benefits as stated above, however, on the other hand, it leads to some challenges regardless of the high bandwidth and vast customers. Any fiber fault in any DDF(s), or in the feeder fiber will cause the network operators with experience high loss revenues and could frustrate the customers, since once the customers connected to such high-speed networks, they become accustomed to high Quality-of-Services (QoS) and depend on it [6]. This is worsening by the huge amount of information carried by the EPON systems in a time.
In general, when the fault occurs, the technicians should be dispatched to identify, locate and fix the failure. Never before, the labor, time and truck roll will be dramatically increased the OpEx and decreased the customers QoS [9]. It has been reported that 80% of the installed EPON failures occurred within the first/last mile, i.e., within the distribution/drop
segments of the network. Additionally, according to the cases reported to the Federal Communication Commission (FCC), more than one-third of service disruptions are due to fiber cable problems [6,9]. This kind of problem usually take longer time to resolve compared to the transmission equipment failure. Consequently, in this paper, we propose a post-fault restoration mechanism architecture, which tries to restore any link fault in the DDF. The ONU will be grouped to the Restoration Groups, in which each ONU in the same RG is interconnected to one another with a ring topology. In addition to this, the fault Dynamic Bandwidth Allocation (FDBA) also is proposed for allocating the bandwidth efficiently and fairly when faults are occurred. The term adjacent node and backup node will be used interchangeably in this paper.
The rest of this paper is organized as follows. Section II describes the proposed post-fault restoration mechanism architecture. The performance evaluation and analysis of the proposed mechanisms, together with the conclusion are described in the Section III and IV, respectively.
II. PROPOSED ARCHITECTURE
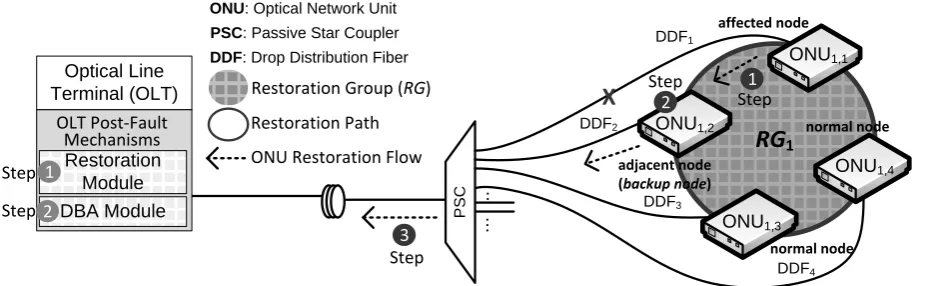
A. Post-Fault Restoration Mechanism at the OLT and ONU Figure 2 shows the proposed post-fault restoration mechanism architecture. As can be seen, we group the ONUs into several Restoration Groups (RGs), where each RG consists of four ONUs. The ONUs on the same RG are interconnected to one another by the ring topology. This ring is used only when the ONU does not receive any downstream signal from the OLT. Therefore, when fault is occurred at one DDF, this affected ONU will switch its transmission to the restoration transmission path (black line). In the normal condition i.e., no fault, in every cycle the OLT receives the REPORT message from the entire active ONUs in the system. To be noted, the REPORT message is used by the ONU to report its queue length, thus the OLT can calculate the Dynamic Bandwidth Allocation (DBA) based on each ONU queue length. In our proposed mechanism, when there is no any REPORT message from particular ONU(s) for two consecutive cycles, the restoration module in the OLT automatically generates an alarm, activating the DBA module and switching the normal DBA to the fault DBA (FDBA). It is worth mentioning that in this paper we assume that when the OLT does not receive any REPORT message from the ONU, it means that the DDF to that particular ONU is interrupted. This particular ONU is referred as the affected ONU/node.
P
SC
…
.
.
... Feeder fiber
DDF2 DDF1 NMS
OLT
DDF: Drop Distribution Fiber PSC: Passive Splitter Combiner NMS: Network Management Server OLT: Optical Line Terminal ONU: Optical Network Unit
ONU
1
x4
P
SC
Feeder fiber
DDF1 NMS
OLT
1
x8
P
SC … . .
…
.
.
ONU
[image:2.595.56.544.60.185.2](a) (b)
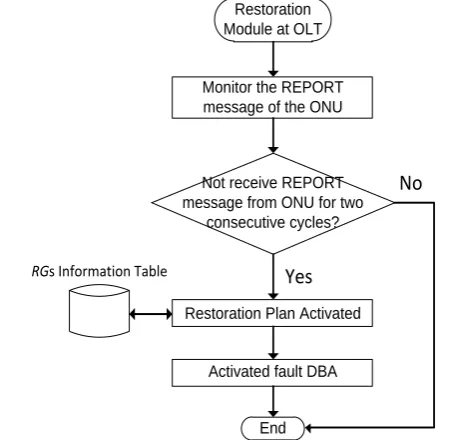
Afterward, since the OLT has the information about the Restoration Groups (RGs) of each ONU, hence the OLT knows which ONU is adjacent to the affected node (i.e., backup node). By knowing this information, the OLT later on will give extra timeslots to this backup node, since it needs to handle the traffic coming from the affected node. To be noted, the RGs information are kept in the OLT restoration module. It consists of the restoration plan for each ONU under the same RGs. Therefore, as already mentioned above, when fault is occurred in any DDF, the OLT knows which ONU is interconnected to the affected node. Hence during the DBA calculation, the OLT can grant extra timeslots to this adjacent node (backup node). Figure 3 summarizes the abovementioned operation in the flowchart diagram.
On the other hand, in the ONU side, we design a detection mechanism to detect the GATE message that coming from the OLT. Once there is no any GRANT message, the affected ONU will wait for some time T, where T is defined as the average waiting time for two consecutive cycles. If it still does not receive the GRANT message, the affected ONU switches the transmission path to the restoration path in the clockwise direction. It is worth mentioning that during this time; the affected ONU will act independently, transmitting its data to the backup node. The backup node can receive these data without any interference since each ONU is occupied with additional 1310nm receiver. To be noted that in the normal condition (no fault), the ONU receives the data only from the
downstream receiver. Figure 4 shows the post-fault operation at the affected ONU side.
[image:3.595.62.549.52.194.2] [image:3.595.311.548.233.474.2] [image:3.595.51.281.389.609.2]B. Intra-Scheduling at ONU and Fault Dynamic Bandwidth Allocation (DBA)
Figure 5 shows the flowchart principle of Quality-of-Service (QoS) intra-scheduling mechanism. When faults are occurred, the ONU puts the customers with higher SLA traffic to the high-priority traffic. It simply means that these particular customers, which belong to affected ONU will be served first. Moreover, the other scenario could be: When the fault occurs, the adjacent node of affected ONU treats the EF equally whether the traffic is coming from the affected ONU node (i.e., queue#3) or queue#0. The reason behind this is that according to the Federal Communications Commission (FCC), more than one-third of service disruptions are due to fiber-cable problems, and many of those disruptions have involved lifeline 911 services [9]. Therefore, it is important not to differentiate the priority of the queue#0 and queue#3. As for the other queues (i.e., queue#4 and queue#5) will be accepted if backup the node still has available buffer or there are some other higher-priority customers. As stated above, the QoS intra-scheduling will consider the priority of customers based on the agreement with the network operators, such as time elapse for restoring the path upon failure and QoS which specifies the percentage of traffic to be restored upon a failure.
ONU Restoration Module
Monitor the GRANT from the OLT
Not receive GRANT message from the OLT?
T > two consecutive cycles?
Switch the transmission path to the restoration path
Send data via restoration path
Send data via transmission path
End Yes
Yes
No
No
Figure 4. Post-fault Operation at the Affected ONU Side. Restoration
Module at OLT
Monitor the REPORT message of the ONU
Not receive REPORT message from ONU for two
consecutive cycles?
Yes
Restoration Plan Activated RGs Information Table
Activated fault DBA
End
No
Figure 3. Operation of Restoration Module at OLT.
RG
1Optical Line Terminal (OLT)
OLT Post-Fault Mechanisms Restoration
Module
DBA Module PS
C
...
DDF1
DDF2
DDF3
DDF4
ONU1,4 ONU1,1
ONU1,2
ONU1,3 ..
ONU: Optical Network Unit PSC: Passive Star Coupler DDF: Drop Distribution Fiber
Restoration Path Restoration Group (RG)
On the other hand, our proposed DBA scheme is divided to two schemes, which are normal DBA and fault DBA. These two DBAs will work alternately, which depend on the network condition. For instance, when there is no any fault occurs within the system, the normal DBA will be executed. However, when a fault is occurred, the OLT will activate the fault DBA, giving extra timeslots to the adjacent node of the affected node. Hence, although the adjacent node is also handling the affected node traffics, yet it can still guarantee the QoS, particularly for higher-priority traffic, such as Expedited Forwarding (EF) traffic. As already stated above, the OLT can automatically switch the DBA when the restoration plan is activated.
Figure 6 shows the flowchart of the proposed fault DBA. It is worth mentioning that in this paper, the limited DBA is used in the times where there is no fault in the system (normal DBA). The limited DBA will calculate the available
bandwidth and the maximum transmission time (i.e., Bmin) for each ONU. To be noted that in the limited DBA, the maximum transmission time of each ONU is limited to preventing channel monopolization by the heavy loaded ONU. On contrast, the fault DBA provides more transmission time to the adjacent node of the affected node. This extra transmission time is depending on how many affected nodes that the adjacent node needs to handle. We define M as the number of affected nodes, which being handled by the adjacent node. For instance, if the adjacent node is handled two affected nodes, then the OLT will GRANT two times transmission time (timeslots) to this particular adjacent node. By this way, it can reduce the packet drop and packet delay, particularly for higher-priority traffic, since this adjacent node has more timeslots for transmitting its queues.
C. Fault Restoration Operations
Figure 7 shows the example of the restoration mechanism upon link failure. For instance, when a fault is occurred at the ONU1,1 DDF, as already stated above, the ONU will activate the restoration module. Subsequently, the ONU1,1 switches the upstream transmission port from port A to port B (i.e., restoration path to ONU1,2) and ready to send its queues (Step 1-black). Furthermore, the extra receiver (i.e., 1310nm receiver) at the ONU1,2 (backup node) will receive the data streams from ONU1,1 (Step 2-black). The ONU1,2 places this data streams to separate queues (queue#3 for EF, queue#4 for AF and queue#5 for BE) and ready to send to the OLT via the upstream link of ONU1,2 (Step 2-black and 3-black). Notice that in the Step 2-black, the adjacent node will separate the queues based on the proposed intra-scheduling mechanism, which is already shown in Fig. 5. By this time, the network operator can send the technician directly to the faulty area to fix the fault without necessitating to go to the ONU1,1 premise. Meanwhile, since there is no REPORT message from ONU1,1 for two consecutive cycles (Step 1-grey), the restoration module also activates the fault DBA (Step 2-grey). This fault DBA gives extra timeslots to the ONU1,2 (backup node), since it should cover the data streams from affected node i.e., ONU1,1 too. Once ONU1,2 receives the timeslots, it will try to serve the higher-priority traffic first, such as, EF, AF and if there is still available timeslots, then the BE traffic is allowed to be sent.
The reason behind this is that, as already stated that it is possible that the fault might be interrupted the 911 call, which is categorized as the highest priority traffic. Consequently, our proposed intra-scheduling is always sending the highest priority traffic first, although sometimes it sacrifices the lower priority traffic such as, AF and BE.
III. PERFORMANCE EVALUATION
In this section, we analyze our proposed architecture Quality-of-Service (QoS) in terms of the mean EF packet delay and queue length, BE packet loss and system throughput. We model our system using OPNET simulator with 32 ONUs and an OLT. The downstream and upstream channel between OLT and ONU is set to 1Gbps. The distance from OLT to ONUs is uniform over the range from 10 to 20km, and each ONU has 10Mb buffer size. Moreover, we Calculate the
guarantee bandwidth (Bmin) for
each ONU Post-Fault DBA
Check if this ONU is the adjacent node of the
affected Node
Set Multicast LLID for the adjacent node and affected
node
End GRANT =
REPORT_queue[j]
Yes
Yes
No RG information
Table
Bmin = M*Bmin
If Bmin > REPORT_queue[j]?
GRANT = Bmin No
Figure 6. Flowchart of the Proposed fault DBA.
Change the highest priority sequence to
queue#0 and queue#3 QoS Intra-Scheduling
Faulty Condition?
Check if there are available buffers for placing
queue#4 and queue#5
Place the AF and BE from the Affected Node to queue#4
and queue#5
Drop the AF and BE from the Affected ONU
End Normal
intra-scheduling
Yes
Yes No
[image:4.595.56.279.50.574.2]No Based On SLA
use the self-similarity and long-range dependence as our network traffic model for AF and BE, respectively [10]. This model generates highly bursty AF and BE traffics with Hurst parameter of 0.7. The packet size is uniformly distributed between 64 to 1518 bytes. The high-priority traffic, i.e., Expedited Forwarding (EF) traffic (e.g., voice) is modeled using Poisson distribution with fixed packet size (70 bytes). We set the EF traffic packet inter-arrival to be 125s, which is around 14% of the total upstream bandwidth [11]. As for the Assured Forwarding (AF) and Best Effort (BE) upstream traffic profiles will occupy 40% and 60% of the remaining upstream bandwidth, respectively [12]. The simulation parameters are summarized in the Table I. To evaluate our proposed architecture, we considered two DBAs: 1) no fault referred as IPACT_Limit; and 2) two faults referred as FDBA_2Faults with different cycle times that is 1.5ms and 2ms.
Figure 8 illustrates the simulation results of our proposed fault DBA (FDBA) compared with Interleaved Polling with Adaptive Cycle Time (IPACT) no fault with different cycle times scenarios. It is worth mentioning that the IPACT limited (IPACT_Limit) [13] is the most common algorithm that has been implemented in the OLT, therefore, in the no fault scenario, we used IPACT as its DBA algorithm.
Figure 8(a) shows the overall EF packet delay from the operator point of view upon multiple link faults (in this case 2 faults). It can be observed that our proposed FDBA has higher EF packet delay compared with the IPACT_Limit when the traffic load is increased in the multiple link faults (in this case two faults). The first reason behind this result is that when faults are occurred, the adjacent nodes (backup nodes) of these two affected nodes need to handle these two affected node traffics, particularly the EF traffic, thus increasing the EF packet delay and EF buffer occupancy as well (see Fig. 8(b)). The second reason is that our proposed FDBA will grant extra transmission time (timeslots) to each adjacent
node (backup node), since it is also need to handle the traffics of the affected node. Therefore, it will enlarge the cycle time of each cycle, thus increasing the packet delay and EF queue length. Despite higher EF delay compared to the IPACT_Limit, our proposed FDBA still can guarantee the high-priority traffic even in the highly below 4ms. Furthermore, it is also interesting to discuss the cycle time effect to the packet delay and queue length of EF. As shown in Fig. 8(a) and (b), both DBA algorithms (IPACT and FDBA) with 1.5ms cycle time have lower EF packet delay and EF queue length. The reason behind this is that when we set the maximum cycle time to have a larger value, such as 2ms, it will cause the ONUs need to wait longer time before receiving the next transmission time from the OLT. Therefore, as can be seen on Fig. 8(a) and (b), the IPACT_Limit_2ms and FDBA_2ms have higher EF packet delay and EF queue length.
Figure 8(c) shows the packet dropping probability of the best-effort (BE) traffic. As expected, our proposed FDBA has higher BE packet dropping at the adjacent node (backup node), since it needs to accommodate the traffics of the affected node. As already stated above, our proposed inter-scheduling algorithm at the ONU will satisfy the higher-priority traffic first, before serving the lower-priority traffic such as, the BE traffic. Hence, obviously the BE packet dropping will be increased; however, as can be seen in Fig. 8(c), the BE packet dropping is only slightly increased even upon multiple link faults. In other words, it is also shown that our proposed post-fault restoration mechanism still can tolerate multiple link faults without any significant impact on the Quality-of-Service (QoS). Additionally, it has also shown that the DBAs with 2ms cycle time (IPACT_Limit_2ms and FDBA_2ms) have less packet dropping, since it has longer transmission time for each ONU in each cycle, thus reduced the packet dropping yet increasing the packet delay. Notice that the EF and AF packet dropping are not shown in the paper since there are no any packets dropping in both scenarios i.e., 1.5ms and 2ms.
Figure 8(d) shows the system throughputs of the proposed mechanism compared with the IPACT_Limit. The net system throughput is calculated by the combined efficiency multiplied with the EPON line rate i.e., 1Gbps. The combined efficiency consists of the scheduling overhead and the encapsulation overhead. The efficiency in EPON is affected by three major overheads such as, guard band, control message and cycle times [14]. The more ONUs are there in
TABLEI
SIMULATION PARAMETERS
Parameters Value
Number of ONUs in the system (N) 32
Upstream/ Downstream link capacity 1Gbps
OLT-ONU distance (uniform) 10-20km
ONU buffer size 10Mbits
Maximum transmission cycle time 1.5ms, 2ms
Guard time 1s
DBA Computation time 10s
Control message length 0.512s
Number of ONU DDF(s) Fault 2 Faults
Maximum Number of ONUs in each RG 4
RG
1 Optical LineTerminal (OLT)
OLT Post-Fault Mechanisms
Restoration Module
DBA Module PS
C
...
DDF1
DDF2
DDF3
DDF4
ONU1,4 ONU1,1
ONU1,3 ..
X
2 1ONU1,2
3 1
2
Restoration Group (RG)
ONU: Optical Network Unit
PSC: Passive Star Coupler
DDF: Drop Distribution Fiber
Restoration Path
ONU Restoration Flow
Step Step
Step Step
Step adjacent node
(backup node)
normal node normal node affected node
[image:5.595.52.292.443.558.2]the system, the more the overheads are. Therefore, upon multiple link faults, it can be observed that our proposed FDBA has higher system throughputs compared with the IPACT_Limit. The reason is that in the case of two faults scenario, the number of ONUs in the system is less compared with the no fault scenario, thus obviously the overheads of two faults should be decreased. As previously stated that when the maximum cycle time is set to 2ms, it can reduce the overheads, hence it can increase the system throughputs performance. Therefore, as shown in Figure 8(d), the DBAs with 2ms cycle time has higher system throughputs, which are 875Mbps (FDBA) and 867Mbps (IPACT), respectively compared with the DBAs with 1ms cycle time, which are 838Mbps and 828Mbps, respectively.
IV. CONCLUSION
This paper has proposed the post-fault restoration mechanism upon multiple link faults at the drop distribution fiber. In order to maintain the Quality-of-Service (QoS), we design the post-fault mechanism, which consists of QoS aware intra-scheduling, fault Dynamic Bandwidth Allocation (FDBA) and the restoration path. The intra-scheduling scheme will make sure that the highest priority traffic such as, Expedited Forwarding (EF) will be sent first. Moreover, the proposed FDBA also gives extra bandwidth to the adjacent node of the affected node in order to maintain the QoS metrics such as, packet delay, packet dropping, and so on, despite slightly increase for the packet delay and queue length of EF, respectively. Further study concerning more advanced resource allocation management and multiple faults in the same RG will be in our future work.
REFERENCES
[1] P.J. Urban, A. Getaneh, J.P. Von der Weid, G.P. Temporao, G. Vall-llosera, and J. Chen, “Detection of Fiber Faults in Passive Optical Networks,” IEEE/OSA Journal of Optical Communications and Networking, vol. 5, issue 11, pp. 1111-1121, Nov. 2013.
[2] Y. Luo, X. Zhou, F. Effenberger, X. Yan, G. Peng, Y. Qian, and Y. Ma, “Time- and Wavelength-Division Multiplexed Passive Optical Network (TWDM-PON) for Next-Generation PON Stage 2 (NG-PON2),” Journal of Lightwave Technology, vol. 31, no. 4, pp. 587-593, Feb. 2013.
[3] I.S. Hwang and A. T. Liem, “A Hybrid Scalable Peer-to-peer IP-based Multimedia Services Architecture in Ethernet Passive Optical Networks,” IEEE/OSA Journal of Lightwave Technology, vol. 3, no. 2, 213-222, Jan. 2013.
[4] P. Chanclou, A. Cui, F. Geilhardt, H. Nakamura and D. Nesset, “Network Operator Requirements for the Next Generation of Optical Access Networks,” IEEE Network, vol. 26, issue 2, pp. 8-14, March/April 2012
[5] M.M. Rad, K. Fouli, H. Fathallah, L.A. Rusch, and M. Maier, “Passive Optical Network Monitoring: Challenges and Requirements,” IEEE Communication Magazine, vol. 49, issue 2, pp. 45-52, Feb. 2011. [6] M. Hajduczenia, C. Shen, Z. Zhen, H. Elbakoury, S. Kozaki, and M.
Matsuoka, “Resilience and Service Protection for Ethernet Passive Optical Networks in SIEPON,” IEEE Communication Magazine, vol. 50, issue 9, pp. 118-126, Sept. 2012.
[7] G. Kramer, L. Khermosh, F. Daido, A. Brown, H. Yoon, K.I. Suzuki and W. Bo, “The IEEE 1904.1 Standard: SIEPON Architecture and Model,” IEEE Communication Magazine, vol. 50, issue 9, pp. 98-108, Sept. 2012.
[8] Virtual Bridged Local Area Networks, IEEE Standard 802. 1q., 1998. [9] M.A. Esmail and H. Fathallah, “Physical Layer Monitoring Techniques for TDM-Passive Optical Networks: A Survey,” IEEE Communications Surveys & Tutorials, vol. 15, issue 2, pp. 943-958, Jan. 2013.
[10] X. Bai and A. Shami, “Modelling Self-similar Traffic for Network Simulation,” Technical report, NetRep-2005-01, 2005.
[11] G. Kramer, “Ethernet Passive Optical Network”, Mc-Grawhill, 2005. [12] Cisco, “Cisco Visual Networking Index: Forecast and Methodology,
2011-2016,” White Paper, May 2012. Available at:http://www.cisco.com/en/US/solutions/collateral/ns341/ns525/ns53 7/ns705/ns827/ white_ paper_c11-481360.pdf.
[13] G. Kramer, B. Mukherjee, and G. Pesavento, “Interleaved Polling with Adaptive Cycle Time (IPACT): A Dynamic Bandwidth Distribution Scheme in an Optical Access Network,” Photonic Network Communications, vol. 4, issue 1, pp. 89-107, Jan. 2002.
[image:6.595.50.272.51.582.2][14] M. Hajduczenia, H.J.A. da Silva, and P.P. Monteiro, “On efficiency of Ethernet Passive Optical Networks (EPONs),” in Proceedings of 11th IEEE Symposium on Computers and Communications, pp. 566-572, Jun. 2006.