Automatic Correction of the Adverse Effects of Light
on Fruit Surfaces Using the Shape-from-Shading Method
Shu ZHANG 1*, Jun LU 1, Lijuan SHI 2, Xianfeng WANG 1 and Dejia HOU 1
1College of Science and 2College of Infomatics, Huazhong Agriculture University,
Wuhan, P.R. China
*Corresponding author: [email protected]
Abstract
Zhang S., Lu J., Shi L., Wang X., Hou D. (2018): Automatic correction of the adverse effects of light on fruit surfaces using the shape-from-shading method. Czech J. Food Sci., 36: 37–43.
In this study, we propose a method for correcting the adverse effects produced by the curvature of fruit objects in images acquired by cameras in machine vision systems. The areas near the edge are darker in acquired images than in the centre, which results in many difficulties for subsequent analyses. In this paper, the fruit object was considered as a Lambertian surface. The light intensity was analysed and the height and normal on fruit surface was deduced based on the shape-from-shading (SFS) algorithm. The geometric correction factors were calculated and the adverse effects of light intensity were corrected on the fruit surface. The proposed method was evaluated on a test set of four types of fruit. The results show that the non-uniformity of the greyscale value on the fruit surface fell by 35.5% after correc-tion, and the reflectance in the central area of fruit is similar to that of the peripheral areas when using the proposed method. The experiments prove that our method allowed homogenisation of the greyscale level of the pixels belonging to the same class, regardless of where they are on the fruit surface, which will facilitate subsequent classification tasks.
Keywords: fruit inspection; illumination correction; machine vision
Supported by the National Natural Science Foundation of China, Grant No. 31301235.
Diffuse reflectance imaging in visible and near-infrared light is becoming a widely accepted tool for quick, non-invasive analysis of objects (Qin & Lu 2008; Katrašnik & Pernuš 2011). It has been used in many different research fields, but in par-ticular in the fields of agricultural automation and food research for determining the quality of fruits, vegetables and meat (Zhang et al. 2014). External quality is the most important and direct sensory quality attribute of agricultural products. In general terms, the external quality of fruits and vegetables is evaluated by considering their colour, texture, size, shape and visual defects (Costa et al. 2011). The use of machine vision technology for external quality inspection and grading systems in the post-harvest pre-processing stage has assumed great importance (Teena et al. 2013).
The success of all these techniques for the inspec-tion of fruits largely depends on the design of the illumination. The key factors in building the illumi-nation system are the particular application and the geometry of the object to be inspected. If the object is almost spherical, it is more convenient to use a hemispherical diffuser chamber in order to illuminate the object uniformly (Lu et al. 2015). Riquelme et
al. (2008) used such a chamber to illuminate and
change of colour and greyscale level that need to be corrected (Gómez et al. 2008).
The calibration performed to correct the inhomo-geneity of illumination is usually based on a plane model correction. Methods based on a flat plate will fail to correct the effect introduced by the reflection of light on the fruit surface (Gómez et al. 2008). This generally results in a darkening of the edges on the object, while the central part appears brighter (Aleixos 2002; Unay & Gosselin 2007). A method has been proposed for correcting the adverse effects produced by the curvature of spherical fruits in which an eleva-tion model of the fruit is constructed (Gómez et al. 2008). These authors considered fruit as Lambertian ellipsoidal surface and produced a 3D model of fruits. Geometric factors are considered and calculated and the adverse effects can then be finally corrected. Nev-ertheless, there are some limitations to this approach. The major one is that the digital elevation model of fruits was not based on actual surface morphology but on an ideal ellipsoidal surface, so the application scope of this method is limited to spherical fruits.
In this paper, a methodology is proposed to solve the limitation described above based on the shape-from-shading method. The 3D topography of fruit surfaces is recovered using a classical shape-from-shading (SFS) method and computer vision. The height and normal of fruit surfaces are calculated in order to obtain the geometric correction factors. Four kinds of fruits of different shapes and colours are used as the test dataset, and the results show that the non-uniformity of the greyscale value on the fruit surface can be corrected significantly using the proposed method.
MATERIALS AND METHODS
Image acquisition. The machine vision system used
in this study is shown in Figure 1. It consists of a com-puter (Dell, Intel® CoreTM i3-330M, CPU 2.13 GHz, RAM 4.0 GB), a digital camera (Canon EOS 7D, with EF 70-200/f4 IS Lens) and a light source. Images were saved in 24-bit colour JPG format with 5184 × 3456 px, and the bilinear interpolation method was used to resize images to 648 × 432 px for computational efficiency.
The lighting system is composed of a LED light source and a semi-spherical diffuser, and the light source was placed inside the diffuser. The power of the LED light source is 15 watts. The diffuser is a semi-sphere with a radius of 0.1 meters. The lighting system was mounted on a holder in close vicinity to
a digital camera. The fruit sample supported on a holder is placed at a distance of one meter from the camera, and it is only illuminated by the LED light source near the camera. The light is distributed sym-metrically on the fruit surface from the right side. The entire system is placed in a darkroom. Matlab (version R2015b) was used to generate the algorithm.
Correction of the spatial variations of the light source. The shape of the LED light source results
in uneven radiance and this gives rise to spatial variations of illumination in the plane of the scene. In this case, the intensity of images acquired by the camera should be compensated for their spatial de-pendencies. This is resolved by pre-processing with respect to a white flat surface as a reference. At first, a correction was carried out based on calculating the ratio between the radiance of the fruit R (x, y) and that of the light source I (x, y):
ρ(x, y) = R(x, y)/I(x, y) (1)
The coordinates of each point on the fruit surface are (x, y). These magnitudes cannot be measured directly by the machine vision system, but they can be obtained by using a white and a dark reference (Bajksy & Kooper 2005).
The spatial compensation is achieved by applying the following formula:
ρ(x,y) = ρref R(x,y) – Iblack(x,y) (2)
Iwhite(x,y) – Iblack(x,y)
where: ρ(x, y) – illumination-calibrated image also referred to as a reflectance image; ρref – certified reflectance of the white reference; Iblack – image acquired with lens cap on that measures camera noise (dark camera current); Iwhite – image obtained by placing a calibration board in front of the camera with a reflectivity close to 100%. R(x, y) – uncorrected image
[image:2.595.305.527.106.170.2]This pre-processing corrects the spatial variations of the light source on a flat scene, but does not take into account the variations caused by the curvature of the fruit surface.
Figure 1. Diagram of the image acquisition system
Illumination model. A Lambertian surface is
char-acterised by the fact that it reflects light in exactly the same way in all directions, regardless of the direction from which it is observed. For this kind of surface, the light received by the observer depends on the angle of incidence between the direction of incident light and the direction of normal on the surface (Foley et al. 1996).
The lighting denoted by I was modelled as the over-lay of two components: the background component, IB, which illuminates the object indirectly by means of multiple reflections, and the diffuse component, ID, which comes directly from the light source and is modulated by the angle. The model of illumination is therefore given by:
I(x, y) = IDcos (φ) + IB (3)
The maximum of I is denoted as Im and can be defined in Equation (4).
Im = I(x, y)max = ID + IB (4)
If a parameter αD was defined as the ratio between the background light IB and the maximum of light Im we can obtain the following result from Equation (3).
I(x, y) = Im [(1 – αD) cos (φ) + αD]; αD = IB/Im (5)
The parameter αD is defined as the ratio of the average greyscale value received by the CCD at the points that coincide with the perimeter of fruit and the average of the brightest area on the fruit surface. By plugging Equation (5) into Equation (1), we obtain:
ρc(x,y) = ρ(x,y) = ρ(x,y) (6)
[(1 – αD) cos(ω) + αD ] εg
which expresses the result of correcting the image ρ(x, y) taking into account the geometry of the fruit, and where εg represents the geometric correction factors.
Morphology of the object surface. In order to apply
the correction mentioned above, it is necessary to
know the geometric characteristics. Here, the shape-from-shading method is used. Shape recovery is a classic problem in computer vision. The goal is to derive the 3D scene description from one or multiple 2D images. In computer vision, the methods of shape recovery are called shape-from-X techniques, where X can be shading, stereo, motion, texture, etc. Shape-from-shading (SFS) deals with shape recovery from a gradual variation of shading in the image (Zhang et al. 1999). The Lambertian model, which is described in the above section is a simple model of image for-mation. In SFS, the aim is to recover the light source and the surface shape at each pixel in the given image. In the SFS method, the shape of every fruit target is recovered based on the steps described below.
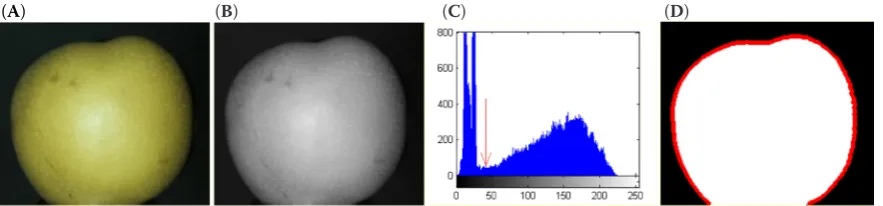
Segmentation of the input image. Because the
image acquisition system is in a darkroom, the back-ground of the input image is dark. Firstly, the input colour image in Figure 2A was converted into the greyscale image shown in Figure 2B. Secondly, an analysis of the histogram of the greyscale image was performed.
The histogram of Figure 2B is shown in Figure 2C. The histogram can be divided into two parts with a threshold which is indicated with a red arrow. To determine this position, a local smoothing method is used by averaging with width K to the original
histogram, and K is set to 5. The first minimum
is determined as the threshold which is searched backward from the last maximum. In Figure 2C, the threshold determined using this method is 40. The segmentation result of Figure 2B with this threshold is shown in Figure 2D in the white region. The contour of this fruit is outlined with a red curve.
[image:3.595.80.522.633.736.2]Calculating the value of αD. This αD parameter is determined by ratio of the average amount of light at the points that coincide with the perimeter of the fruit and the total average amount of light received by the CCD from the brightest area on the fruit surface. Only the background component
Figure 2. Pre-processing of a sample of Hosui pear: (A) original image, (B) greyscale image, (C) histogram of the greyscale image, (D) the segmentation result and contour of the fruit target
of light IB is reflected by the points situated on the perimeter of the pear, since φ = 90° at these points. The light reflected by the brightest area on the fruit surface is the maximum of IT, and it is the sum of IB (the background component)and ID (the diffuse component). Figure 3 shows the value of αD at dif-ferent points on the perimeter of a pear and how the values distributed around a mean value of 0.3341.
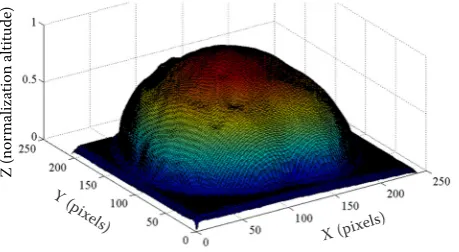
Shape recovery based on SFS. Shape-from-shading
is one of the critical techniques for shape recovery in computer vision, and allows one to obtain the 3D topography of the visible surface of targets from only one image by using the distribution of intensity. The ideal SFS algorithm can solve the normal direction and relative altitude from the intensity distribution on an object’s surface based on the hypothesis of the Lambert body model from Equation (3).
(7)
Here, the direction of the light source is denoted with L = (p0, q0, –1) the unit normal of a point on an object’s surface is N = (p, q, –1). The direction of the light source was measured based on the layout of the devices of the system used to acquire the images. Under the assumption of the Lambert body model, the height and normal of the fruit surface can be cal-culated using the Gauss-Seidel iterative method. It is solved by the theory of the constrained minimisation of functional variation. As fruit surface is convex and smooth, the linearisation technique is used to solve Equation (7) which was proposed by Tsai and Shah (1994). The relative depth is given by Equation (8), and the normal (p, q, –1) of every point on the fruit
surface is calculated based on a partial differential of x and y by z. The recovered relative depth of fruit surface in Figure 2B is shown in Figure 4. The surface topography of a Hosui pear is recovered from the greyscale distribution on its surface using the SFS method.
(8)
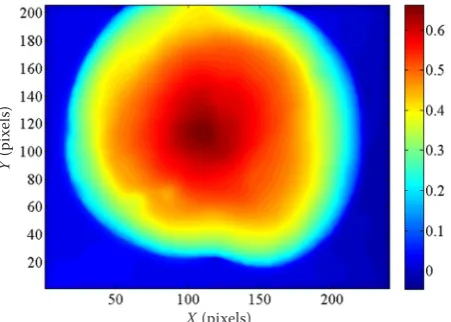
The cosine of the angle between the normal direc-tion and the incident light is inferred by Equadirec-tion (7). The geometric correction factors εg on each point are calculated by Equation (9), and are shown in Figure 5.
εg = [(1 – αD) cos (φ) + αD] (9)
Validating the proposed method. Experiments
were performed to validate the proposed method. In the first experiment, Hosui pears were used and a sample is shown in Figure 2A. The brightness of different regions of the sample was corrected by the proposed method. As a nearly spherical fruit, pixels belonging to different regions have a similar reflectance after correction.
[image:4.595.64.280.100.247.2]A second experiment was performed on other three other types of fruit with very different shapes: imperial crown pear, white muskmelon and big mango. The shape of the imperial crown pear is nearly spheri-cal, but the latter two fruits are spindle-shaped. The shapes of the fruits were recovered and the geomet-ric factors were calculated using Equation (7) and Equation (9). The greyscale values on each point of their surfaces were corrected and the brightness on different areas was compared. The purpose of this experiment was to prove that the adverse effects observed on the surfaces of fruits with arbitrary shapes can be corrected by the proposed method.
Figure 3. Estimation of the parameter αD at each of the points on the perimeter of a Hosui pear
Figure 4. Morphology of a fruit surface recovered using the SFS method
αD
e
stima
tion
0 100 200 300 400 500
Samples 0.8
0.6
0.4
0.2
0
Z (nor
mali
za
tion altit
ude)
X (pixels) Y (pixels)
= + )
)
I
(
x
,
y
) –
I
B=
I
D×
cos(φ) =
I
D=
I
D×
L × N ||L|| × ||N||
I
(
x
,
y
) –
I
B=
I
D×
cos(φ) =
I
D=
I
D×
[image:4.595.305.535.112.238.2]RESULTS AND DISCUSSION
The Hosui pear’s greyscale maps before and after correction of Figure 2A are shown in Figure 6A and Figure 6B. The central area appears brighter than the area around the edge of the fruit in Figure 6A, but the greyscale levels in Figure 6B are similar. To demonstrate the differences between them, the greyscale values along the equatorial parts of the fruit in these two figures are shown in Figure 6C. The greyscale value shown in Figure 6C is the average between two red lines with the space of five pixels. The greyscale dif-ference between the border and the centre is greater on the uncorrected image than on the corrected im-age, and the greyscale value changes very slowly from the centre to the border on the fruit surface in the corrected image. This proves that the distribution of light intensity on fruit surface is more uniform after correction, and that the adverse light effects on the fruit surface have been corrected to a certain degree.
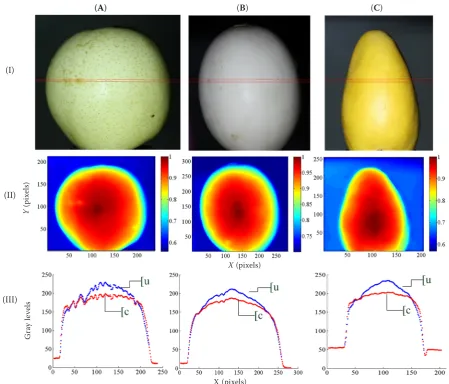
The three kinds of fruits examined in the second experiment are shown in the first row of Figure 7.
The first sample is nearly a sphere, and the latter two are spindle-shaped, but the second sample is more longitudinal symmetric than the third one. The calyx of the third sample is a little smaller than the stem. The geometric correction factors for these three samples were calculated using the proposed method and are shown in the second row of Figure 7. The average of the greyscale value along the equatorial parts are shown in the third row of Figure 7 before and after correction. The greyscale profile has a bell shape corresponding to the uncorrected image. This proves that the profile depending on the radiance acquired by the camera is modulated by the shape of fruits, so the areas near the edge are darker than those near the centre. The greyscale profile of the corrected image is considerably flatter than the profile of the uncorrected image in Figure 7.
Table 1 shows the average and the standard devia-tion of the greyscale value and the estimated correc-tion factors εg on the fruit surface before and after correction for the four kinds of sample. It can be observed that εg takes similar values for all samples. The εg factors for the two kinds of pear are bigger than for the other two kinds of fruit, because the pears are more spherical in shape.
[image:5.595.65.291.107.268.2]It also can be found that the mean value of grey-scale levels on the fruit surface change slightly after correction but that the standard deviation declines markedly compared with uncorrected images. The average standard deviation of the greyscale value declined from 38.8 before correction to 25.0 after correction. If the rate of change is defined as the change of the standard deviation after correction divided by the standard deviation before correction, then this amounts to 35.5%. In other words, the non-uniformity of the greyscale value on the fruit surface has fallen by 35.5% after correction by the method proposed in this paper.
Figure 6. The corrected results for a Hosui pear (A) uncorrected image, (B) corrected image and (C) the greyscale value distribution along the equator between the two red lines in (A) and (B) (u – uncorrected; c – corrected) Figure 5. The geometric factors εg on the surface of a
Hosui pear
(A) (B) (C)
Pixels
G
ra
y
le
ve
ls
X (pixels)
Y
(p
ix
el
[image:5.595.92.512.605.734.2]It should be pointed out that the geometric cor-rection factor εg is a key parameter in the proposed method, and its calculation relies on the recovered morphology of the fruit surface. In this paper, the height and normal on the fruit surface were calculated using the Gauss-Seidel iterative method (Tsai & Shah
[image:6.595.63.532.136.224.2]1994) under the assumption of the Lambert body model in which the reflection lights are all diffuse and no specular reflection takes place. The Lambert body model will encounter difficulties if the fruit surface is very smooth or damaged by diseases and pests. On one hand, if the fruit surface is very smooth, the specular
Table 1. Mean and standard deviation of greyscale levels on fruit surface before and after correction and geometric correction factors for the four kinds of sample
Meanu Meanc Sdu Sdc Meanεg Sdεg
Housi pear 159.97 154.59 34.97 26.16 0.77 0.05 Imperial crown pear 189.41 171.02 38.88 21.68 0.78 0.06 White muskmelon 152.20 144.83 42.53 31.44 0.66 0.07 Mango 215.94 201.74 38.62 20.74 0.64 0.07 Average 179.4 168.0 38.8 25.0 0.71 0.06
uuncorrected image; ccorrected image; εggeometric correction factor
Figure 7. The corrected results for three kinds of fruit: (Ⅰ) original colour images, (Ⅱ) Mapping of the geometric fac-tor εg on the image plane of fruits, (Ⅲ) the average of greyscale values along the equator between the two red lines in the first row (I); (A) imperial crown pear, (B) white muskmelon, and (C) mango (u – uncorrected, c – corrected)
(A) (B) (C)
X (pixels) X (pixels)
Y
(p
ix
el
s)
G
ra
y
le
ve
ls
(I)
(II)
[image:6.595.67.517.337.721.2]reflection will be increased. On the other hand, the reflectivity of damaged areas is obviously different from those of healthy areas on the fruit surface. In these two conditions, the assumption of the Lambert body model will deviate from the real distribution of light on the fruit surface. We aim to solve these dif-ficulties progressively in future research.
CONCLUSIONS
This study proposes a method for correcting the ad-verse effects produced by the curvature of fruits when acquiring the images in a machine vision system. The images are darker in the area near the edge than near the centre, which makes subsequent analyses more difficult. The proposed method considers the fruits as Lambertian surfaces and recovers 3D models of fruits based on a shape-from-shading algorithm. The height and normal of the fruit surface are analysed using the SFS method and a geometric correction factor is calculated for the fruit surface. The distribution of greyscale values after correction is flattened over the whole of the fruit’s surface in the image captured by the camera. Two tests were designed and executed to evaluate the proposed method. The non-uniformity of greyscale values on fruit surfaces fell by 35.5% af-ter correction by the method proposed in this paper. The results show that our method can homogenise the greyscale levels of the pixels belonging to the same class and facilitate quality inspection during the pre-processing of fruits. The proposed method may not only be used on near-spherical fruit but also on spindle-shaped fruits or fruits of other shapes. The assumption of the Lambert body model will encounter difficulties if the fruit surface is very smooth or dam-aged by diseases and pests, and this should be taken into consideration in further research.
References
Aleixos N., Blasco J., Navarron F., Molto E. (2002): Multi-spectral inspection of citrus in real-time using machine vision and digital signal processors. Computers & Elec-tronics in Agriculture, 33: 121–137.
Bajksy P., Kooper R. (2005): Prediction accuracy of color imagery from hyperspectral imagery. Proceedings of SPIE - The International Society for Optical Engineering, 5806: 1325–1326.
Costa C., Antonucci F., Pallottino F., Aguzzi J., Sun D.W., Menesatti P. (2011): Shape analysis of agricultural
prod-ucts: A review of recent research advances and potential application to computer vision. Food and Bioprocess Tech-nology, 4: 673–692.
Foley J.D., van Dam A., Feiner S.K., Hughes J.F. (1996): Com-puter Graphics: Principles and Practice. 2nd Ed. Boston,
Addison-Wesley: 722–733.
Gómez-Sanchis J., Moltó E., Camps-Valls G., Gómez-Chova L., Aleixos N., Blasco J. (2008): Automatic correction of the effects of the light source on spherical objects. An applica-tion to the analysis of hyperspectral images of citrus fruits. Journal of Food Engineering, 85: 191–200.
Katrašnik J., Pernuš F., Likar B. (2011): Illumination system characterization for hyperspectral imaging. Proceedings of SPIE, 7891: 141–152.
Lu J., Wu P., Xue J., Qiu M., Peng F. (2015): Detecting de-fects on citrus surface based on circularity threshold seg-mentation. In: Tang Z. (ed.): 12th International Conference
on Fuzzy Systems and Knowledge Discovery, Aug 15–17, 2015, Zhangjiajie, China. IEEA, New York: 1543–1547. doi: 10.1109/FSKD.2015.7382174
Qin J., Lu R. (2008): Measurement of the optical properties of fruits and vegetables using spatially resolved hyperspectral diffuse reflectance imaging technique. Postharvest Biology and Technology, 49: 355–365.
Riquelme M.T., Barreiro P., Ruiz-Altisent M., Valero C. (2008): Olive classification according to external damage using image analysis. Journal of Food Engineering, 87: 371–379. Teena M., Manickavasagan A., Mothershaw A., El Hadi S.,
Jayas D.S. (2013): Potential of machine vision techniques for detecting fecal and microbial contamination of food products: A review. Food and Bioprocess Technology, 6: 1621–1634.
Tsai P.-S., Shah M. (1994): Shape from shading using linear approximation. Image and Vision Computing, 12: 487–498. Unay D., Gosselin B. (2007): Stem and calyx recognition on
‘Jonagold’ apples by pattern recognition. Journal of Food Engineering, 78: 597–605.
Zhang R., Tsai P.-S., Cryer J.E., Shah M. (1999): Shape from shading: a survey. IEEE Transactions on Pattern Analysis and Machine Intelligence, 21(8): 690–706.
Zhang B., Huang W., Li J., Zhao Ch., Fan S., Wu J., Liu Ch. (2014): Principles, developments and applications of com-puter vision for external quality inspection of fruits and veg-etables: a review. Food Research International, 62: 326–343. Zhang C., Zhao C., Huang W., Wang Q., Liu S., Li J. (2017):
Automatic detection of defective apples using NIR coded structured light and fast lightness correction. Journal of Food Engineering, 203: 69–82.