~he
Economic and Social
Research Institute
MEDIUM-TERM ANALYSIS OF
FISCAL POLICY IN IRELAND:
A MACROECONOMETRIC STUDY OF
THE PERIOD
1967-1980
JOHN BRADLEY, CONNELL FANNING, CANICE PRENDERGAST
and MARK WYNNE
THE ECONOMIC AND SOCIAL RESEARCH INSTITUTE COUNCIL, 1984-1985
*T.K. WHITAKER, M.SC.(ECON.), D.ECON. SC., LL.D., President of the Institute. *P. LYNCH, M.A., M.R.I.A., Chairman of the Council.
R.D.C. BLACK, PH.D., Professor, Department of Economlas, The Queen’s University,
Belfast.
DJ. BUCKLEY, Vice President and General Manager, Merck, Sharp and Dohme (Ireland)
Ltd., Co. Tipperary.
*SEAN CROMIEN, B.A., Second Secretary, Department of Finance. G. DEAN, M.D., F.R.C.P., Director, Medico-Social Research Board.
NJ. GIBSON, B.SC.(ECON.), PH.D., Professor, Department of Economics, University
of Ulster, Coleraine.
PATRICK A. HALL, B.E., M.S., DIP.STAT., Director of Research, Institute of Public
Administration.
*W.A. HONOHAN, M.A., F.I.A.
MICHAEL F. KEEGAN, B.A., B. COMM., D.P.A., F.I.P.M., Secretary, Department of
Labour.
*KIERAN A. KENNEDY, M.ECON.SC., B.PHIL., PH.D., Director of the Institute. MICHAELJ. KILLEEN, B.A., B.COMM., LL.D., Chairman, Irish Distillers Group. T.P. LINEHAN, B.E., B.SC., Director, Central Statistics Office.
*D.F. McALEESE, B.COMM., M.A., M.ECON.SC., PH.D., Whately Professor of Political
Economy, Trinity College, Dublin.
CHARLES McCARTHY, PH.D., B.L., Professor of Industrial Relations, Trinity College,
Dublin.
*EUGENE McCARTHY, M.SC.(ECON.), D.ECON.SC., Director, Federated Union of
Employers.
jOHN j. McKAY, B.SC., D.P.A., B.COMM., M.ECON.SC., ChlafExecutlae Officer, Co.
Cavan Vocational Education Committee.
*j.F. MEENAN, M.A., B.L.
*D. NEVIN, General Secretary, Irish Congress of Trade Unions. *TOMAS F. 6 COFAIGH, Governor, CentralBank.
JOYCE O’CONNOR, B.SOC.SC., M.SOC.SC., PH.D., Director, Social Research Centre,
College of Humanities, National Institute for Higher Education, Limerick.
E. O’DRISCOLL, B.SC., M.ENG., Managing Director, Wang Laboratories Ireland, B. V.,
Limerick.
D.P. O’MAHONY, M.A., PH.D., B.L., Professor, Department of Economics, University
College, Cork.
LABHRAS 6 NUALLAIN, D.ECON.SC.
B. PATTERSON, B.A., M.I.I.E., A.I.P.M., Director General, Irish Management Institute. S. SHEEHY, B.AGR.SC., PH.D., Professor, Department of Appllad Agffcultural
Econo-mics, University College, Dublin.
T.C. TONER, B.COMM., M.B.A., Managing Director, BWG Ltd.
*B.M. WALSH, B.A., M.A., PH.D., Professor, National Economics of Ireland and Applied
Economics, University College, Dublin.
T. WALSH, M.AGR.SC., PH.D., D.SC., M.R.I.A.
*REV. C.K. WARD, B.A., S.T.L., PH.D., Professor, Department of Social Science,
Uni-versity College, Dublin.
P.A. WHITE, B.COIvLM., D.P.A., Managing Director, Industrial Development Authority,
Dublin.
MEDIUM-TERM ANALYSIS OF
FISCAL POLICY IN IRELAND:
A MACROECONOMETRIC STUDY OF
THE PERIOD 1967-1980
Copies of this paper may be obtained from The Economic and Social Research Institute (Limited Company No. 18269). Registered Office:
4 Burlington Road, Dublin 4.
Price 1R£8.00
MEDIUM-TERM ANAL YSIS OF
FISCAL POLICY IN IRELAND:
A MACROECONOMETRIC STUD Y OF
THE PERIOD 196 7-1980
JOHN BRADLEY, CONNELL FANNING, CANICE PRENDERGAST
and MARK WYNNE
© THE ECONOMIC AND SOCIAL RESEARCH INSTITUTE
DUBLIN, 1985
Acknowledgements
Chapter 1 : Chapter 2: Chapter 3: CONTENTS Acknowledgements General Summary INTRODUCTION
THE MODELLING FRAMEWORK Introduction
The Supply Block Introductory Remarks Industry
Agriculture, Forestry and Fishing Services
Imports Labour Supply
National Aggregates: Supply and Income
The Absorption Block Introductory Remarks Consumption
Investment
Exports and the Balance of Payments National Aggregates: Demand
The Income-Distribution Block Introductory Remarks
Producer (Added-Value) Prices Expenditure Prices
Wages
Fiscal Activities: General Remarks Fiscal Activities: Details
National Debt Interest Payments Monetary Activities
EMPIRICAL TESTING OF THE MODEL Tracking Performance of the Model Multiplier Analysis: Introduction
Alternative Perturbations to a Single Version of the
Model 68
Chapter 4:
Chapter 5:
Chapter 6:
Chapter 7:
POLICY ANALYSIS WITH MACROMODELS Introduction
The Methodology of Policy Evaluation Policy Analysis with a Specific Model Fiscal Policy in 1967
FISCAL POLICY EFFECTS: 1967-1980 Introduction
82 82 83 88 93
106 106 Fiscal Policy Effects 1967-1980: Incremental Approach 107 Fiscal Poficy Effects 1967-1980: Integral Approach 119
Conclusion 134
BUDGETARY OBJECTIVES AND POLICY CONSEQUENCES
CONCLUSIONS AND FUTURE RESEARCH Review
Future Research
Refere~tce$
136
151 151 156
160
Appendix 1: MODEL VARIABLE DEFINITIONS
Appendix 2: LISTING OF THE MODEL EQUATIONS
Appendix 3: A NOTE ON FISCAL INDEXATION RULES
164
175
195
LIST OF TABLES
Table Page
3.1: Simulation results for 1966-1980 46
4.1: Fiscal policy instruments 91
4.2: Actual and hypothetical values of fiscal instruments in 1967 92
4.3: Examples of fiscal indexation for 1967 94
5.1 : Changes of government, 1965-1984 106
5.2: Fiscal policy effects, 1967-1980: Effects on growth rate of
real gross domestic product 108
5.3: Fiscal policy effects, 1967-1980: Effects on real personal
5.4: Fiscal policy effects, 1967-1980: Effects on balance of
pay-ments surplus as a percentage of GDP 112
5.5 Fiscal policy effects, 1967-1980: Effects on public authorities
surplus as a percentage of GDP 114
5.6: First year effects of discretionary fiscal policy on balance of
payments and public authorities snrplus 115
5.7: Fiscal policy effects, 1967-1980: Effects on numbers
un-employed 116
5.8: Fiscal policy effects, 1967-1980: Effects on marketed sector
employment (industry and marketed services) 117
5.9: Impact and long-run employment effects of discretionary
fiscal policy for industry and marketed services 118
5.10: Fiscal policy effects, 1967-1980: Effects on consumption
price inflation rate 120
5.11: Fiscal policy effects, 1967-1980: Effects on industrial wage
in flation rate 121
5.12: Integral fiscal policy analysis, 1967-80: Effects on GDP and
real disposable income 123
5.13: Integral fiscal policy analysis, 1967-1980: Effects on balance
of payments and public authorities surplus 124
5.14: Integral fiscal policy analysis, 1967-1980: Effects on
unem-ployment and marketed sector emunem-ployment 125
5.15: Integral fiscal policy analysis, 1967-1980: Effects on
con-sumption price and wage inflation 126
6.1: Summary post-budget estimates from budget speeches 139
6.2: The public capital programme 139
Figure 2.1:
2.2:
2.3:
2.4:
2.5:
3.1:
3.2:
3.3:
3.4:
3.5:
3.6:
LIST OF FIGURES
Page
Block structure of model 15
Schema for industry sector 20
Schema for agriculture, forestry and fishing sector 23
Schema for marketed services subsector 25
Schema for labour supply 27
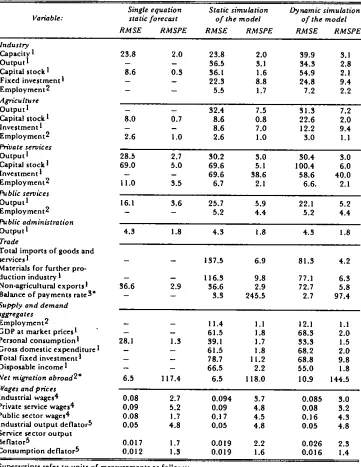
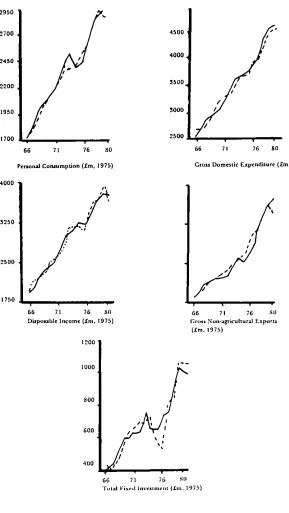
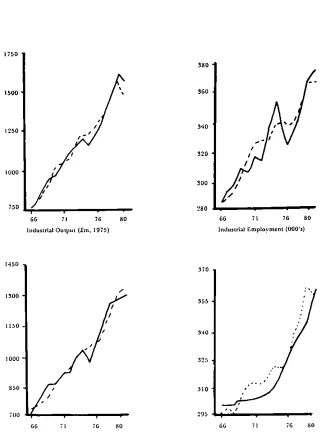
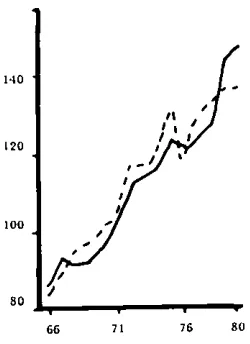
Within-sample tracking: selected demand variables 48
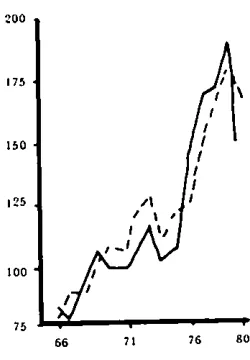
Within-sample tracking: sectoral investment 49
Within-sample tracking: selected supply variables (a) 51
Within-sample tracking: selected supply variables (b) 52
Within-sample tracking: selected aggregates 54
Within-sample tracking: inflation rates of selected wages and
prices 56
3.7: Multipliers for standard model: change in public expenditure 60
3.8: Multipliers: role of Phillips curve 61
3.9: Multipliers: role of direct taxation in wage bargaining 62
3.10: Multipfiers: role of industrial capacity determination 64
3.11 : Multipfiers: role of productivity 66
3.12: Multipliers: role of prices in wage determination 67
3.13: Multipfiers: role of returns to scale in industry 69
3.14: Multipliers: alternative financing of borrowing requirement 70
3.15: Multipfiers for standard model: increased pubfic employment 71
3.16: Multipliers: one year indirect tax increases 73
3.17: Multipliers: increased world demand 75
3.18: Multipliers: marginal changes in foreign interest rates 77
3.19: Multipliers: major changes in foreign interest rates 78
3.20: Multipliers: changes in world unit labour costs 80
4.1: A simple macromodel 86
4.2: The output effects of taxation and expenditure changes: UK,
1974-1979 89
4.3: The effects of fiscal indexation in 1967: gross domestic
4.4: The effects of fiscalindcxation in 1967: unemployment 4.5: The effects of fiscal indexation in 1967: balance of payments 4.6: The effects of fiscal indexation in 1967: public authorities
surplus
4.7: The effects of fiscal indexation in 1967: price and wage inflation
4.8: The effects of fiscal indexation in 1967: supply side measures 4.9: The effects of fiscal indexation in 1967: employment
4.10: The effects of fiscal indexation in 1967: consumption and investment
5.1: Cumulative discretionary effect on gross domestic product 5.2: Cumulative discretionary dffect on real disposable income 5.3: Cumulative discretionary effect on balance of payments rate 5.4: Cumulative discretionary effect on public authorities surplus
rate
5.5: Cumulative discretionary effect on unemployment, employ-ment and migration
5.6: Cumulative discretionary effect on inflation of prices and wages
97 98
99
101 102 103
105 128 128 129
131
133
GENERAL SUMMAR Y
The decade of the 1970s was characterised by fluctuations in the world economy of a kind whicb had not been experienced in peacetime since the 1930s. Even with the wisest and most prudent fiscal and monetary policies it would have been impossible to protect the Irish economy fully from the world-wide recession. Our objective in this paper is to investigate what effect fiscal policies had on tile evolution of the Irish economy over the period 1967 to 1980 and, with the benefit of hindsight, to attempt to formulate a judgement as to the manner in which fiscal policy was planned and executed. The "hindsight" from which we benefit has two major components: first our access to data which are at once more detailed and accurate than those available to successive Ministers of Finance at the time when they planned their budget strategies and second our use of a formal model of how the various sectors and agents in the economy interact with each other and evolve
over time. While the first component (more accurate data) is an unqualified benefit, the second component (the model) is much more controversial since there is no absolute consensus in the economics profession on broad areas of macroeconomic theory and modelling practice. We are fully conscious of this problem and hope that the reader will not interpret our formal and detailed quantitative analysis as implying either ignorance or arrogance on our part in respect of the current very active international research into the foundations of macroeconomic theory and practice. It remains, of course, for the reader to decide whether our judgement, in relation to the gross simplifications needed in order to construct an operation’,d model of the economy, has been good or bad.
THE ECONOMIC AND SOCIAL RESEARCH INSTITUTE
capacity output, the related long-run demands for labour and capital, the short-run (or actual) labour and capital inputs, and the rate of capacity utilisation. The concept of "export-led" growth motivates the determination of capacity, and the determination of factor inputs is along fairly standard neo-classical lines (meaning that, for example, employment and investment are sensitive to relative factor prices as well as to output). The behaviour of the agricultural sector is considerably more simple and is heavily influenced by institutional, governmental and demographic forces. The service sector has three subcomponents; a marketed services component (responsive to demand and prices), a non-marketed component (consisting of non-public authorities elements such as teachers, hospitals,etc.), which is almost entirely state funded, and a public authorities component (public administration and defence), which is considered as largely instrumental in nature. Two further parts of the supply block deal with the determination of imports and labour supply.
The second main block deals with the determination of domestic and foreign absorption (i.e., consumption, investment, stock changes and exports) and is of fairly standard form. The third and final block of the model trans-lates the factor-based modelling of supply into the pattern of income dis-tribution which results from the interaction of production and demand activities, and yields the prices and incomes accruing to the sectoral and expenditure categories used in the model. The basic inspiration for the determination of prices and wages comes from the "Scandinavian" model. We identify our industry sector with the "tradables" sector and the services sector with the "non-tradables" sector. In the main variant of the model, the price of tradables is determined on world markets. Wage inflation in both tradable and non-tradable sectors adjusts to the "room" for wage increases in the tradables sector, i.e., an increase which is consistent with a "normal" profit share. Price inflation of non-tradables is determined by cost-push forces and overall price inflation is a weighted average of both the tradable and non-tradable elements. In addition, wage determination can be in fluenced by deviations of the unemployment rate from its trend value (i.e., a Phillips curve). The second component of the income distribution block deals with state expenditure and revenue and with the financing of the resulting deficit. The monetary environment is modelled using a conventional small-open-economy (SOE) fixed exchange rate approach.
GENERAL SUMMARY 3
Such testing complements a study of the individual equations of the model (Chapter 2), but does not constitute a "validation" of the model in any formal or rigorous sense.
Chapter 4 deals with the methodology we have used to investigate the detailed impact and delayed effects of fiscal policy actions. Basically we wish to compare the effects of actual fiscal policy actions (which, of course, yielded the historical outturn) with some idealised, or benchmark, fiscal policy (which would yield a hypothetical outturn when simulated with the model). The benchmark policy we choose attempts to pin down the concept of "fiscal neutrality" or "fiscal indexation", concepts which, in one form or another, are used in official publications dealing with fiscal policy. By look-ing at the difference between the hypothetical outturn and the actual out-turn we can attempt to quantify the extent to which actual fiscal actions differed from "fiscal neutrality", defined in a specific way. This allows us quantify the "discretionary" element of policy. These ideas are illustrated in Chapter 4 using the year 1967 (the first year in our sample), and show the impact (or immediate) effects of discretionary policy and the manner in which these effects change over time as the economy evolves in response to discretionary policy changes.
Chapters 5 and 6 represent the empirical core of our study. In them we examine how the exercise of fiscal "discretion" (by our definition) has influenced major economic indicators such as gross domestic product, real personal disposable income, the balance of payments and the borrowing requirement, unemployment, employment in the market sector of the economy, consumption prices and wages. The period being examined (1967 to 1980) includes the run-up to the world economic crisis associated with the first OPEC oil price rises. It also includes the full duration of the Fianna F;iil administration of 1969173, the Fine GaeI-Labour Coalition of 1973/77 and all but six months of the succeeding Fianna Ffiil administration which remained in office until June 1981. Two of Whitaker’s "financial turning points" also fall in our period, namely the introduction of current budget deficits as explicit policy measures from 1972 and the very "expansionary" budgets of 1978[79 (Whitaker, 1983).
Our analysis of fiscal policy is presented under two headings: "incremental" analysis, which attempts to isolate effects of discretionary policy changes specific to each individual year of our sample, and "integral" analysis, which attempts to quantify the effects of pursuing a policy of continual strict fiscal indexation from an initial year (1967) to a terminal year (1980).
THE ECONOMIC AND SOCIAL RESEARCH INSTITUTE Some broad conclusions can be drawn from such tables:
(i) Discretionary fiscal policy since 1967 can be classified in five periods. From 1967 to 1971, discretionary policy was not very active and the current budget was preserved in balance. The period 1972 to 1975 was characterised by much greater fiscal activism, and during 1974 and 1975 a very explicit counter-cyclical policy was pursued, leading to large overall deficits and, in particular, increasingly large planned current deficits. Discretionary fiscal policy in 1976 was contractlonary and, glvcn that world economic growth had resumed, was of a counter-cyclical stance. The change of administration in
1977 initiated two-and-a-half years of unbridled discretionary fiscal expansion which was strongly pro-cyclical. Finally, policy imple-mented in 1980 ceased to be expansionary but did not attempt to correct the accumulated fiscal imbalance.
(ii)Within such a broad classification, two budgets stand out as being of particular interest. In both 1971 and 1976 the c~onsequences of fiscal discretion were particularly inflationary, leading to increments to wage inflation of 3.9 and 4.2 percentage points, respectively. In the case of 1971, the underlying increase in world inflation appears to have been underestimated by the authorities and fiscal drag (par-tlcnlarly through the system of direct taxation) was very inflationary in its consequences. In 1976 an explicit policy of tax increases led to in flationary pressures, again through wage bargaining, as they affected prices and direct tax rates.
(iii) In almost all years, any impact effect on the growth rate of GDP is quickly eroded over time.
(iv) The effects of discretionary fiscal policy on unemployment and market sector employment are complex. Broadly speaking, the effects of fiscal discretion over the whole period was to lower unem-ployment in the first year (the major exception being 1976 where
unemployment increased in the first year by 6,600). However, for all years other than 1971 and 1976, any change was eroded over time. In 1971, the initial slight fall in unemployment resulted, by 1980, in a rise of 20,000. In 1976, the initial rise of 6,600 resulted in a rise of 21,500 by 1980. In both cases the loss of competitiveness in the industrial sector due to domestic cost-push influences through the tax systems was largely responsible.
GENERALSUMMARY 5
the wage equation, i.e., unemployment does not directly influence wage bargaining. Third, a variant of the standard model where a crucial parameter (the elasticity of the "target" wage with respect to the income retentions ratio) is changed from unity to 0.5. Finally, a variant where the above parameter is set to zero, i.e., direct tax rates do not affect wage bargaining directly. Of interest in our analysis are both the results for the standard mode] variant and the extent to which such results are sensitive to each of the other three model variants. Some broad results for the standard model are as follows:
(i) The cumulative effect of fiscal discretion on the growth rate of GDP was positive for all years except 1968, 1974 and 1976-1978. For example, by 1980 the growth rate was 1.7 percentage points higher than would have been the case under policies of strict indexation from a 1967 base. The largest negative effect was in the year 1977, when actual policies reduced growth by 3.7 points relative to indexed policies, largely as a result of the negative delayed effect from the
1976 budget.
(ii) The cumulative effect of fiscal discretion on the level of real personal disposable income was positive for all years except 1971 and 1977. In both of these years the negative effect was very minor.
(iii) Fiscal discretion led to a massive deterioration in both the balance of payments and the borrowing requirement. Under strict indexation of policy since 1967, there would have been a balance of payments surplus of 10 per cent of GDP by 1980. The mechanisms which caused such extraordinary behaviour related mainly to the export-led orientation of the industrial sector, the accumulation of foreign assets as the borrowing requirement would have been reduced (the domestic financing component being exogenous in the model) and the massive gains in competitiveness. Needless to say it does not need the "Lucas" critique of policy analysis to warn us that such an extraordinary economic configuration would have caused shifts in many of the parameters of the model (even if we grant that it would have been politically feasible) and the assumption of a fixed exchange rate would appear implausible in such a context.
(iv) The cumulative effects on unemployment numbers were rather small. Only for the years 1977 and 1978 is the effect positive, largely as a result of the deflationary budget of 1976, followed by relatively neutral fiscal policy over the whole of 1977.
THE ECONOMIC AND SOCIAL RESEARCH laNSTITUTE
effect of fiscal discretion on market sector employment was negative. By 1980, this loss amounted to 90,800 jobs. Between 1967 and 1980, on the other hand, about 94,400 jobs were "created" in the non-market sector.
Turning to the second aspect, i.e., the sensitivity of our results to certain key model properties, the GDP growth rate and the level of real personal disposable income are relatively insensitive to changes in the model variants. In the case of the balance of payments deficit and the borrowing require-ment, our use of an elasticity of unity on the income retentions ratio in the standard model wage equation has exaggerated the discretionary effects, relative to the lower values of 0.5 and zero. This aspect of the model also proves to be important in determining the unemployment and employment effects of policy. Our inclusion of ten possible variants of the wage equation in the model is a measure of our uncertainty regarding this vital aspect of the economy and the central role played by wage determination in solving the model.
In Chapter 7, we provide an overview of the effects of fiscal policy over the 1967 to 1980 period. Based on the results of Chapters 5 and 6, we suggest that the effectiveness of fiscal policy in attaining long-term growth goals (as distinct from changing short-term standards of living) has fallen well below that which was expected of it by policy makers. Two types of budgets are distinguished which appear to characterise the fiscal stance of the ’seventies --namely, those aimed at the immediate expansion of activity and those aimed at the correction o f high inflation rates or balance of payments deficits. We conclude that neither type of policy has stimulated sustainable long-term growth. Our analysis suggests that this results from an apparent failure by policy makers to comprehend the mechanisms of inflation and/or the level of leakages from the economy via imports and savings. Specifically, the potential relationship between wage inflation and rates of taxation, where gross wages may adjust after tax changes to maintain net wages, was poorly understood in many of the budget speeches. This mechanism, plus that of the Phillips curve, has resulted in fiscal policy during the ’seventies hamper-ing the industrial sector through disimproved competitiveness vLv-&-~s our trading partners rather than stimulating its growth via a buoyant domestic economy. A consequence of this is that fiscal policy has induced a shift of resources from the private marketed sectors (notably the industrial sector) to the public non-marketed sectors, leaving the domestic economy in a weaker position to take advantage of an upturning world economy than it otherwise might have been with indexed fiscal policy.
GENERALSUMMARY 7
betwceJl areas where our model could be improved and areas where our method of policy evaluation might be inadequate. We discuss the crudeness of the
industrial sector, where thc level of domestic demand does not influence long-rtm output ;uld where the Public CapitM Progrmllmc may not have been adequately treated. Doubts ;ire also raised as to our failure to link agricultural output to material inputs in a consistent framework. The poor quality of data used in the market services sector is ,also seen as a barrier preventing a more adequate representation of the economy. Finally, we admit the short-comings of a fixed-exchange ratc SOE monetary sector and
the mcthod of debt financing uscd in the model. ’l’he paper is concluded by dcscrihing somc problcms with our method of policy evMuation, notably the assumptions of temporal policy independence and perfect foresight, and potcntial problcms caused by thc Lucas critique, i.e., policy-induced changes in the model paramcters due to rational expectations formation by agents.
Chapter 1
INTR 01) UCTION
Our objective in this paper is to present a quantitative analysis of fiscal policy in Ireland over the period 1967 to 1980. In order to place this analysis on a firm basis we have constructed an operational macroeconometric model of the economy which has a medium-term orientation and we test this model in terms of its ability to ~sist in explaining and interpreting economic behaviour during the 1967-1980 period.
To carry out quantitative economic analysis requires a formal economic model. However, to present analysis and draw conclusions on the basis of computations carried out using a model presents conceptual and practical difficulties. To the recipients of the proffered economic advice, the "model" may be the subject of controversy. Such an audience will wish to know how sensitive is the advice to the particular form chosen for the model. Alter-natively the model may appear as a mysterious "black box" and be liable to be misunderstood or abused by becoming, for example, a tool in a debate where sides are chosen according to the extent that the structure of the model has certain theoretical properties and the "results" from the model agree with predetermined views.
INTRODUCTION 9
performance of such models is often quite impressive, at least for the his-torical, or within sample, period. However, it may be less easy to evaluate the usefulness of the model’s policy advice. In addition, "empirical" equations, with their many parameters and variables, often become subject to structural instability when data revisions are made or when new data observations are added. A final approach could be to use a judicious mixture of an imposed theoretical structure and of empirical investigation to produce equations that have both reasonable (or at the least, understandable) theoretical under-pinnings and acceptably accurate tracking performance. Such an approach attempts to use the best elements of both previous attitudes. Ideally the entire model should be derivable from an integrated set of chosen theoretical postulates but in practice this is often unattainable-and an operational model represents an uneasy compromise betwecn theoretical rigour and empirical findings. The model used in this study is an example of just such a compromise.
There has been extensive previous empirical analysis of the macroeconomy in Ireland. Some of this has been at a sectoral level, while many previous attempts have been made to construct and use operational macroeconometrie models of the economy.1 One previous model is being used extensively for policy analysis and forecasting and has been updated and maintained on a regular basis (FitzGerald and Keegan, 1982). This model, MODEL-80, has been used by the Department of Finance, the Central Bank of Ireland, the ESRI and the National Planning Board. However, there are features of MODEL-80 which make it unsuitable for use in medium-term policy analysis. In its orientation MODEL-80 is a short-run demand management model with detailed modelling of the expenditure and income side of the national accounts but with less attention given to the problem of modelling the supply of output and factor inputs on a sectoral basis. Its basic assumption, common to all models of its type, is that the supply side will accommodate any increases in demand with little complication. The major portion of MODEL-80 is given over to a very detailed modelling of the fiscal instru-ments available for use by the government and the manner in which these instruments can be brought to bear to influence demand. In deciding to construct a new model for use in the analysis of medium-term economic policy issues we have been influenced by the necessity to incorporate supply side features in a fundamental way. As Lawrence Klein has suggested in a recent book, it is only by constructing a model which brings together the total forces of supply and demand that we can understand, and then derive policies to affect, the economic issues of modern society (Klein, 1983).
10 THE ECONOMIC AND SOCIAL RESEARCH INSTITUTE
The conventional use of simultaneous equation econometric models for policy analysis has been the subject of much criticism by the economics
pro-fession. A succinct summary of major areas of contention was provided by Geary (1982) ill his reply to the FitzGerald and Keegan (1982) paper on MODE L-80. Although raised in the context of a critical evaluation of MODEL-80, these points have more universal application to all macromodels. We summarise Geary’s views below.
First, it was claimed tbat macroeconometric models performed badly in dealing with the economic upheavals of the 1970s and that the "Keynesian orthodoxy", widely regarded as providing the theoretical underpinnings of empirical models, had broken down. As a statement of fact, one could hardly dispute this point.2 However, the macromodels of the late 1970s and early
1980s arc very different entities from those of the earlier period. As put by Hclliwell and McRac (1981), "any model structure that was chosen.., a decade ago is sm’e to be the wrong structure now that energy price changes and other events have posed new and largely unforeseen problems of adjust-mcnt". The inference to draw from Geary’s point is that Irish applied econo-mists must face up to these new challenges in a constructive way, be it through rico-Keynesian or new classical frameworks (Klamer, 1984).
Geary’s second point concerned issues of econometrics and their relation-ship to empirical models; that models are cavalier on the issue of stochastic specification and require identification restrictions which, in the terminology of Sims (1980), are simply incredible. On the issue of stochastic specification it is, indeed, the case that the imperatives of making a model operational result in gross simplifications both in the error structures used and in the estimation techniques applied. Also, the identifying restrictions are mainly simplifications, chosen empirically so that they do not conflict with the data.
The third point was essentially the "Lucas critique" of the use of macro-models for policy analysis, which holds that the parameters of the model may not remain fixed but may vary with each alternative policy. This critique, by using examples generated with the rational expectations assumption,s shows what serious errors can be made in econometric policy analysis if the response of expectation formation mechanisms to policy is ignored. In the words of Sims (1982), "As in most revolutions, the old regime toppled by the rational expectations revolution was corrupt and in some sense deserved
2. Although Alan Blinder (1979) held that the neo-Keynesian approach provided a quite adequate interpretation of the stagflation of 1979-1976.
INTRODUCTION 11
its fate. However, as is often the case, the revolution itself has had its excesses, destroying 0/" discarding much that was valuable in the name of utopian ideology". Sims argues that the explicit identification of expectation-fomlation mechanisms is not necessary for policy analysis and that the rational expectations critique is only a special case of the more general cautionary note-statistical models are likely to become unreliable when extrapolated to make predictions for conditions far outside the range experi-enced in the data sample used for estimation (Sims, 1982, p. 122).
In a final point, Geary argued that if the specification of a model is ad hoc, there can be no presumption of the internal consistency often claimed for models. He suggested that a more aggressively experimental approach with smaller models might be useful either in the direction of extensive paramctrisation using information from tightly specified sectoral models or a less structured time-series approach using quarterly data. Our approach leans towards the first suggestion (in particular our industrial and service sectors are tightly specified with an imposed technology) while recent applications of the new quarterly national accounts derived by O’Reilly
(I 982) has developed the second line of research. O’Reilly’s analysis, using a pure muhivariale lime-scries technique, indicated that issues of lag structures and stochastic error specification may usefully be explored but that the imposition of strong theoretical priors is needed to resolve problems such as muhicollinearity.
1 2 THE ECONOMIC AND SOCIAL RESEARCH INSTITUTE
construction and use are organic social processes and not mechanical activities. The remainder of our paper is structured as follows. In Chapter 2 we describe the structure of our model and highlight some of the key numerical magnitudes that serve to characterise it. Detailed technical equations and statistical estimation results are presented in Appendix 2. Extensive back-ground material has been given in a previous paper, Bradley and Fanning (1984), so our presentation is fairly concise.
In Chapter 3, we describe the tests we have carried out to examine the performance of the model as a mathematical-statistical system representing
the real economy. Such tests consist of various types of model simulations and involve the calculation of model "multipllers", where policy or exo-genous variables are altered and the impact on the model relative to some control solution is examined. Such testing complements a study of the individual equations of the model in the sense that while individually the equations of the model make good sense as an integrated system they might have undesirable properties.
In Chapter 4 we descp.’be briefly the methodology of policy analysis. Techniques available for use can range from fairly simple simulation experi-ments to sophisticated use of optimal control techniques. We restrict ourselves to the simpler simulation techniques, at)d make use of an approach developed by Blinder and Goldfeld (1976) which permits investigation of the detailed impact and delayed effects of policy actions. This approach is model based and, hence, the results are only as credible as the underlying model We hope that our results will encourage others to attempt to encapsulate their views on the workings of the macroeconomy within their own quantitative frame-works and thus provide alternative policy analysis for comparison and public discussion.
In Chapter 5 we undertake a retrospective analysis of fiscal policy over the period 1967 to 1980. This period covers approximately the terms of four different political administrations, the last two being characterised by vigorous fiscal policies designed to insulate the economy from the ravages of the post-OPEC world recession. Our methodology does not permit us to enquire into the reasons why various policy decisions were taken, but merely permits us to attempt to quantify the effects of what was done, be it inten-tionally or otherwise. However, a recent article by Whitaker (1983) on "Financial Turning Points" provides interesting interpretations of the motives of, and political constraints facing, the governments of the period being studied.
INTRODUCTION 13
analysis contained in Chapter 5 and to compare, where possible, the con-temporaneous "ex-ante" projected budget effects with our "ex-post" analysis.
Chapter 2
THE MODELLING FRAME WORK
INTRODUCTION
To construct a model of an economy is essentially to have a view of how that economy works and to incorporate that view into a set of mathematical equations. Some of these equations will have a "behavioural" content in the sense that they describe directly the behaviour of agents in the economy (e.g., the consumption function for households or the demand for labour by industry). Other equations will have no behavioural content but will simply link variables together (i.e., the ex~post identities of the model). In addition, the behavioural equations invariably contain parameters or coefficients whose specific numerical values are assigned using statistical estimation techniques with time-series data.
As a result of its technical and mathematical nature, any thorough descrip-tion of a macroeeonometric model must, of necessity, be a complex affair. In order to make this task more digestible we have split it into three separate, but obviously interrelated, parts. In this chapter we give a mainly verbal des-cription of the behavioural structure of the model and highlight some of the most important empirical findings from the statistical estimation. In Appendix 2 we present a purely technical summary of the model equations and the complete statistical results of the estimation. In Chapter 3 we describe some of the ways in which the model performs as an in tegrated system, how it stands up to the standard tests of within-sample tracking performance and how it re-acts to perturbations or shocks to its exogenous variables and to its coefficients.
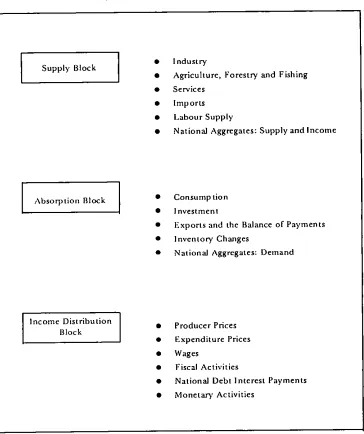
In this chapter our description is organised around a three-block framework comprising a supply block, an absorl3tion block and an income distribution block. The main components of each block are shown in Figure 2.1. The reasons for choosing this method of organising the model structure have been discussed at length in a previous publication (Bradley and Fanning, 1984) and while the actual nomenclature should not be taken too seriously, this approach does serve to highlight the main behavioural components of the model and is useful for expositional purposes. Figure 2.1 also provides the linear sequence which we follow in our exposition of the model.
THE MODELLING FRAMEWORK Figure 2.1: Block structure of the model
15
Supply Block
I
¯ Industry
¯ Agriculture, Forestry and Fishing ¯ Services
¯ Imports ¯ Labour Supply
¯ National Aggregates: Supply and Income
I
Absorption Block ¯ Consumption ¯ Investment¯ Exports and the Balance of Payments ¯ Inventory Changes
¯ National Aggregates: Demand
Income Distribution
Block ¯ Producer Prices ¯ Expenditure Prices ¯ Wages
¯ Fiscal Activities
THE ECONOMIC AND SOCIAL RESEARCH INSTITUTE
THE SUPPL Y BLOCK
Introductory Remarks
In the treatment of domestic supply of goods and services in the model we use a major division into three production branches - industry, agricul-ture and services. The agriculagricul-ture branch includes forestry and fishing while the services branch includes marketed sen, ices, non-marketed services and public administration. Completing the supply block are two sections con-cerned with imports and the balance of payments and with the issue of labour supply.
In the case of industry we attempt to implement a theoretically coherent behavioural model. The core of the industry sub-model involves the deter-mlnation of industrial capacity output and the related long-run factor demands for labour and capital. Our approach to the determination of capacity out-output is in the spirit of the model of export-led growth (Caves, 1970; Dixon and Thirlwall, 1975; Thirlwall, 1980;Kennedy and Dowling, 1975). Because the simulation results of the model can be very sensitive to particular assump-tions made by the modellers, we have set up multiple opassump-tions in the case of various key equations. Three versions of the capacity output relationship are available in the model. In the first the determinants are simply expected world demand (proxied by a trade-weighted world GDP variable) and a measure of the relative competitiveness of production in Ireland and else-where. An autonomous growth in capacity was also found, which could not be explained by other than a time trend. In the second we have included a disequilibrium term in expected domestic absorption which modifies the previous formulation. In the third version we have included both world activity and domestic absorption together with relative competitiveness. This last version cannot be interpreted within the export-led growth framework since it requires both expected world demand and domestic absorption to be autonomous.
THE MODELLING FRAMEWORK 17
need not be on its long-run production function. Finally, actual output in industry is determined primarily by the capacity output measure, but is affected by abnormal changes in final sales of industrial goods and by the profitability of production (Helliwell, Boothe and McRae, 1982, p. 265).
In the case of agriculture, forestry and fishing (AFF), it was recognised that employment and investment decisions were unlikely to derive from neo-classical optimising paradigms which are more appropriate to an industrial sector exposed to international competitive forces and relatively capital intensive. In Irish agriculture, institutional, government and demographic
forces become dominant and any realistic model must recognise this. Given the importance of the agricultural component of AFF, and the ready availability of data on gross output and material inputs, we attempt to model gross agricultural output by means of a simple supply function making output sensitive to capacity, relative prices of output and inputs, and weather con-ditions. A separate equation explains the demand for material inputs and permits the derivation of added-value in agriculture. Added-value in forestry and fishing, a very small element of total AFF, is left exogenous. Employ-ment in AFF is modelled as a labour-release or migration-out process in that agents who do not leave are employed. The long-term factors permitting and encouraging the release of labour from AFF are the growth of labour pro-ductivity, the relative earnings differential vis-a-vis the non-agricultural sector and the availability of work elsewhere in the economy. The total investment process in AFF is particularly difficult to specify behaviourally due both to the importance of investment in cattle stocks (which may be subject to substantial variation over a fairly short period) and to the complex" system of grants, subsidies and other incentives available to farmers. Con-sequently, we consider only a subset of the investment process - machinery and buildings - and use a simple flexible accelerator model which links the capital stock to output and the real cost of capital. Agricultural stock changes are left exogenous in the model.
pro-18 THE ECONOMIC AND SOCIAL RESEARCH INSTITUTE
blcms and the somewhat suspect national accounting conventions involved). The isolation of other non-marketed services is a more difficult problem and our attempts rcprescnt a very crude first effort.
Output in the marketed services sector (MS) is determined by a weighted mcasurc of final demand and by profitability. The factor demand system for capital and labour is derived by cost minimisation subject to a flexible functional form technology. This imposes a certain consistency of behaviour (perhaps unwarranted) on the MS sector and while such assumptions are perhaps unrealistic, they seem preferable to an approach based on unrelated cml)loymcnt and investment equations.
They
also permit us to make stylised comparisons between industry and marketed services.Output of the non-marketed scrviees sector (NMS), which excludes public administration, is determined by the level of NMS employment. The wage hill in NMS is determined by nominal government expenditure on goods and services (excluding public administration wages), and NMS employment is ohtaincd by dividing the wagc bill by average annual carnings in NMS (dctermincd in the income distribution block of the model). An alternative approach trcats NMS employment as a policy instrument and derives the wage bill cndogcnously in an idcntity. In tbe case of public administration otttput is actually measured in the national accounts by labour inputs with essentially no productivity or capital stock corrections. Public administration employment and investment decisions are regarded as discretionary policy
instruments.
In modelling imports we distinguish five broad economic categories: imports of investment goods (related to total invcstment)i consumption goods (related to totzd priwtte consumption); materials for further production in agriculturc (related to agricultural output); and imports of services (related to a broad measure of total activity in the economy). Imports of inter-mediate industrial goods, which constitute some 65 per cent of total imports, arc derived residually in an expenditure-output identity.
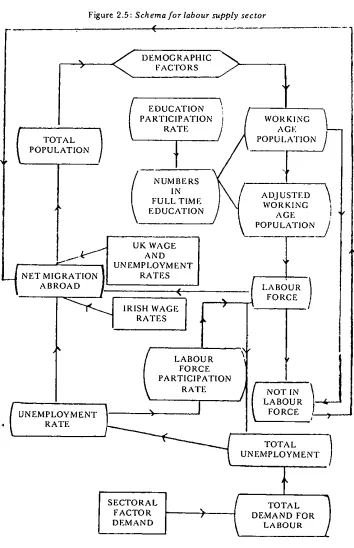
Finally, in the labour supply sector we distinguish, in an integrated (albe-it simple) schema, population growth, education participation, labour force participation and migration abroad. Unemployment is determined as the difference betwccn labour supply and labour demand (determined in the industry, agriculture and services sectors of the supply block).
Industry
THE MODELLING FRAMEWORk. 19
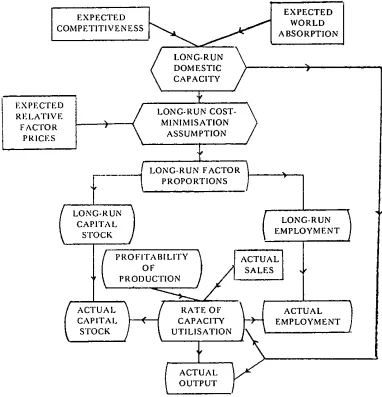
1984, Chapter 3). We provide three choices of model for the determination of capacity output. In the first (illustrated in Figure 2.2), capacity output is determined by expected world demand (elasticity 1.3) and competitive-ness as measured by Irish total unit factor costs relative to world unit labour costs (elasticity - 1.2). The generation of a trade-weighted competitor cost of capital index will certainly be considered for future work to improve our measure of competitiveness. In addition, a secular growth in capacity was
detected which could not be explained by other than a time trend (3.9 per cent per annum). In the second variant we have made the world demand elasticity parametric in the rate of change of expected domestic absorption,
thus introducing a feedback between domestic real activity and capacity outpnt. The "equilibrium" world activity elasticity falls to 1.1 while ever3, 1 per cent rise in expected domestic absorption raises this by 0.04. In the third variant we have included a geometric average of expected world and domestic activities. Such a model requires the ver3, strong assumption that variations in expected domestic activity are regarded as autonomous in the same way as for world activity. Estimation results indicated a total activity elasticity of 2.0, with a weight of 0.6 on world activity and 0.4 on domestic activity.
Even though we have included three variants of the capacity output equation, there remain many reasons for using any or all of them with caution. For example, the concentration of all industrial incentive effects into the Irish total unit factor cost measure may be quite inadequate and ignores any beneficial effects due to public funding of improved infra-structure. The trade weighting used to derive the world activity measure is by no means comprehensive or unambiguous. The fact that almost four percentage points of growth on average are not accotmted for by economic variables should serve as a warning that the equation may require further development. Some aspects of this rich agenda of research have been explored by FitzGerald (1984a) in his study of multinational investment location. In addition, the choice of capacity model is central to the overall properties of the model. In the first variant (the "pure" export-led growth model), indus-trialists perceive domestic market growth as being transient or insignificant and do not modify their capacity as a consequence. They do, however, modify their rate of capacity utilisation (see below) in response to domestic sales and profitability conditions. In the other two variants industrialists assign non-zero weights to the growth of domestic absorption. Consequently,
fiscally stimulated real growth will have a positive effect on capacity and on exporting potential which may partially offset any loss in competitiveness due to Phillips curve effects.
20 THE ECONOMIC AND SOCIAL RESEARCH INSTITUTE
Figure 2,2: Schema for industry sector
EXPECTED RFI.ATIVE FACTOR
PRICES
EXPECTED EXPECTED
WORLD COMPIVI’ITIVENESS
ABSORPTION
{
LONG-RUN CAPITAL
STOCK
LONG-RUN > DOMESTIC CAPACITY
f
LONG-RUN COST- > MINIMISATION
ASSUMPTION
t
LONG-RUN FACTOR PROPORTIONS)
..OF oyt
PRODU~// L
LONG-RUN ) EMPLOY/VlENT
(
ASg4L
ACTUAL
RA’FI; OF ~ ACTUAL
CAPITAl. CAPACITY EMPLOYMENT )
/
STOCK UTILISATION
ACTUAL OUTPUT
THE MODELLING FRAMEWORK 21
the high international mobility of industrial capital, this seems a relatively plausible assumption (McAleese, 1983). The complete system of equations derived using the well-known CES production function is given in Appendix 2. Briefly, the technology of the industry sector is characterised by its approximately Leontief nature (with an elasticity of substitution between labour and capital of 0.29) and by technical progress which is capital using and labour saving. Both constant and increasing returns to scale versions
were estimated. However, the well-known difficulties in separating technical progress and returns to scale prevented satisfactory free estimates (Berndt and Khaled, 1979; Bradley and Fanning, 1984, Chapter 4). In the model constant returns to scale (CRS) and increasing returns of 1.3 are included as options. The statistical fits are quite good given the "parsimonious" nature of the model. The large errors which arise about the time of the first OPEC
price shocks may be partially explained by the fixed exponential decay rate assumed in generating the rather artificial capital stock measures and by the putty-putty model of capital being used. However, as a first approximation the long-run factor demand mode[ may provide a useful framework on which future refinements can be made.
In the model the long-run factor demands are converted to actual factor inputs by means of a two-tier adjustment mechanism. The passage from the desired level of factor inputs to the inputs needed at long-run capacity output is assumed to be influenced by the rate of capacity utilisation in
industry. Furthermore, the passage of the actual inputs to the desired level depends on the extent to which agents can, and will, adjust their acttial behaviour towards desired levels. Combining both mechanisms leads to employment and capital demand equations which are dynamic functions of
the long-run demands and the rate of capacity utilisation. The empirical results indicate that the process of adjustment of the actual capital stock to its long-run optimal value is slightly faster than the corresponding adjustment of employment and that this adjustment is quite insensitive to variations in capacity utilisation. Labour inputs, on the other hand, proved to be very sensitive to variations in capacity utilisation.
Having determined the actual capital input, K, the gross investment flow, 1, is obtained by means of the identity which was originally used to generate the capital stock measure, i.e.,
It = Kt - (l - d)Kt.1
where d, the depreciation rate, is set at 5 per cent (Bradley and Fanning, 1984, pp. 64-65).
22 THE ECONOMIC AND SOCIAL RESEARCH INSTITUTE
production decision is represented in the model as a choice of the operating rate of capacity and is determined by the deviations of final sales from planned capacity and by the profitability of production. Since the capacity utilisation decision is essentially a short-run phenomenon, profitability is measured by the ratio of short-run costs (taken as unit labour costs) to the added value price (i.e., labour’s share of added-value), no consideration being given to the user cost of capital. The empirical results show that if sales rdative to capacity rise by I per cent then the rate of capacity utilisation rises by about 0.6 per cent. The remaining 0.4 per cent will be imported. On the other hand, a 1 per cent rise in labour’s share of added-value leads to a 0.3 per cent fall in utilisation. With capacity fixed in the short run, this will translate into a 0.3 per cent fall in actual output.
Agriculture, Forestry and Fishing
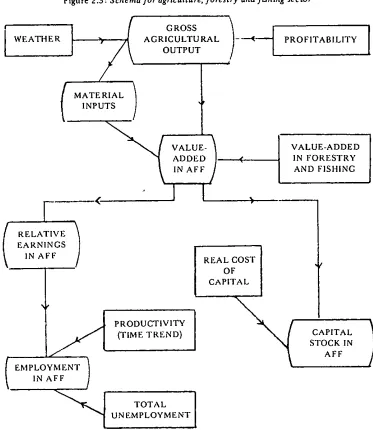
The schema for the AFF sector is shown in Figure 2.3. Our approach is I. consider agricuhure separately from forestry and fishing since the annual Census of Agricultural Production gives comprehensive details of gross ~nttput and limited information on material inputs in agriculture, the major c.mponcnt of the sector. A measure of capacity output in agriculture is defined as a five-year moving average, and actual output is made a linear fimction of capacity output, the real price of material inputs and a variable which captures weather effects. The signs of all coefficients are in accordance with a priori expectations; a fall in the real price of inputs or an improve-ment in the "weather" both lead to increased output (the real price elasticity is - 0.36 evaluated in 1975).
Attempts to specify and estimate an interrelated output and material input system failed to yield plausible empirical magnitudes. In this version of the model we explain the ratio of material inputs to gross output by a
time trend and the data indicate that this ratio has been growing steadily at about 2.7 per cent per annum. The equation residuals for the 1973-75 period are rather large, indicating the inadequacy of this simple approach. Total employment in AFF is determined by a time-trend (as a proxy for long-run labour productivity), a measure of the expected AFF/non-AFF relative earnings and the overall rate of unemployment. The empirical rcsuhs indicate employment falling at a rate of 2.9 per cent per annum, a relative earnings ratio elasticity of 0.07 per cent and a small positive sen-sitivity to the general level of unemployment. The stock of machinery and buildings is determined by output and by the real cost of capital in a simple
THE MODELLING FRAMEWORK 23
Figure 2.3 : Schema for agriculture, forestry and fLshing sector
WEATHER
t
MATERIAL ) INPUTS[
( RELATIVE /
EARNINGS IN AFFo)< j
AGRICULTURAL --"~ PROFITABILITY OUTPUT
~ VALUE ~
I
VALOEAODED
ADDED J ( IN FORESTRY
~.~
AND FISHING < " , ]
EMPLOYMENT IN AFF
PRODUCTIVITY (TIME T RI~,N D)
TOTAL UNEMPLOYMENT
REALOF COST
I
CAPITALCAPITAL / STOCK IN
AFF
absorp-24 THE ECONOMIC AND SOCIAL RESEARCH INSTITUTE
tion element is a rather stable fraction of gross output, a fact noted in a slightly different context by Kennedy and Dowling (1975, pp. 115-118). Agrlcuhural exports are derived by an identity as gross output less domestic absorption and inventory changes.
The AFF specification as discussed above is rather unsatisfactory. Given that a theoretically consistent neo-classicM framework could not be estimated empiricMly, one is reduced to explaining key variables by simple time trends. While such equations often track extremely well, they impart autonomous properties to tile sectorwhich nlay be misleading when the model is shocked.
Services
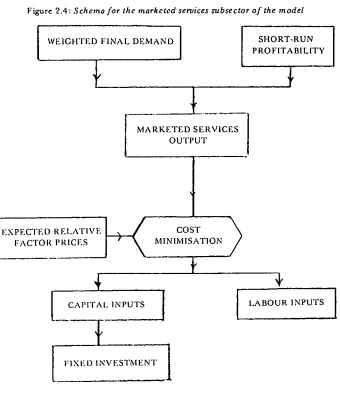
Having considered industrial and agrictdtural supply, the rest of the eco-nomy is dividcd into three broad categories of scrvices-producing subsectors. The first subscctor consists of marketcd sets, ices, an outlhae schema of which
is providcd in Figure 9.4. Output in the marketed services sector is deter-mined by a weighted measure of final demand (where the weights are taken from thc 1969 1/O table and measure the service sector output content of final dcmand) and a mcasure of profitability. Tile elasticity with respect to finM dcmand is 0.9 and with respect to profitability is 0.3. Factor inputs arc determined by assuming cost minin~isation in the production of output whcrc the technology is assumed to be of generalised Leontief form with constant returns to scale. Estimation indicated that the "technology" of the markctcd serx, iccs sector was charaetcriscd by an Allen elasticity of sub-stitution of about 0.6 and technical progress was found to be neutral with rcspcet to labour and capital saving (at a rate of some 5 per cent per annum). A simpler modcl of the non-rnarketed services sector (NMS) "~vas specified. Output is essentially detcrmined by labour inputs, corrected for a trend in
productivity. Thc wagc bill in NMS is determined by govcrnment purchases of services frorn this sector. We proxy this by the value of total government consumption expenditures net of the public administration wage bill. Hence in one wu’iant we view government as imposing a cash limit on the NMS wage bill, with actual numbers employed in NMS being detennincd as the ratio of the wage bill to avcragc annual earnings in NMS (determined in the income distribution block). A second variant takes NMS employment as a policy instrunlent.
THE MODELLING FRAMEWORK 25
Figure 2.4: Schema for the marketed services subsector of the model WEIGHTED FINAL DEMAND SHORT-RUN
PROFITABILITY
MARKETED SERVICES OUTPUT
R ’LATIV :VF,, To, \ MTI?ISATION
CAPITAL INPUTS 1
FIXI’I) INVF.STMF~NT 1
I
LABOUR INPUTS Ihnports
propen-THE ECONOMIC AND SOCIAL RESEARCH INSTITUTE
sity to import grew at a fixed rate of 4 per cent per annum and the relative domestic-import price elasticity was -0.6. Imports of agricultural raw materials were similarly treated with an imposed elasticity of unity with respect to gross agricultural output, a trend growth of 3.6 per cent and a relative price elasticity of -0.5. Finally, imports of services are determined by a broad measure of GNP with an impact elasticity of 0.4 and a long-run elasticity of 1.3.
The important category of imports of industrial goods for further produc-tion is determined residually in the expenditure-output identity. Consequently, this category of imports, constituting some 65 per cent of total imports, acts as a buffer which resolves any imbalances between domestic supply and domestic demand. An alternative approach would, of course, be to model this category of imports behaviourally and regard any resulting imbalance between supply and demand as indicating errors in the model.
Lab our
Supply
It is well established that migration abroad has played a very important role in Irish population adjustments in the past. To the extent that migration is caused by domestic economic conditions relative to economic conditions in destination countries, it is necessary to model population growth rather than include population as an exogenous variable uninfluenced by economic conditions. The schema for modelling demographic and labour supply issues is given in Figure 2.5. We consider the demographic structure in terms of three major age groupings: under 15 years; between 15 and 64 years; and over 64 years. The first and last groupings constitute the "dependent" population while the middle group constitutes the working age population. Changes in the total population are related to total migration and a "natural" population growth rate (which is assumed constant for the entire 1961-80 period). Statistical estimation yielded a "natural" growth rate of 1.1 per cent. Two similar equations are used to determine the changes in population aged under 15 and between 15 and 64. In the latter two cases the fraction of migrants in these age groups was empirically detcrmined (21 per cent and 67 per cent, respcctively). The final population grouping- those aged over 64 -- is determined as a residual to ensure "addlng-up". Clearly the model is highly simplistic and ignores the important question of inter-cohort move-ments over time. Improvemove-ments to this model would be possible but we feel they would require a complexity out of keeping with any conceivable additional accuracy obtainable.
THE MODELLING FRAMEWORK 27
Figure 2.5 : Schema for tabour supply sector
(
DEMOGRAPHIC F A C TO R S
EDUCATION PARTICIPATION
RATE
NUNIBERS IN FULL TIME EDUCATION TOTAL /
POPULATION
L
! ¯ ~
UK WAGE
t’’~r I AND
f’ r~" |1 UNEMPLOYMENT ¯ -iNET MIGRATION ]l RATFS
/ ABROAD
/.L-/
RATES /
LABOUR FORCE PARTICIPATION
RATE
1
. NEMPLO MENT ’
¯ ! RATE
WORKING
AGE L
POPUI,ATION f
"?
ADJUSTED ~ WORKING
AGE i
POPULATION /
SECTORAL
FACTOR ) DEMAND
" NOT IN \ I
LABOURt’--’r4’--\ FORCE ,~,__.J
TOTAL ) UNEMPLOYMENT
28 THE ECONOMIC AND SOC1AL RESEARCH INSTITUTE
exposed to migration (i.e., those aged between 15 and 64). The coefficient in the equation is sensitive to the relative attractiveness of working in Ireland vis-a-vis working abroad, measured by the product of the relative employ-ment probability between Ireland and the United Kingdom, and an Irish-UK relative earnings measure. Such an approach derives from the well-known Harris-Todaxo models of urban-rural migration (Harris and Todaro, 1970). Recent work by Kirwan and Nairn (1983) indicates that the position of Irish labour in Britain has been more adversely affected by the present recession than other classes of labour. For this reason, and also the exclusion of factors such as unemployment benefits and tax rates, the migration equation should
be used with caution.
It is assumed that the dependent population groups do not participate in the labour force. Furthermore, since education beyond the statutory limit of 1.5 years has become progressively more common (particularly since the extension of state funding in secondary education in 1968), an education participation rate is determined as a function of a policy dummy variable and a time trend to capture slowly changing attitudes to education. Attempts to find real wage, unemployment and other economic influences failed. In the actual model simulations this participation rate is exogenised and the equation is retained merely to facilitate future extensions. Using the education participation rate, two identities determine the population of working age which is in full-time education and an adjusted measure of working age population, i.e., the total less those in education. Labour force participation is explained in terms of a discouraged-worker model. Estimation showed that a rise of 1 per cent in the unemployment rate results in a fall of 0.015 per cent in the participation rate. Extensive investigation failed to yield any sensible wage, price or social welfare influences. Unemployment is deter-mined residually by subtracting the labour supply (deterdeter-mined above) from
the total demand for labour (determined in the industry, agriculture and services sectors). The manner in which labour demand, supply and
unemploy-ment interact with each other and with the process of wage determination is of central and crucial importance to the overall properties of the model. We take up these issues in the income distribution block below’and in the ne:~t chapter, where we examine the performance of the model as a system.
National Aggregates: Supply and Income
THE MODELLING FRAMEWORK 29
the value of OUtl)Ut produced by the three domestic sectors, adjusted for financial services. This is the total domestically earned income at factor costs. Net indirect taxes have to be added in order to value it at market prices. Gross national product is obtained by adding to GDP an estimate of net factor income from abroad.
Taking the value of GDP at factor cost as a starting point, we can follow througb the distribution of aggregate income as it is affected by fiscal redis-tribution and its disredis-tribution between labour and capital. Identities are used to determine net domestic product at factor cost, net national income, the adjustment for stock appreciation, private income, personal income, personal disposable income and real personal disposable income. Company profits are determined residually from the output-income identity in rather the same way as irnports of industrial raw materials were determined residually from the output-expenditure identity. The complex issue of what determines profit retention within the company sector is not addressed directly. Instead a sirnple linear relationship is assumed linking undistributed profits to total profits.
THE ABSORPTION BLOCK
Introductory Remarks
Our treatment of the second main block of tile model involves the deter-ruination of domestic and foreign absorption. Domestic absorption is defined as the sum of consumption expenditures (by households and government), fixed investment expenditures (by industry,agriculture and services), housing investment (by households and government), and expenditures on inventor3, investment. Foreign absorption consists of exports of goods and services.
30 THE ECONOMIC AND SOCIAL RESEARCH INSTITUTE
services. Agricultural and intervention inventory changes are left exogenous. Non-agricultural inventory changes are determined in a simple stock adjust-ment model. Concerning exports, the component of gross agricultural output which is exported abroad has already been determined in the supply block. The determination of non-agricultural exports bas been the subject of much controversy in Ireland and in the international literature. The choice of approach lies between supply driven, demand driven or hybrid models, and has been analysed in Bradley and Fanning (1984, pp. 196-202). In the model we implement both an export supply equation and a hybrid export function in order to study the robustness of our analysis to the choice of export model.
Consumption
Private consumption expenditures are detem~ined by real personal dis-posable income. The impact marginal propensity to consume was estimated as 0.42, with a long-run value of 0.62. The long-run average propensity to consume (measured in 1970) is 0.86. A data dummy variable was included in the consumption function, essentially eliminating the year ]975. Govern-mcnt consumption is composed of two elements: a wages and salaries element for public administration employees and a residu’..d element which covers other government consumption (mainly the wage bill of the non-marketed service sector).
In oesl men t
Private housing investment is determined mainly as a function of real personal disposable income. Additional explanatory variables include real housing transfers (positive effect) and a real interest rate (negative effect). The real income elasticity was estimated as 1.8. Government housing invest-ment is left as a discretionary policy variable. The remaining eleinvest-ments of total investment arc determined in the supply block. It should be noted that we do not disaggregate fixed non-housing investment into its building and non-building components. Such a disaggrcgation could be made (using unpublished CSO data) and would greatly improve the specification of the various weighted final demand variables in the model.
Exports and the Balance of Payments
THE MODELLING FRAMEWORK 31
exports in a small and open economy (Honohan, 1982), we have included stylised supply and demand interpretations. Underlying both models is the assunrption that export prices are determined on world markets. In the first variant, exports are a function of world demand (proxied by a trade-weighted GDP measure) and the profitability of exporting (the export price relative to the Irish unit labour costs). The demand elasticity is 1.03 and the profitability elasticity is 1.4. In addition, a secular export growth of 7 per cent per annum could not be accounted for by economic variables but is probably capturing such phelaomena as the progressive "opening up" of the economy to world trade and the difference between the gross mcasurc of exports and the added value measures of world activity. In the second variant the ratio of exports to industrial capacity output is deter-mined by cxport profitability (elasticity 1.13) and a secular growth (3.7 per cent pcr annum). A consequence of this formulation is that world demand has no contcmporaneons effect on exports (industrial capacity is a very sluggish function of world activity and domestic al)sorption is only indirectly affccted by world activity). In a third variant we make the stylised export supply function par;maetric in disequilibrium growth in world demand.
Within our ovcr;dl model system the controversy over export determina-tion becomes less important than the key isstle of the determinadetermina-tion of industrial capacity. In the casc whcrc industrial capacity is uninfluenced by domestic ~lbsorption (i.c., the "purc" export-led growth model), both demand ~md sut)ply export functions yield similar results. However, allowing domestic absorption to influence industrial capacity (i.e., the "generalised" export-led growth model), introduces a wedge between the supply and demand export functions. For example, hiring an extra 1,000 civil servants will boost domestic absorption and, using the gcner~ised export-led growth model, will raisc industrial cal)acity. However, the circumstances under which this would lead to increased export growth would have to be examined very critically.
National Aggregates: Demand
3 2 THE ECONOMIC AND SOCIAL RESEARCH INSTITUTE
to some average value if the historical discrepancy displays a systematic component.
THE INCOME DIS TRIB UTION BLOCK
Introductory Remarks
The third and final block of the model translates the factor based modell-ing of supply into the pattern of income distribution which results from the interaction of production and demand activities. Our usage of the term "income distribution" is a rather limited one and is taken to mean the prices and incomes accruing according to the sectoral and expenditure categories used in the model. We do not consider the important issue of the distribution of personal incomes within these sectoral categories, a question which would require considerably more detail than is available in the present model.
The basic inspiration for the determination of prices and wages comes from the Scandinavian model (Lindbeck, 1979), the details of which are briefly summarised below. We identify ourindustry sector with the "tradables" sector and the services sector with the "non-tradables" sector. In the main variant of our model, the price of tradables is determined on world markets. Wage inflation in both the tradables and the non-tradables sectors adjusts to the "room" for wage increases in the tradables sector, i.e., an increase which is consistent with a "normal" pr