New Insight into Customer Value Analysis using
Data Mining Techniques
Nesma Taher
Faculty of computers and Information, Helwan University,
Cairo, Egypt
Shaimaa Salama
1,2 1Faculty of Computers and Information, Helwan University,
Cairo, Egypt
2
Faculty of Computing and Information Technology, King Abdulaziz University, Jeddah,
Kingdom of Saudi Arabia
Doaa ElZanfaly
3,43Faculty of Informatics & Computer Science, British University in Egypt, 11873,
Cairo, ,Egypt
4
Faculty of computers and Information, Helwan University,
11795,Cairo, Egypt
ABSTRACT
Recency, Frequency, Monetary model (RFM) has been widely used to analyze the customers’ value in traditional market using three purchasing behavior attributes. This is considered one dimensional view of customers’ value that is based on profit and purchasing criteria and ignores other useful attributes. Online customers have additional attributes that when captured and analyzed can give more details about customers’ value other than provided by traditional RFM model. This gives companies better vision of their customers, and therefore serve them effectively, resulting in strong and long relationship with them. New Behavioral RFM1 Model (BRFM) is proposed in this paper to provide online retailers with a new customers' insight that reflects their web behavior beside their profitability. Three web behavioral attributes, represented in Recency of Session (Rs), Frequency of Session (Fs), and Number of clicks (NoC) are added to the traditional RFM attributes for customer value segmentation in online market using K-means clustering algorithm. The effectiveness of BRFM model is compared against the traditional RFM using Dunn index and Davies- Bouldin measures. Results show that the BRFM model enhances the clustering accuracy and reveals new customers’ clusters disregarded by the traditional RFM model.
Keywords
Customer value analysis; Recency, Frequency, Monetary Model; K-means clustering algorithm; Dunn Index (DI); Davies Bouldin (DB)
1.
INTRODUCTION
Customers are the heart of business success. Business cannot survive and get profit without maintaining loyal and satisfied customers and keep long term relationship with them [1]. Therefore, enterprises have adopted the Customer Relationship Management (CRM) strategy for managing their relationship with customers, learning more about customers' behaviors and values, and maintain profitable and strong relationship with them [2]. CRM’s success lies in using the data mining techniques to extract useful patterns that improve the enterprises understanding of their customers [3,4]. Analyzing customers’ value is a critical concept of CRM. It helps in assessing the loyalty and importance level of each customer to the enterprise, and develops more personalized
1
Behavioral RFM (BRFM): is three web behavioral attributes represented in Recency of session (Rs), Frequency of session (Fs), and Number of clicks are added to RFM model.
relationship with them to maximize their current and future value [5]. The RFM model, which stands for Recency, Frequency, and Monetary, is the most commonly used model for the customer value analysis based on three purchasing attributes represented in Recency of purchasing (R), ‘‘Last purchasing time in specific period”, Frequency of purchasing (F),” number of purchases in specific period”, and the Monetary value of purchases (M), ‘‘total amount of purchasing in specific period.’’ [6].
Analyzing Customers value based on the profit and the purchasing criteria is considered as one-dimensional view that does not guarantee customers' retention and loyalty to the enterprise. Profitable customers may turn to other competitors if they are provided with good offers, especially with the convenience of shopping online, where customers can easily shop in multiple online stores, get all information about available products, and make comparisons about prices. Furthermore, less profitable customers may be more valuable in the future if the company get richer understanding about their behavior and targets them better.
The World Wide Web, as a leading channel for conducting businesses, contains a huge amount of data about customer navigation patterns [7]. This behavioral data can be used beside the RFM purchasing attributes to provide online retailers with a rich customers’ insight that reflects their interests, stickiness, intention to future purchase and loyalty besides reflecting their profitability.
Volume 176 – No.3, October 2017
their purchasing characteristics to encourage them make purchases. As a result, companies’ revenue is increased by assigning suitable resources to right customers, and guarantee customer loyalty and retention.
Finally, the different clusters resulted from RFM and BRFM model are compared and examples of customers’ movement from cluster to cluster based on the new BRFM model are also shown. And then the accuracy of BRFM resulted clusters is compared against the traditional RFM using Dunn index and Davies Bouldin measures.
The rest of this paper is organized as follows. Section 2 presents an overview of the related works concerning customer value analysis using data mining techniques. Section 3 describes the Behavioral RFM model. Section 4 evaluates the effectiveness of BRFM model using Dunn Index and Davies Bouldin measures, and then results are discussed in section 5. Finally, Section 6 concludes this study and suggests some areas for the future work.
2.
RELATED WORK
Customer value is an important metric to measure the loyalty and importance level of each customer to the enterprise. RFM (Recency, Frequency, and Monetary) model, proposed by [6], is the most widely used model for customer value analysis. Many researchers have employed the RFM model with different data mining techniques for customer value segmentation in Brick and Mortar (physical market) and in online retailing as follows:
2.1
Customer Value Analysis in Brick and
Mortar (Physical Market)
There are many studies in literature that are concerned with analyzing the customer value in physical market using RFM model and different data mining techniques as follow. [8], used RFM model and K-means clustering algorithm to segment customers of electronic company in Taiwan into five loyalty clusters. The customer lifetime value (CLV) of resulted clusters is calculated based on the distance between the center of cluster and zero point. Then, RFM attributes (input attributes) and the resulted loyalty clusters (decision attribute) are joined into rough sets theory (the LEM2 algorithm) to enhance classification accuracy. Similar to previous study, authors in [9] segment customers of a grocery store using RFM and K-means clustering algorithms based on their value into five clusters. The study used the C5 classification algorithms on the obtained K-means clusters for predicting the loyalty of future customers based on demographic attributes. Paper [10] proposes an extension of RFM model by applying it on database containing customer transactions and three customer types (Silver, Gold, and Platinum). Customers are segmented using K-means algorithm into five groups of loyalty three repeated times according to the customers types to find customer loyalty in each type of customer.
Some authors used Weighted RFM (WRFM) instead of RFM for customer value segmentation. WRFM proposed by [11] where different weights are assigned to R, F, and M depends on characteristics of the industry. Authors in [12] and [13], use the WRFM and K-means for customer value segmentation and the customer lifetime value (CLV) of each cluster is calculated as the sum of normalized RFM multiplied by their weights. Other researchers try to develop RFM model and add some parameters to these three attributes. LRFM model and K-means are used by [14] and [15] to carry out customer value segmentation, L refer to the interval is
between the first and last exchange with a customer. These studies used L because it is supposed that customers with longer relationship are more loyal. Authors in [16] perform RFM, WRFM, and LRFM with K-means algorithm for customer value segmentation to find the golden customer by getting the top ten sold products and determine which customer belong to the golden segment in RFM, WRFM, or/and LRFM purchases one or more of these top products.
2.2
Customer Value Analysis in Online
Retailing
Paper [17] used the RFM model and K-means to segment customers of online retail business into five meaningful groups, then the study compares the resulted five clusters in term of their profitability based on the average RFM and the number of customers in each cluster. Authors in [18] used RFM attributes to define the profitable customers of small sized online shopping mall. Then three classification models are applied to classify customers into VIP or non-VIP. Finally, the study applied sequential patterns and association rules algorithms into the transactions of VIP customers only to get rules and patterns. RFM and k-means++ were used in [19] to segment customers of online sports store in Turkey into eight clusters. Then, the C4.5 classification model is used to predict the future customer value using RFM values and some demographic attributes as input attributes and the resulted clusters value as class attribute. Finally, association rule mining was applied for product recommendation. Paper [20] used weighted RFM and K- means to segment customer of electronic flower retailing company into eight clusters. Research [21] segment customers of online mobile sales website in terms of their lifetime value using WRFM model and self-organizing map. Customer lifetime value in each cluster is calculated based and clusters are categorized based on the resulted life time value in customer value pyramid.
It can be concluded that the majority of previously stated researches handled the customer value issue in brick and mortar market and in online market in term of customer profitability and purchasing behavior, which is considered as a one-dimensional view of customers’ value. This dimensional view only focuses on the profit comes from customers spend and their purchasing attitude, that does not guarantee company to get loyal customers (i.e. keep long term relationship with them). A company need to gain a new and richer insight for customers’ value, which reflects how customers are interested in the company, their stickiness to company and their intention to future purchase, besides the purchasing and profit criteria. Based on this insight, company can develop and target customers with more effective marketing strategies that maximize their future value and keep long term and profitable relationship with them.
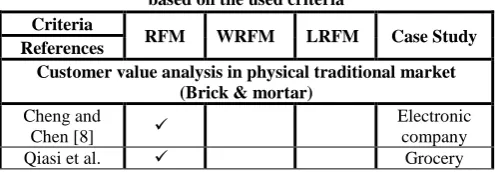
[image:2.595.305.553.679.765.2]Table 1 summarizes the previous researches that are concerned with customer value analysis in physical and online market based on the used criteria as follow:
Table 1. classification of customer value analysis studies based on the used criteria
Criteria
RFM WRFM LRFM Case Study
References
Customer value analysis in physical traditional market (Brick & mortar)
Cheng and
Chen [8]
Electronic company
[9] store Bunnak et al.
[10]
Commercial store Liu and Shih
[12]
Hardware retailing company Khajvand et
al. [13]
Health and Beauty Company Li, D et.al.
[14]
Textile business Parvaneh et
al. [15] B2B
Mesforoush and Tarokh
[16]
SME
Company
Customer value analysis on-line retailing
Chen et al.
[17]
Online retail business Shim et al.
[18]
Online shopping
mall
Birant [19] Online sport
store Tabaei and
Fathian [20]
Electronic flower retailing Ansari and
Ghalamkari [21]
Online mobile sales
website
3.
BEHAVIORAL RFM MODEL (BRFM)
This section introduces and explains the proposed Behavioral RFM (BRFM) model for analyzing the customers’ value based on their web behavior and their purchasing patterns. Three web behavioral attributes represented in Recency of session (Rs), Frequency of session (Fs), and Number of clicks (NoC) are added to the purchasing based RFM model for customer value segmentation in on-line market.
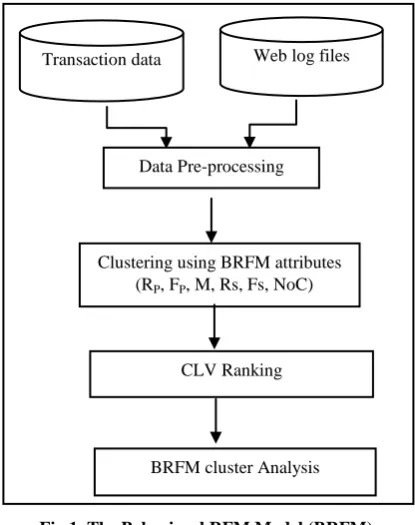
It is supposed that more recent and frequent user session and more number of clicks reflect how far customers are interesting to know about the company’s products and are intended to make future purchase, which means more customer loyalty and value. Figure 1 shows the proposed Behavioral RFM Model, where customers’ transaction data and web log data are preprocessed to get the Behavioral RFM (BRFM) attributes to be included in K-means clustering algorithm for customer value segmentation. Then the customer lifetime value (CLV) is calculated and ranks are assigned, then the resulted BRFM clusters are analyzed to understand their characteristics.
3.1
Data Pre-processing
Data in transaction data set and web log files are in unsuitable format for customer segmentation. It needs to be cleaned, and BRFM related attributes are to be extracted. Then the extracted data will be transformed into an appropriate format for the K-means clustering algorithm.The preprocessing steps of the transaction data and web log files are explained as follow:
3.1.1
Transaction Data Pre-processing
In this step, the transaction data set is cleaned and the related attributes to RFM model are selected. Then the selected attributes are transformed based on the actual value of RFM,
[image:3.595.43.292.71.396.2]as recommended in [22] for more clustering accuracy, into three attributes which are Recency (Rp): number of days since last purchasing date, Frequency (Fp): the number of purchases done by customer within a specific time frame, and Monetary (M): the total amount of sales by a customer over the whole-time frame.
Fig 1. The Behavioral RFM Model (BRFM).
3.1.2
Web Log Data Pre-processing
In this step, the web log files are cleaned by removing the records with failed HTTP status codes and records of graphics and videos, and the relevant user sessions are identified by considering specific run out time between requests which is commonly over than 30 minutes [23, 24]. Then, the web behavioral attributes in BRFM model are to be extracted from these files. These attributes are: the Recency of session (Rs) which is the number of days since last session, the Frequency of session (Fs) which is the number of sessions done by a specific user within a specific time frame, and the Number of Clicks (NoC) which is the number of requested pages by a specific user over a specific time frame. The extracted web log attributes are then combined with RFM attributes resulted from the transaction data preprocessing step to be ready for customer segmentation step. Table 2 provides an example of the preprocessed BRFM attributes.
Table 2. Preprocessed BRFM Attributes
User Name RP FP M Rs Fs NoC
Cassandra Brandow 79 2 2538 29 6 463 Denny Ordway 109 2 6696 48 6 455 Jonathan Doherty 20 5 11212 20 8 447 Arthur Prichep 77 4 9262 49 7 427
3.2
BRFM Customer Segmentation
After the preprocessing step, data is ready and suitable to be used for customer segmentation into different value segments based on their web behavior and purchasing patterns.
K-BRFM cluster Analysis CLV Ranking Clustering using BRFM attributes
(RP, FP, M, Rs, Fs, NoC)
Web log files Transaction data
[image:3.595.324.532.149.412.2]Volume 176 – No.3, October 2017
means clustering algorithm is used for customer value segmentation using the Behavioral RFM attributes (Recency of purchasing (RP), Frequency of purchasing (FP), Monetary
(M), Recency of session (Rs), Frequency of session (Fs), and Number of clicks (NoC).
In traditional RFM model, customers are segmented into eight clusters[12,19,20]. This is because there are eight possible combinations of patterns resulted from assigning one of the (upward ↑or downward↓) pattern to each one of the three RFM attributes. This assignment is based on a comparison between the average value of the RFM in clusters and the overall average value of RFM in the data set. The
characteristics of each cluster is described according to the pattern (↑or ↓) assigned to each R, F, and M attribute. In the proposed BRFM, customers are also segmented into 8 clusters as RFM model in order to evaluate the impact of adding the web behavioral attributes to RFM on the clustering accuracy when the same clustering algorithm and same number of clusters are used.
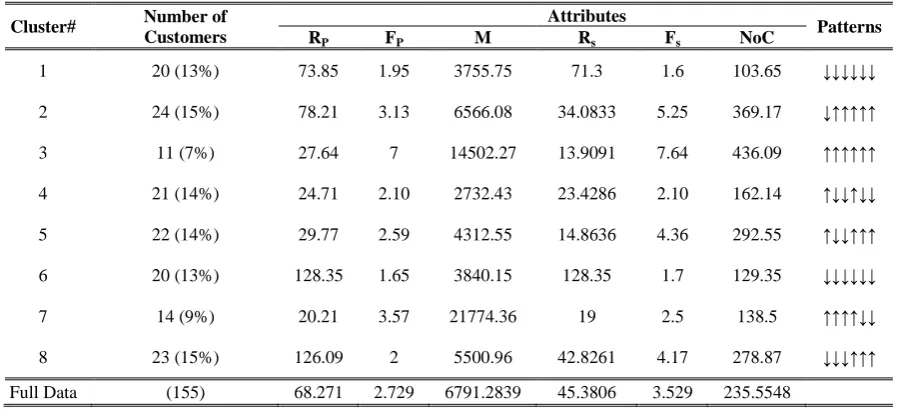
[image:4.595.73.522.234.440.2]Table 3 shows the eight customer segments resulted from using the BRFM attributes, each cluster is shown with the corresponding number of customers, the average value of Rp, Fp, M, Rs, Fs, NoC attributes, and the associate BRFM patterns that is assigned.
Table 3. Eight Resulted Clusters Using BRFM
Cluster# Number of
Customers
Attributes
Patterns
RP FP M Rs Fs NoC
1 20 (13%) 73.85 1.95 3755.75 71.3 1.6 103.65 ↓↓↓↓↓↓
2 24 (15%) 78.21 3.13 6566.08 34.0833 5.25 369.17 ↓↑↑↑↑↑
3 11 (7%) 27.64 7 14502.27 13.9091 7.64 436.09 ↑↑↑↑↑↑
4 21 (14%) 24.71 2.10 2732.43 23.4286 2.10 162.14 ↑↓↓↑↓↓
5 22 (14%) 29.77 2.59 4312.55 14.8636 4.36 292.55 ↑↓↓↑↑↑
6 20 (13%) 128.35 1.65 3840.15 128.35 1.7 129.35 ↓↓↓↓↓↓
7 14 (9%) 20.21 3.57 21774.36 19 2.5 138.5 ↑↑↑↑↓↓
8 23 (15%) 126.09 2 5500.96 42.8261 4.17 278.87 ↓↓↓↑↑↑
Full Data (155) 68.271 2.729 6791.2839 45.3806 3.529 235.5548
For Recency attributes (Rp and Rs), if the average value of Recency of cluster is lower than the overall average value of Recency in the data set, it is considered as high Recency of purchase or visit and cluster will take upward (↑) Recency pattern. When the average value of Recency exceeds the average of total Recency values in the data set, cluster will take downward (↓) Recency pattern. That because the negative relationship between the Recency (of purchase or session) and the customer value (i.e. small numbers of days since last purchase or session date means more recent behavior and consequently high customer value, and high number of days since last purchase or session date means low recency and low customer value).
For the Frequency attributes (FP and Fs), Monetary attribute
(M), and Number of user clicks attribute NoC), they have positive effect on the customer value. High frequency of purchasing and user session, high spends, and a lot of user clicks means high customers’ value and loyalty. So, if the average value of Frequency (FP and Fs), Monetary (M), and
Number of clicks (NoC) of cluster exceed the total average of Frequency (FP and Fs), the Monetary (M), and Number of
clicks (NoC) in the data set, then it considered a high FP, Fs,
M, and NoC, and upward (↑) pattern is assigned to these attributes in a cluster. In the opposite case, downward (↓) pattern is assigned for these attributes.
3.3
CLV Ranking
In this subsection, the customer life time value (CLV) of each BRFM cluster is calculated and ranks are assigned. CLV ranking is important to understand the different clusters' value
and to clarify the high loyal segment of customers and less loyal ones.
Papers [12] and [13] calculate the CLV of clusters as the total average normalized value of RFM attributes multiplied by their weights, as follow:
(1) Where CLVci is the customer life time value of cluster ci. NRci,
NFci, and NMciare the normalized value of RFM of cluster ci.
WRci, WFci, and WMci are the relative weights of RFM attributes.
The CLV of each BRFM cluster is calculated as the sum of average normalized value of Rp, Fp, M, Rs, Fs, and NoC attributes as follows, considering that all BRFM attributes have the same relative importance (i.e. WRP, WFP, WM, WRS, WFS, WNoC = 1).
(3)
Where V'A is the normalized value of A, VA is the original
value of attribute A, minA and maxA is the minimum and
maximum value of A, new_maxA and new_minA are the new
maximum and minimum value of A, and they are 0 and 1. The normalization is done to map the value of BRFM attributes to have the same scale range from 0 to 1. From previous equation, the normalized value of BRFM attributes in resulted clusters is calculated as follow:
(4)
(5)
(6)
(7)
(8)
(9)
Where NRpi, NFpi, NMi , NRsi, NFsi, and NMsiare normalized
Recency and Frequency of purchasing, normalized Monetary, normalized Recency and Frequency of session, and normalized Number of clicks of cluster i. Rpi, Fpi, Mi, Rsi,
Fsi, and NoCi refer to the average value of Rp, Fp, M Rs, Fs,
NoC of cluster i. While Rpmax , Fpmax, Mmax , Rsmax, Fsmax, NoC max, and Rpmin, Fpmin, Mmin , Rsmin, Fsmin, NoC min, represent the
largest and smallest value of Rp, Fp, M, Rs Fs, and NoC attributes of all customers data.
The Recency variables (Rp and Rs) are normalized using equations (4 and 7) because they have negative impact to CLV (the lower recency of purchasing or session the higher customer value and vice versa). Frequency attributes (Fp and Fs), Monetary, and Number of clicks are normalized using equation (5, 6, 8 and 9) because of their positive affect on CLV (the higher Frequency of purchase, Frequency of session, Monetary, and Number of clicks, the higher customer value).
Table 4 displays the average normalized value of RP, FP, M,
RS, FS, and NoC attributes of each resulted cluster, the CLV of
each resulted cluster, and the corresponding cluster Rank.
3.4
BRFM cluster Analysis
In this section, the BRFM clusters are analyzed based on their lifetime value, patterns, and characteristics associated with each cluster and then compared with the traditional RFM to identify the impact of adding the web behavioral attributes to RFM in providing marketers with new categories of customers that deliver a richer customer insight. Different to RFM Model, in which the resulted clusters reflect only the customers’ profitability, the BRFM clusters reflect customers’ interesting, stickiness, intention to future purchase, and loyalty besides reflecting their profitability. That helps marketers to better understand their customers’ behavior and
characteristics, and subsequently propose and deliver more effective target marketing.
The online retailer considered in this study is an enterprise that sells office supplements products such as book cases, tables, office furnishing, chairs, copiers and fax, telephones, papers, pens, etc. The dataset used in this study is available in [26]. The transaction data has 14 attributes: Order ID, Customer ID, User Name, Order Date, Order Quantity, Sales amount, Discount, Unit Price, Shipping Cost, Region, Product Category, Product Name, Ship Date. Part of the transaction dataset is shown in Table 5. The customers’ web log files store user clicks streams while navigating the web site and contain the following fields: date and time of log, client-ip, client-username, request type, cs-uri-stem, and HTTP status code as shown in Figure2.
The used data contains one year of transactions that is stored in excel sheet. This data contains 1429 purchases records generated from 155 customers, the web log data of those customers is also used for conducting customer value analysis based on Behavioral RFM attributes.
Figure 2. Sample of a Web Log File
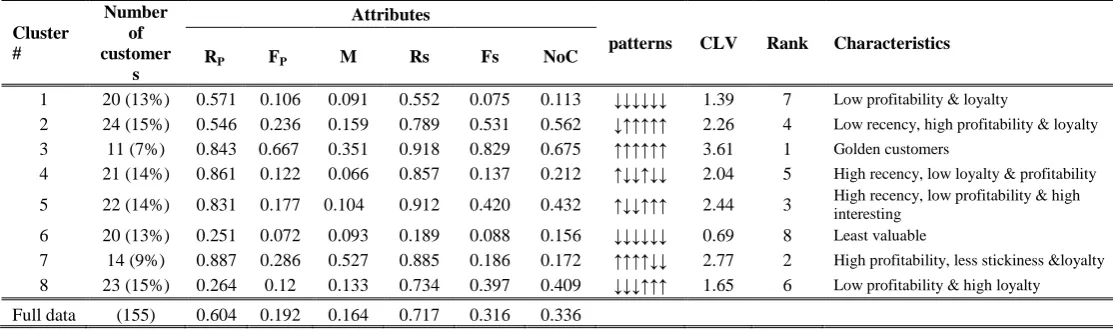
Table 6 shows eight BRFM clusters when applying the BRFM model on the described data, each cluster is presented with its lifetime value, patterns, and characteristics as follows:
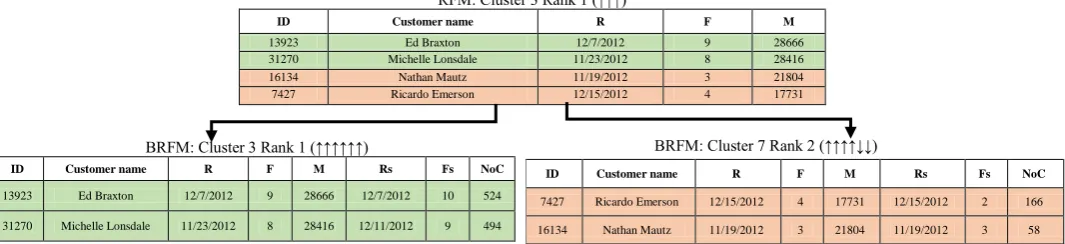
Cluster 3 Rank 1 ↑↑↑↑↑↑ (Golden customers)
This cluster has the largest CLV, it contains 7% of all customers who are considered as golden customers as they are the most profitable, loyal, and interested customers to the company. They have purchased recently and make frequent purchases with big spends. They also have visited the web site recently, and they visit the site frequently and perform a lot of clicks. This indicates high interesting, stickiness, loyalty, and value. So, this cluster should be the target that company aims to push all of its customers toward it.
Cluster 7 Rank 2 ↑↑↑↑↓↓ (High profitability, less stickiness &loyalty)
Volume 176 – No.3, October 2017
[image:6.595.23.575.249.358.2]Table 4. CLV BRFM Rank-Based
[image:6.595.17.574.398.563.2]Table 5. Part of Transaction Dataset
Table 6. The Characteristics of BRFM Resulted Clusters
Although both clusters have high profitability and same purchasing patterns, customers in this cluster have visited the web site just few times, and did not request a lot of pages to view as customers in Cluster Rank 1(↑↑↑↑↑↑), that indicate low interesting, low stickiness and willing to know about the company’s product, and low loyalty.
Figure 3 shows an example of the customers' division from cluster 3 Rank 1 (↑↑↑) using RFM model into two different new clusters with different characteristics using the BRFM. As shown in Figure 3 customers in cluster 3 rank 1 (↑↑↑) using RFM are similar to each other in their purchasing behavior, but they have different web behavior characteristics which reflect their interesting, stickiness, and loyalty to the company. So, customers are split into two different clusters using the BRFM Cluster 3 Rank 1 (↑↑↑↑↑↑) and Cluster 7 Rank 2 (↑↑↑↑↓↓), where customers in each new BRFM cluster are more similar to each other in their purchasing and in their behavioral loyalty than the previous clustering using RFM.
Cluster 5 Rank 3 ↑↓↓↑↑↑ (High purchase recency, low
profitability and high interesting)
This cluster has the third CLV rank and formed with 14% of all customers. Customers in this cluster have purchased recently, and make few number of purchases with little contribution to the company profit. Although the small purchases and spends of customers in this cluster, their web behavior indices indicate high interesting and loyalty to the company, they frequently visit the web site and make a lot of clicks which indicate high stickiness, interesting and intention for future purchases.
Cluster 2 Rank 4 ↓↑↑↑↑↑ (Low recency, high
profitability and high loyalty)
This segment takes rank 4 and contains 15 % of all customers. Customers of this cluster are profitable and loyal but they didn't make purchases recently.
Cluster#
Number of customers
Attributes
CLV Rank
Rp Fp M Rs Fs NoC
1 20 (13%) 0.5715 0.1056 0.0906 0.5522 0.075 0.1128 0.5715 7 2 24 (15%) 0.5458 0.2361 0.1587 0.7893 0.5313 0.5620 2.8233 4 3 11 (7%) 0.8433 0.6667 0.3512 0.9178 0.8296 0.6753 4.2837 1 4 21 (14%) 0.8605 0.1217 0.0658 0.8571 0.1369 0.2117 2.2538 5 5 22 (14%) 0.8307 0.1768 0.1041 0.9117 0.4205 0.4324 2.8762 3 6 20 (13%) 0.2509 0.0722 0.0926 0.1889 0.0875 0.1563 0.8484 8 7 14 (9%) 0.8870 .2857 .5275 .88535 .1875 .1717 2.9448 2 8 23 (15%) 0.2642 0.12 0.1329 0.7336 0.3967 0.4093 2.0567 6
Order ID
Customer
ID User Name
Order Date
Order Quantity
Sales
amount Discount Unit Price
Shipping Cost
Product
Category Product Name Ship Date
37218 21 Frank Merwin 12/19/2012
01:09:30 23 153.02 USD 0.08 6.48 USD 5.82 USD Office Supplies Xerox 1998 12/20/2010
50307 40 Bill Overfelt 10/15/2012
12:18:30 31 542.01 USD 0.06 17.48 USD 1.99 USD Technology
Maxell Pro 80 Minute
CD-R, 10/Pack 10/15/2010
57314 51 Patrick O'Brill 10/12/2012
07:10:01 26 2238.5 USD 0 85.99 USD 2.79 USD Technology 6340 10/19/2010
27232 60 Ralph Arnett 8/18/2012
06:05:12 19 671.59 USD 0.05 34.99 USD 7.73 USD Office Supplies
Hunt Boston® Vacuum Mount KS Pencil Sharpener
8/20/2010
22820 77 Craig Yedwab 8/17/2010
14:09:20 18 144.84 USD 0 7.89 USD 2.82 USD Office Supplies
Staples Vinyl Coated
Paper Clips, 800/Box 8/20/2010
Cluster #
Number of customer
s
Attributes
patterns CLV Rank Characteristics
RP FP M Rs Fs NoC
1 20 (13%) 0.571 0.106 0.091 0.552 0.075 0.113 ↓↓↓↓↓↓ 1.39 7 Low profitability & loyalty
2 24 (15%) 0.546 0.236 0.159 0.789 0.531 0.562 ↓↑↑↑↑↑ 2.26 4 Low recency, high profitability & loyalty
3 11 (7%) 0.843 0.667 0.351 0.918 0.829 0.675 ↑↑↑↑↑↑ 3.61 1 Golden customers
4 21 (14%) 0.861 0.122 0.066 0.857 0.137 0.212 ↑↓↓↑↓↓ 2.04 5 High recency, low loyalty & profitability
5 22 (14%) 0.831 0.177 0.104 0.912 0.420 0.432 ↑↓↓↑↑↑ 2.44 3 High recency, low profitability & high interesting 6 20 (13%) 0.251 0.072 0.093 0.189 0.088 0.156 ↓↓↓↓↓↓ 0.69 8 Least valuable
7 14 (9%) 0.887 0.286 0.527 0.885 0.186 0.172 ↑↑↑↑↓↓ 2.77 2 High profitability, less stickiness &loyalty
8 23 (15%) 0.264 0.12 0.133 0.734 0.397 0.409 ↓↓↓↑↑↑ 1.65 6 Low profitability & high loyalty
Comparing with the traditional RFM which consider those customers are churned to competitors, using the web behavioral attributes reveal that they are still visiting the web site and still interested in the company which indicate an
intention to make future purchase. On another side, web behavior data may insure the idea that customers are churned to competitors if the web behavior patterns show that customers didn't visit web site recently and frequently.
RFM: Cluster 3 Rank 1 (↑↑↑)
ID Customer name R F M
13923 Ed Braxton 12/7/2012 9 28666
31270 Michelle Lonsdale 11/23/2012 8 28416
16134 Nathan Mautz 11/19/2012 3 21804
7427 Ricardo Emerson 12/15/2012 4 17731
BRFM: Cluster 3 Rank 1 (↑↑↑↑↑↑)
ID Customer name R F M Rs Fs NoC
13923 Ed Braxton 12/7/2012 9 28666 12/7/2012 10 524
31270 Michelle Lonsdale 11/23/2012 8 28416 12/11/2012 9 494
BRFM: Cluster 7 Rank 2 (↑↑↑↑↓↓)
ID Customer name R F M Rs Fs NoC
7427 Ricardo Emerson 12/15/2012 4 17731 12/15/2012 2 166
[image:7.595.31.564.135.257.2]16134 Nathan Mautz 11/19/2012 3 21804 11/19/2012 3 58
Fig 3: Split of customers in same cluster using RFM in two different clusters with different characteristics using BRFM
Cluster 4 Rank 5 ↑↓↓↑↓↓ (High purchase recency, low
profitability and low loyalty)
This cluster Takes rank 5 with 14% of all customers. Compared to traditional RFM model, which considers customers in this cluster as cluster having the same value as customers in cluster 5 rank 3 (↑↓↓↑↑↑) based on their profitability and purchasing patterns. BRFM attributes distinguish customer in this cluster from cluster 5 rank 3 (↑↓↓↑↑↑). Customers in this cluster are less loyal than customers in cluster 5 Rank 3 (↑↓↓↑↑↑). They visit the web site just few times and react to the website with few number of clicks which mean lower interesting and loyalty to the company.
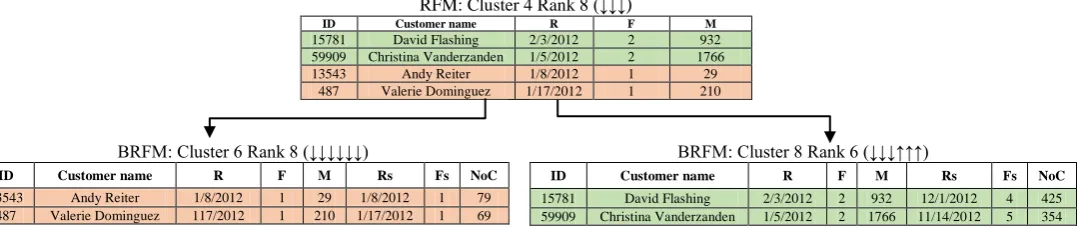
Cluster 8 Rank 6 ↓↓↓↑↑↑ (Low profitability and high loyalty)
Customers in this cluster have low profitability and purchasing patterns and high behavioral loyalty. They visit the web site recently, frequently and do a lot of clicks. Traditional RFM considers customers who have low RFM patterns (↓↓↓) are lost and no effort should be taken with them.
According to RFM approach, customers of this cluster have the same value as customers in both cluster 1 ranked with 7 (↓↓↓↓↓↓) and cluster 6 ranked with 8 (↓↓↓↓↓↓), that because all have the same low purchasing pattern. BRFM Model differentiates customers of this cluster from customers in cluster 1 ranked with 7 (↓↓↓↓↓↓) and cluster 6 rank with 8 (↓↓↓↓↓↓). Although all of these clusters have low profitability purchasing patterns, customers in this cluster are highly interested in the company and they have high web behavior loyalty. So, they shouldn’t be treated as customers in cluster 1 ranked with 7 (↓↓↓↓↓↓) and cluster 6 ranked with 8 (↓↓↓↓↓↓) who have low profitability and low web behavior patterns. Figure 4 shows the split of customers who were clustered in cluster 4 rank 8 with pattern (↓↓↓) using the RFM to two different clusters with different characteristics and different value using BRFM.
As shown in Figure 4, customers in cluster 4 rank 8 (↓↓↓) using RFM model have low value and low purchasing pattern. Using the BRFM model divide customers in this cluster into two different clusters with different web behavioral characteristics. Customers in each new cluster (cluster 6 rank 8 (↓↓↓↓↓↓) and cluster 8 rank 6 (↓↓↓↑↑↑)) are more similar to each other in their purchasing and their web behavioral patterns.
Cluster 1 Rank 7 ↓↓↓↓↓↓ (Low profitability and Low loyalty)
Customers in this segment have low purchasing indices and low behavioral loyalty, they didn't purchase recently, make few purchases, and their spending is low. Moreover, they rarely visit the web site and make few clicks. So, this segment is considered unprofitable and disloyal. Different to the previous cluster 8 rank 6 (↓↓↓↑↑↑), customers in this cluster are less valuable because they have low web behavioral patterns.
Cluster 6 Rank 8 ↓↓↓↓↓↓ (The least valuable)
This cluster has the least value rank and contain 13% of all customers. Customers in this cluster have same pattern as cluster 1 rank 7 (↓↓↓↓↓↓), they didn’t purchase recently, make few purchases, and their spending is low, also they rarely visit the web site and make few clicks, so they are considered unprofitable, not interested in the company. But they have lower average value in Rp, Fp, and Rs attributes than cluster 1 rank 7 (↓↓↓↓↓↓) as shown in Table 6, so this cluster takes rank eight.
After this analysis, we can conclude that using the BRFM model and adding the Rs, Fs, and NoC attributes to RFM model can reveal new categories of customers that are not shown using traditional RFM as follow:
1) Customers who may still be interested in companies’ products and loyal to it even if they didn’t make recent purchase.
2) Low profitable customers who are very interesting in the company’s product, and willing to know more about its’ products, which indicate high probability of future purchases.
3) Low profitable customers who are rarely visit the website, not interested in the company, and disloyal. 4) Profitable customers who purchased a lot but not
frequent visitors and do not view a lot of web site pages, which indicate lower interesting, loyalty and stickiness than customers in the following next category,
5) Profitable customers who are very loyal, sticking and interested in the company.
Volume 176 – No.3, October 2017
Fig 4: Customers’ transition from cluster 4 rank 8 (↓↓↓) using RFM into cluster 6 rank 8 (↓↓↓↓↓↓) and cluster 8 rank 6 (↓↓↓↑↑↑) using BRFM.
4.
BRFM EVALUATION
To evaluate the effectiveness of Behavioral RFM model over the traditional RFM model, we applied the traditional RFM model for customer segmentation using K-means clustering algorithm. The effectiveness of BRFM model is tested using Dunn index and Davies Bouldin to test the validity and accuracy of the customer segmentation using the BRFM Model in comparison with the RFM Model.
4.1
Dunn Index Evaluation
Dunn Index is one of the clustering validity measures that aims to evaluate the accuracy and validity of the resulted clusters based on the intra-cluster and inter-cluster distance measures [27, 28, 29].
Several Dunn index equations are found in literature. These equations are different in defining the inter-cluster and intra-cluster distance, and in placing the intra and inter-intra-cluster distance in the denominator and numerator of equation. In this section, three methods to calculate the Dunn Index are used to evaluate the accuracy and validity of clustering results based on RFM and BRFM and to verify the results.
A. First Method to Calculate Dunn Index:
This method is the most popular to calculate Dunn index as provided in (27, 28, 29, 30). This method defines Dunn Index as the ratio of the smallest distance between two observations that are not in the same cluster to the largest intra-cluster distance between observations in the same clusters as shown in equation (10).
(10) Where:
= (11) = (12)
Where D is Dunn index. nc refer to number of clusters. d is
distance based on Euclidian distance, d (ci, cj) refer to the
minimum inter distance between two clusters by measuring the distance between their closest points. (Diam (ck)) refer to
the maximum intra cluster distance. d (x, y) refer to distance between two data elements in same cluster.
The best clustering method that maximizes the inter-cluster distance (the numerator in this method) while minimizing the intra-cluster distance (the denominator in this method). So, the larger Dunn Index value means more after accurate cluster segmentation.
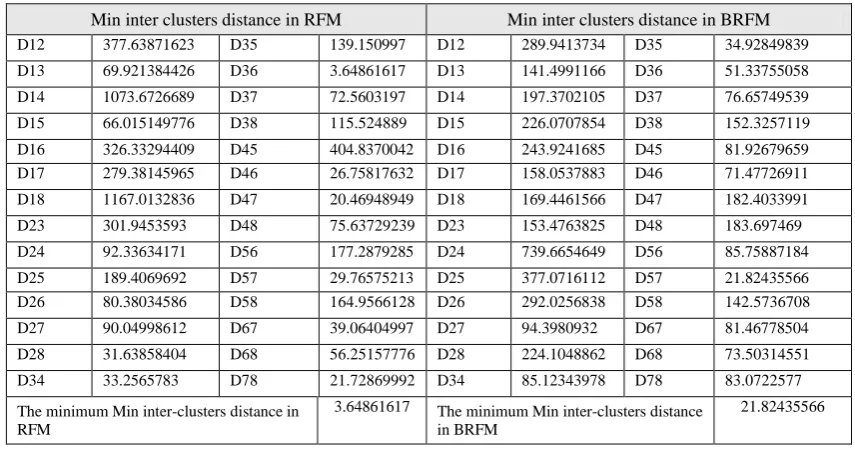
The minimum distance between two customers in different clusters (inter-cluster distance) in RFM and BRFM is shown in Table 7, and the maximum distance between customers in same cluster (intra-cluster distance) in RFM and BRFM method is provided in Table 8.
As shown in Table 7, the maximum intra-cluster distance between customers in same cluster using RFM attributes is 34830, and the maximum intra-cluster distance between customers in same cluster using BRFM attributes is 30524. The Behavioral RFM minimize the maximum intra cluster distance between customers in same cluster than RFM. In Table 8, minimum inter cluster distance in RFM is 3.648616176 and the minimum inter cluster distance in BRFM is 21.52436, which means that the BRFM maximize the minimum inter distance between clusters than using RFM attributes.
After getting the minimum inter-cluster distance in RFM and BRFM as shown in Table 7 and the maximum intra- cluster distance in RFM and BRFM as shown in Table 8, we calculate the Dunn Index for RFM and BRFM as follows: Dunn Index in RFM= 3.648616176
3483 = 0.0001
Dunn Index in BRFM= 21.82436
3 524.13 = .001
Based on the previous two equations, the Dunn Index of RFM is 0.0001 and .001 for BRFM. The larger value of Dunn Index achieved by using the BRFM attributes in customer segmentation, which means that using BRFM attributes in customer segmentation lead to better clustering accuracy which increase the intra cluster compactness and inter-cluster separation than using the RFM.
B. The Second Method to Calculate Dunn Index
The second equation of Dunn Index is provided in [13]. This method is similar to the first method in the formation of Dunn Index equation. It is the ratio of minimum inter-cluster distance to maximum intra-cluster distance, but the difference is in the definition of inter-cluster and intra-cluster distance. In this method, the minimum inter-cluster distance is the minimum distance between the mean of two clusters rather than the minimum distance between elements in two clusters. The maximum intra-cluster distance is calculated as the maximum distance between observations and their cluster center rather than the distance between observations in same cluster.
RFM: Cluster 4 Rank 8 (↓↓↓)
ID Customer name R F M
15781 David Flashing 2/3/2012 2 932
59909 Christina Vanderzanden 1/5/2012 2 1766
13543 Andy Reiter 1/8/2012 1 29
487 Valerie Dominguez 1/17/2012 1 210
BRFM: Cluster 6 Rank 8 (↓↓↓↓↓↓)
ID Customer name R F M Rs Fs NoC
13543 Andy Reiter 1/8/2012 1 29 1/8/2012 1 79
487 Valerie Dominguez 117/2012 1 210 1/17/2012 1 69
BRFM: Cluster 8 Rank 6 (↓↓↓↑↑↑)
ID Customer name R F M Rs Fs NoC
15781 David Flashing 2/3/2012 2 932 12/1/2012 4 425
Table 7. The Minimum Inter Cluster Distance in RFM and BRFM Using Dunn 1st Method.
Min inter clusters distance in RFM Min inter clusters distance in BRFM
D12 377.63871623 D35 139.150997 D12 289.9413734 D35 34.92849839
D13 69.921384426 D36 3.64861617 D13 141.4991166 D36 51.33755058
D14 1073.6726689 D37 72.5603197 D14 197.3702105 D37 76.65749539
D15 66.015149776 D38 115.524889 D15 226.0707854 D38 152.3257119
D16 326.33294409 D45 404.8370042 D16 243.9241685 D45 81.92679659
D17 279.38145965 D46 26.75817632 D17 158.0537883 D46 71.47726911
D18 1167.0132836 D47 20.46948949 D18 169.4461566 D47 182.4033991
D23 301.9453593 D48 75.63729239 D23 153.4763825 D48 183.697469
D24 92.33634171 D56 177.2879285 D24 739.6654649 D56 85.75887184
D25 189.4069692 D57 29.76575213 D25 377.0716112 D57 21.82435566
D26 80.38034586 D58 164.9566128 D26 292.0256838 D58 142.5736708
D27 90.04998612 D67 39.06404997 D27 94.3980932 D67 81.46778504
D28 31.63858404 D68 56.25157776 D28 224.1048862 D68 73.50314551
D34 33.2565783 D78 21.72869992 D34 85.12343978 D78 83.0722577
The minimum Min inter-clusters distance in RFM
3.64861617 The minimum Min inter-clusters distance in BRFM
21.82435566
Table 8. The Maximum Intra Cluster Distance in RFM
and BRFM Using Dunn 1st Method
The max intra cluster distance in RFM
The max intra cluster distance in BRFM
D1 34830 D1 25723.26
D2 18795.02 D2 30524.13
D3 11256.01 D3 11268.74
D4 8464.005 D4 15571.16
D5 16272.64 D5 10788.75
D6 7119.2 D6 23430.61
D7 7286.43 D7 18853.39
D8 9391.12 D8 21120.61
Max intra Dist 34830.00352 Max intra Dist 30524.13
(13) = ) (14) (ci = (15)
Where (Ci, Cj) is the inter distance between clusters, (Ci )
is the intra-cluster distance of cluster Ci, and k refers to the
total number of clusters, are the center of cluster Ci and
Cj. Similar to previous method, the larger Dunn index value
means more accurate clustering result.
The minimum inter-cluster distance between the centroid of two clusters in RFM and BRFM is shown in Table 9, and the maximum intra-cluster distance between observations and the centroid of same cluster in RFM and BRFM is provided in Table 10.
According to Table 9, the minimum inter cluster distance in RFM is 46.51 and the minimum inter cluster distance in BRFM is 118.3, which means that BRFM maximize the minimum inter distance between clusters more than using RFM as the previous method.
The maximum intra-cluster distance between the observations in a cluster and the centroid of this cluster as shown in Table 10 is 22068.87 using RFM, and 19488.66 using BRFM. So, the BRFM minimize the maximum intra cluster distance than using the RFM attributes. Based on the minimum inter-cluster distance in RFM and BRFM as shown in Table 9, and the maximum intra- cluster distance in RFM and BRFM as shown in Table 10. The Dunn Index for RFM and BRFM approach is calculated as follows:
Dunn Index in RFM= 46.51
22 68.87 8 = .002
Dunn Index in BRFM= 118.36
1 488.66 = .006
Dunn Index of RFM is 0.002 and .006 for BRFM. The Dunn Index value is larger in BRFM than RFM, which means that BRFM increases the validity and accuracy of the clustering results than RFM.
C.The Third Method to Calculate Dunn Index
The third equation of Dunn Index is provided in [16]. This method is different than previous two methods in the formation of Dunn index equation. The numerator of Dunn index equation in this method is the intra- cluster distance and the denominator is the inter-cluster distance.
Similar to the second method of Dunn index, the inter cluster distance is calculated as the distance between the means of two clusters, and the intra cluster distance is calculate as the distance between mean of the cluster and other objects in the same cluster.
i ≠j and 1≤ i, j ≤k (16)
[image:9.595.43.291.349.557.2]Volume 176 – No.3, October 2017
Table 9. The Minimum Inter Cluster Distance in RFM and BRFM Using Dunn 2nd Method.
Min inter clusters distance in RFM Min inter clusters distance in BRFM
D12 8281.060102 D35 8748.82 D12 7278.18 D35 1585.52
D13 14941.43444 D36 2251.94 D13 10190.74 D36 1192.71
D14 15628.85951 D37 2263.72 D14 7936.66 D37 592.32
D15 6193.286901 D38 2250.81 D15 11773.04 D38 521.91
D16 17193.14511 D45 9435.98 D16 9003.28 D45 3839.63
D17 17203.81896 D46 1564.30 D17 10751.92 D46 1070.06
D18 17189.11 D47 1575.45 D18 10667.63 D47 2823.10
D23 6662.19 D48 1562.38 D23 17462.49 D48 2738.55
D24 7348.98 D56 11000.28 D24 15210.14 D56 2772.91
D25 2087.87 D57 11010.73 D25 19041.94 D57 1027.28
D26 8913.23 D58 10995.90 D26 16274.37 D58 1117.98
D27 8923.43 D67 50.00 D27 18018.80 D67 1754.99
D28 8908.40 D68 93.03 D28 17934.87 D68 1669.72
D34 688.43 D78 46.51 D34 2255.44 D78 118.36
The minimum Min inter clusters distance in RFM 46.51 The minimum Min inter clusters distance in BRFM 118.36
Table 10. The Maximum Intra-cluster Distance in RFM
and BRFM Using Dunn 2nd Method
The max intra cluster distance in RFM
The max intra cluster distance in BRFM
D1 22068.87098 D1 14164.00
D2 10235.21943 D2 19488.66
D3 7191.315251 D3 7131.47
D4 6100.706447 D4 9571.14
D5 10580.51202 D5 8074.73
D6 5137.361559 D6 18081.13
D7 5339.566051 D7 15141.25
D8 7414.399603 D8 17308.94
Max intra
Dist 22068.87
Max
intra Dist 19488.66 The clustering which has minimum of the maximum Dunn index is chosen as the best clustering.
The maximum Dunn Index of RFM is 159.411 and 146.24 for BRFM. Based on this method, the minimum of maximum Dunn index value is obtained using the BRFM. As a result, BRFM model leads to more accurate clustering results than RFM.
4.2
Davies-Bouldin Evaluation
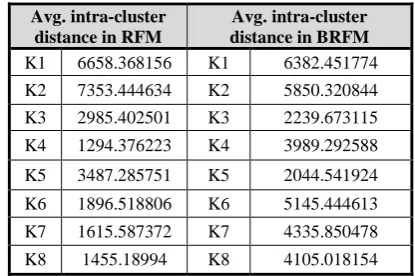
The proposed BRFM model is further evaluated in comparison with RFM model using Davies-Bouldin measure. Davies-Bouldin is one of the clustering validity measures based on the intra-cluster and inter-cluster distance measures to identify clusters which are compact and well separated (Davies & Bouldin, 1979; 27).
(17)
Where K is the number of clusters, diam (ci) is the average
distance of all patterns in cluster i to their cluster center ci, diam (cj) is the average distance of all patterns in cluster j to
their cluster center cj , and dist (ci, cj) is the distance of cluster
[image:10.595.62.272.293.450.2]centers ci and cj . Small values of Davies-Bouldin means more compact and well separated clusters. Table 11 shows the average intra-cluster distance in each cluster using RFM and BRFM, and the inter-cluster distances between the center of clusters in RFM and BRFM is the same as values supported in Table 9.
Table 11. Average Intra Cluster Distance in RFM and BRFM using Davies-Bouldin
Avg. intra-cluster distance in RFM
Avg. intra-cluster distance in BRFM
K1 6658.368156 K1 6382.451774 K2 7353.444634 K2 5850.320844 K3 2985.402501 K3 2239.673115 K4 1294.376223 K4 3989.292588 K5 3487.285751 K5 2044.541924 K6 1896.518806 K6 5145.444613 K7 1615.587372 K7 4335.850478 K8 1455.18994 K8 4105.018154
After getting the average intra cluster distance in each cluster and the inter-cluster distances between clusters in RFM and BRFM, the Davies-Bouldin measure is calculated for RFM and BRFM based on equation (17). Davies-Bouldin in RFM is 51.91and 22.67 in BRFM. The BRFM Model minimizes the intra cluster distance and maximizes the inter distance between clusters, and result in more accurate and compact clusters that are well separated than RFM model.
5.
RESULTS DISCUSSION
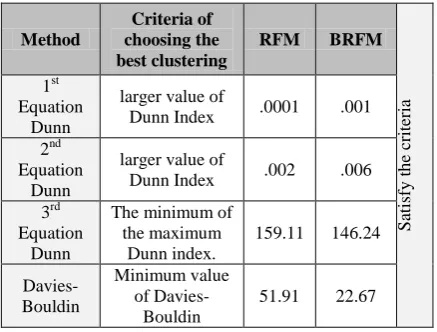
The accuracy and validity of the clustering results based on RFM attributes and the Behavioral RFM attributes is tested based on Dunn index and Davies Bouldin measure. Table 12 summarizes the results of evaluating the accuracy and validity of clustering results in RFFM and BRFM using three different methods to calculate the Dunn Index measure and Davies Bouldin measure.
[image:10.595.323.531.296.434.2]Table 12. Summary of Dunn Index Evaluation Results
Method
Criteria of choosing the best clustering
RFM BRFM
S
ati
sfy
t
h
e
crit
eria
1st Equation
Dunn
larger value of
Dunn Index .0001 .001 2nd
Equation Dunn
larger value of
Dunn Index .002 .006 3rd
Equation Dunn
The minimum of the maximum
Dunn index.
159.11 146.24
Davies-Bouldin
Minimum value of
Davies-Bouldin
51.91 22.67
In Davies-Bouldin measure, the more accurate clustering result is that minimizes the value of Davies-Bouldin. The value of Davies-Bouldin in BRFM is 22.67 and it is smaller than the value of Davies-Bouldin in RFM which is 51.91. It can be concluded that adding the three web behavioral attributes represented in the Recency of session, Frequency of session, and Number of clicks to the traditional RFM attributes enhances the validity and accuracy of customer value segmentation than using the RFM. Using BRFM attributes result in more intra-cluster compactness and well inter-cluster separation than RFM, where customers in the same cluster are more similar to each other and more separate from customers in other clusters.
6.
CONCLUSION AND FUTURE WORK
In this paper, a new model called Behavioral RFM (BRFM) is proposed for providing richer customer insight and enhanced view of customers in online market, where three web behavioral attributes represented in Recency of session (Rs), Frequency of session (Fs), and Number of clicks (NoC) are added to the traditional purchasing RFM attributes for customer segmentation, and then the value of customers in the BRFM resulted clusters are calculated.
BRFM resulted clusters are analyzed to understand the characteristics of each cluster, and then they are compared to the traditional RFM model. While RFM clusters reflect customers’ purchasing patterns and their profitability, the BRFM clusters provide marketers with a rich customer insight that reflects customers’ interests, stickiness, intention to future purchase and loyalty besides reflecting their profitability. This is done through presenting new categories of customers are not shown using traditional RFM. These new categories are illustrated in how recently the customers visit the web site, and number of their visits and browsing behavior, besides their purchasing and spend behavior. These new customer clusters help marketers to better understand their customers’ behavior and value to put more effective marketing strategies, and develop long-term profitable relationship with them The effectiveness of the proposed BRFM model is evaluated against the RFM model using Dunn index and Davies Bouldin measure to test the validity and accuracy of the customer segmentation. Results show that the BRFM model results in more accurate clustering that maximizes the intra cluster compactness and the inter cluster separation than RFM model. For future work, other web behavioral attributes may be added to the Behavioral RFM model is such as date of registration,
duration of session, and number of customer complaints which may enhance the accuracy of customer segmentation. Moreover, this study provides marketers with richer insight into their customers' value and characteristics concerning their web behavior and their profitability. Proposing and delivering the most suitable marketing strategies for customers based on the characteristics of the cluster they belong to is also considered a future work to maximize customers' value and loyalty to the company.
7.
REFERENCES
[1] Tsiptsis, K., & Chorianopoulos, A., (2009). Data Mining Techniques in CRM: Inside Customer segmentation, first ed. Wiley Publishing Inc., United Kingdom.
[2] Kim, M., Eun Park, J., Dubinsky, A. J., & Chaiy, S., (2012). Frequency of CRM implementation activities: a customer-centric view. Journal of Services Marketing Journal of Services Marketing. 26 (2), 83 - 93.
[3] Berry, M., & Linoff, G., (2004). Data Mining Techniques for Marketing, Sales, and Customer Relationship Management, second ed. Wiley Publishing Inc., United Kingdom.
[4] Ngai, E., Xiu, L., & Chau, D., 2009. Application of data mining techniques in customer relationship management. Expert Systems with Applications. 36 (2), 2592-2602. [5] Kumar, V., & Reinartz, W., (2012). Strategic Customer
Relationship Management Today, In: Kumar, V., Reinartz, W. (Eds.), Customer Relationship Management. Springer, Berlin, pp. 3-20.
[6] Hughes, A., 1994. Strategic database marketing, first ed. Probus Publishing Company Inc., Chicago.
[7] Facca, F., M., & Lanzi, P., L., (2005). Mining interesting knowledge from weblogs: a survey. Data & Knowledge Engineering. 53 (3), 225-241.
[8] Cheng, C., & Chen, Y., (2008). Classifying the segmentation of customer value via RFM model and RS theory. Expert Systems with Applications. 36 (3), 4176-4184.
[9] Qiasi, R., baqeri-Dehnavi, M., Minaei-Bidgoli, B., & Amooee, G., (2012). Developing a model for measuring customer’s loyalty and value with RFM technique and clustering algorithms. Journal of Mathematics and Computer Science. 4 (2), 172-181.
[10] Bunnak, P., Thammaboosadee, S., & Kiattisin, S., (2015). Applying Data Mining Techniques and Extended RFM Model in Customer Loyalty Measurement. Journal of Advances in Information Technology. 6 (4), 238-248. [11] Stone, B., & Jacobs, R., (1995). Successful direct
marketing methods, fifth ed. NTC Business Books, Chicago.
[12] Liu, D., & Shih, Y., (2005). Hybrid approaches to product recommendation based on customer lifetime value and purchase preferences. Journal of Systems and Software. 77 (2), 181-191.
Volume 176 – No.3, October 2017
[14] Li, D., Dai, W., & Tseng, W., (2011). A two-stage clustering method to analyze customer characteristics to build discriminative customer management: A case of textile manufacturing business. Expert Systems with Applications. 38 (6), 7186-7191.
[15] Parvaneh, A., Abbasimehr, H., &Tarokhc, M., (2012). Integrating AHP and Data Mining for Effective Retailer Segmentation Based on Retailer Lifetime Value. Journal of Institutional Economics. 5 (11) 25-31.
[16] Mesforoush, A., & Tarokh, M.J., (2013). Customer Profitability Segmentation for SMEs Case Study: Network Equipment Company. International Journal of Research in Engineering and Technology. 2 (1), 30-44. [17] Chen, D., Sain, S., & Guo, K., (2012). Data mining for
the online retail industry: A case study of RFM model-based customer segmentation using data mining. Journal of Database Marketing & Customer Strategy Management. 19 (3), 197-208.
[18] Shim, B., Keunho Choi, K., & Yongmoo Suh, Y., (2012). CRM strategies for a small-sized online shopping mall based on association rules and sequential patterns. Expert Systems with Applications. 39 (9), 7736- 7742.
[19] Birant, D., (2011). Knowledge-Oriented Applications in Data Mining, In: Funatsu, K. (Eds.), Data Mining Using RFM Analysis. INTECH publisher, Croatia, PP. 91-108. [20] Tabaei, Z., & Fathian, M. (24-26 Oct. 2011). Developing
W-RFM Model for Customer Value: An Electronic Retailing Case Study. In The 3rd International Conference on Data Mining and Intelligent Information Technology Applications. The Westin Resort Coloane, Macao.
[21] Ansari, A., & Ghalamkari, S., (2014). Segmenting Online Customers Based on their Lifetime Value and RFM Model by Data Mining Techniques. International Journal of Information Science and Management, 70-82.
[22] Taher, N., Elzanfaly, D., & Salama, S. (2 16) ‘b’. Investigation in customer value segmentation quality under different preprocessing types of RFM attributes.
International Journal of Recent Contributions from Engineering, Science & IT. 4 (4), 5-10.
[23] Prasad G.S., Reddy N.V.S., & Acharya U.D., (2010). Knowledge Discovery from Web Usage Data: A Survey of Web Usage Pre-processing Techniques, In: Das V.V. et al. (Eds.), Information Processing and Management. Communications in Computer and Information Science. Springer Heidelberg, Berlin, pp. 505-507.
[24] Srivastava, J., Cooley, R., Deshpande, M., & Tan, P.N., (2000). Web usage mining: discovery and applications of usage patterns from Web data. SIGKDD Explorations Newsletter.1 (2), 12-23.
[25] Han, J., Kamber, M., & Pei, J., (2011). Data Mining: Concepts and Techniques, thirded. Morgan Kaufmann Publishers, Burlington, Massachusetts.
[26] [Dataset] Martin, M., (2012). Sample - Superstore Sales. Tableau, v1. https://community.tableau.com.
[27] Ansari, Z., Azeem, M., F., Ahmed, W., & Babu A., V., (2015). Quantitative Evaluation of Performance and Validity Indices for Clustering the Web Navigational Sessions. World of Computer Science and Information Technology Journal. 1(5), 217-226.
[28] Ray, S., Turi, & R., H., (1999). Determination of Number of Clusters in K-Means Clustering and Application in Color Image Segmentation. The 4th International Conference on Advances in Pattern Recognition and Digital Techniques, Portugal.
[29] Saitta, S., Raphael, B., & Smith, I., (2007). A Bounded Index for Cluster Validity, In: Perner P. (Eds.), Machine Learning and Data Mining in Pattern Recognition. Springer, Berlin, pp.174 -187.