THE DELIVERY MODE:
THE EFFECT OF
DIFFERENTIATION IN
NEEDS AND STRENGTH
OF COUPLING
To what extent do differentiation in needs of support activities and strength of coupling of support activities affect the relationship between the delivery mode, shared or non-shared, and the perceived value of support activities by the business units?
Randy Rosink
26 November 2014
MSc in Business Administration,
Innovation and Entrepreneurship
Acknowledgements
During my last period at the University of Twente this thesis is performed for completing the master Business Administration, track Innovation and Entrepreneurship. The assignment is conducted for a shared service center, performing the administrative activities of a laboring company in the Netherlands. Next to my study I have been working for this organization for several years. This has made the study even more interesting, while the interface of theoretical courses and practical experiences increased the awareness of theory and how this is related to practice.
This thesis has been written between January and October 2014. I like to appoint my gratitude to several people. First of all I would like to thank all of my colleagues for their support
(participating and pretesting the survey, participation in interviews and all the other ways of support) in accomplishing the graduation assignment. Among others I would like to make a special thanks to my company supervisor for helping me with finding important stakeholders and the translation from theory to practice.
I would like to thank my first supervisor Jeroen Meijerink for the support and feedback to improve the thesis and for keeping me on track during several meetings. Furthermore I would like to thank Erwin Hofman for the feedback.
In finishing my study several difficult moments have occurred. For this reason I would like to thank my girlfriend and my family for their confidence, positive support and dragging me through difficult moments.
Kind regards,
Abstract
Since the nineties the number of Shared Service Centers (SSC) have risen in the Netherlands, echoing the United States. The main goal of the SSC is reducing redundancies by combining the benefits of centralized and decentralized organizational designs, combining the best of both worlds (Janssen and Joha, 2006). However poor designs of the SSC can cause costs to increase and the quality to decrease.
In this study design rules used for designing product platforms and managing product families are tested in a service delivery setting. According to Martin and Ishii (2002) two important design rules in platform design are the GVI (General Variety Index) and the CI (Coupling Index). Hofman and Meijerink (in press) already tested the moderating effect of the GVI, conceptualized as differentiation in needs of HR activities, on the relationship between the delivery mode (sharing or not sharing) and the perceived value of HR activities. In this study the research of Hofman and Meijerink (in press) is repeated for support activities, however we also tested the CI conceptualized as the strength of coupling. According to the theory used in our theoretical framework we assume a moderating affect of differentiation in needs and strength of coupling on the relationship between the delivery mode and the perceived value of support activities. Support activities with a high differentiation in needs and/or a high strength of
coupling should be performed in a non-shared delivery mode (embedded in the business units) to create the highest perceived value. While support activities with a low differentiation in needs and/or strength of coupling are assumed to create the highest service value if these support activities are performed in a shared delivery mode (inter- or intra-organizational).
Table of Contents
Acknowledgements ... 1
Abstract ... 2
Table of Contents ... 3
1. Introduction ... 5
2. Theoretical Background ... 7
2.1 The delivery mode and perceived value ... 7
2.1.1 The delivery mode ... 7
2.1.2 Benchmarking the delivery mode ... 8
2.1.3 The conceptualization of the performance indicator ... 9
2.1.4 Service design for increasing service value ... 10
2.2 Design rules ... 12
2.2.1 Platform thinking in service design ... 12
2.2.2 Conditions in successful product platforms ... 14
2.2.3 Differentiation in needs and strength of coupling... 15
2.3 Hypothesis... 20
3. Methodology ... 21
3.1 Contextual background ... 21
3.2 Unit of analysis and sampling ... 21
3.3 Data collection procedures ... 22
3.3.1 The survey research ... 23
3.3.2 The Design Structure Matrix (DSM) ... 24
3.4 Operationalization of the variables ... 24
3.4.1 The delivery mode ... 25
3.4.2 Differentiation in needs... 25
3.4.3 Strength of coupling ... 25
3.4.4 Perceived value by the business units ... 26
3.4.5 Control variable: Job tenure ... 26
3.5 Pretesting the survey ... 27
4. Research results and analysis ... 28
4.1 Descriptive statistics and correlations ... 28
4.2 Regression and hypothesis testing ... 29
4.2.1 Regression analysis ... 29
4.2.2 Model 1: The control variables ... 30
4.2.3 Model 2: Hypothesis 2 ... 30
4.2.4 Model 3: Hypothesis 1 ... 31
4.2.5 Model 4: Hypothesis 3 ... 31
5. Discussion and conclusion ... 32
5.1 Theoretical contributions and implications ... 32
5.2 Practical contributions and implications ... 35
5.3 Limitations and future research ... 36
5.4 Conclusion ... 38
References ... 39
Appendix ... 43
Appendix 1: Sampled support activities ... 43
Appendix 2: Regression analysis ... 44
P a g e 5 | 45
1.
Introduction
Since the nineties the number of Shared Service Centers (SSC) have risen in the Netherlands, echoing the United states (Strikwerda, 2010). Before an organization can establish an SSC, choices need to be made about the delivery mode of the activities that need to be executed. The delivery mode is conceptualized as a shared delivery mode (activities shared across business units) and a non-shared delivery mode (activities not shared across business units). Choosing the delivery mode is important for reaching the highest quality for the lowest costs of the activities. Within literature various benefits of setting up an SSC are mentioned (Bergeron, 2003; Janssen and Joha, 2004; Janssen and Joha, 2006; Schulman, Dunleavy, Harmer, and Lusk, 1999; Schulz, Uebernickel, Hochstein, and Brenner, 2009; Strikwerda, 2010). ‘An SSC consolidates processes within a concern in order to reduce redundancies; it delivers support processes; it is a separate organizational unit within the holding; it is aligned with external customers; cost-cutting is a major driver for implementation; it is focused on internal customers; and it is operated like a business’ (Schulz et al., 2009, p. 9). Within the SSC the benefits of centralized and decentralized organizational designs are combined within an SSC, trying to take the best of both worlds (Janssen and Joha, 2006). According to Janssen and Joha (2006) the basic premise of an SSC seems to be that services provided by one local department can be provided to others with relatively few effort. The know-how that can be developed within an SSC can improve service levels over the different business units, applying best practices for all comparable practices (Meijerink and Boundarouk, 2013). Furthermore central experts within the SSC can provide technological support, project management expertise and can make use of knowledge from past projects. Local experts provide business knowledge and user requirements (Janssen and Joha, 2004). Bundling the development, maintenance and use of services within an SSC means that these costs can be shared across business units. The innovations that were out of reach in the past might become feasible and the money freed can be used to improve service levels without giving up autonomy (Jansen and Joha, 2006). Analyzing scientific literature in depth makes clear that a lot is written about the possible benefits of an SSC and the motives for setting up one.
Economies of scale and scope, standardization, a flexible and effective alignment of IT, synergy, mutual learning and a clear management focus are premises of the SSC (Janssen and Joha, 2006). Bergeron (2003) claims that shared services is a collaborative strategy that can be
concentrated in a new, semi-autonomous business unit that has a management structure designed to promote efficiency, value generation, cost savings, and improved service for the internal customers of the parent corporation (Bergeron, 2003). Chandler (1977) imposes that sharing can increase productivity and decrease unit costs, often identified as economies of scale. Furthermore Pooled experience, enhance career progression, independent of business, synergies, lean and flat organization, recognition of group functions and dissemination of best practice are important motivations (Schulman et al., 1999).
As one can see, the perceived value for the internal customers of the parent corporation (the business units) is the most important reason for the existence of an SSC. Before statements about value can be made, the perceived value concept needs to be determined. Zeithaml (1988)
P a g e 6 | 45 research the ratio of costs and quality is used to interpret the perceived value.
However, nearly a third of the respondents within the research of Rona (2008) feel that the promised business benefits of the SSC have not been delivered. Next to this, Janssen and Joha (2006) have studied the accomplishment of motives. The outcomes show that about 38% of the motives were not achieved, however many of the interviewees did not feel that the SSC failed since other accomplished motives seem to compensate the not accomplished motives (Janssen and Joha, 2006). On the question why these objectives are not met, and thereby the perceived value for the internal customers of the parent company, no clear answer can be given.
Accomplishing objectives is influenced by many important aspects, Janssen and Joha (2006) mentions that the design of the SSC is of paramount importance. The design needs to be
carefully chosen and balanced in such a way that the different motives are achieved (Janssen and Joha, 2006). A poor design of the SSC may result in low quality and high costs and a decrease of the perceived value by the business units (Hofman and Meijerink (in press)). An SSC can be run in a lot of ways and no clear best practice can be appointed. The variables influencing the design are very complex, and one can most of the times say ‘it depends’. Within the field of design rules, a focus is made on platform thinking; ‘the collection of assets that are shared by a set of products (Robertson, 1998: 1)’. In the past it was thought to be useful only for organizations that produce physical products. However, within literature the leap to the intangible arena of services is made (Hofman and Meijerink, in press; Lin and Daim, 2009; Meyer and DeTore, 2001; Pekkarinen and Ulkumiemi, 2008). Trying to explain a part of the ‘failure’ of the SSC, Hofman and Meijerink (in press) have connected the delivery mode, sharing or non-sharing, with the platform thinking theory.
Within the field of platform thinking various authors explored issues dealing with the strategic benefits of developing product platforms and managing product families (Galsworth, 1994; Martin and Ishii, 2002; Pine, 1993; Robertson and Ulrich, 1998; Sanderson, 1991). Martin (2002) stresses a measurement for the GVI (generation variety index) and the CI (Coupling Index), furthermore a relationship can be detected between the two (Martin and Ishii, 2002). Elaborating on this article, Hofman & Meijerink (in press) found a significant relationship
between the delivery mode of HR services, shared or non-shared, and the service value perceived by the business units. It was found that this relationship was influenced by the confounding variable: ‘differentiation in needs’. However it appears that only a small part of the influence on the relationship between the delivery mode and perceived value of the business units is explained with this confounding variable (Hofman & Meijerink, in press). The findings of Hofman & Meijerink (in press) elaborate on the differentiation in needs (GVI) ignoring the strength of coupling (CI). According to K. Ulrich (1993) two components are considered coupled if a change made to one of the components can require the other component to change. This gap in literature will be researched in this paper, trying to explain to what extend differentiation in needs and strength of coupling influence the relationship between the delivery mode and the perceived service value. The main question of this research is formulated as:
To what extent do differentiation in needs of support activities and strength of coupling of support activities affect the relationship between the delivery mode, shared or non-shared, and
P a g e 7 | 45
2.
Theoretical Background
Within this chapter relevant literature is analyzed thoroughly. Relevant literature from the past is analyzed. Furthermore important subjects are pinpointed and hypotheses formulated.
2.1 The delivery mode and perceived value
2.1.1 The delivery mode
In the nineties the number of SSC’s has emerged (Strikwerda, 2010). This rising number was a response to the saturation of markets causing a decline in profitability, forcing organizations to cut costs. According to Janssen et al. (2006, p. 104) the popularity of the SSC originates from: ‘a combination of advantages, including efficiency gains and an increase in service levels without giving up the control of organizational and technical arrangements and expertise’. The SSC is a separate organization within the holding and is focused on the internal customers of the parent company, the business units (Schulz et al., 2009). The SSC is a semi-autonomous business unit, where activities are bundled (D. Ulrich, 1995). Schulz et al. (2009, p. 9) defined a standardized definition of SSC’s; ‘An SSC consolidates processes within a concern in order to reduce
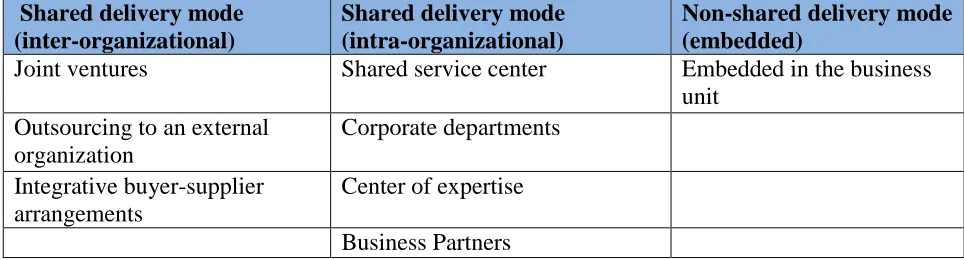
redundancies; it delivers support processes; it is a separate organizational unit within the holding; it is aligned with external customers; cost-cutting is a major driver for implementation; it is focused on internal customers; and it is operated like a business’. Activities of the business units are delegated and executed in an SSC, the so called support activities. Although the definition of an SSC is clear and looks straightforward, there are several organizational designs that have a common denominator ‘the delivery mode of support activities’. These organizational designs are: 1] Joint ventures: the pooling of a portion of activities of two or more firms in a legal
organization (Kogut, 1988) 2] Outsourcing: delegating activities to an external organization like vendors, consultants or other third parties (D. Ulrich, 1995). 3] Buyer-supplier arrangements: the transferring of activities from one partner to another, hereby coordination is ensured by an appropriate fit between contact points (Dekker, 2004). 4] Corporate departments: embedding of business unit activities, like for example HR or communication, in a corporate department of the holding (Ulrich, Younger and Brockbank, 2008). 5] Centers of excellence: the distribution and combination of talent throughout the organization (D. Ulrich, 1995). 6] Business partners: generalists that work directly with line managers and leaders of business units, aligning practices with business objectives (Ulrich et al., 1995; 2008). 7] Embedded: organizational designs where the activities are embedded in the business units itself (Ulrich et al., 2008). The delivery mode of activities is the overarching level grasping all of these organizational designs in one
conceptualization. In table 2.1 the organizational designs are categorized in a shared intra-organizational delivery mode (within the holding), a shared inter-intra-organizational (between
P a g e 8 | 45
Shared delivery mode (inter-organizational)
Shared delivery mode (intra-organizational)
Non-shared delivery mode (embedded)
Joint ventures Shared service center Embedded in the business unit
Outsourcing to an external organization
Corporate departments Integrative buyer-supplier
arrangements
Center of expertise
[image:9.612.65.547.87.217.2]Business Partners
Table 2.1: The organizational designs and the delivery modes
This conceptualization is two-sided; the shared delivery mode (inter- and intra-organizational) and the non-shared delivery mode (embedded). Hofman and Meijerink (in press) conceptualize the delivery mode as follows; (1) a shared delivery mode reflects the execution of common HR activities by delivery channels that are shared across business units and (2) the non-shared delivery mode refers to the execution of HR activities using delivery channels that operate for a single business unit. The conceptualization of Hofman and Meijerink (in press) focuses on the delivery mode of HR activities. Within this research a focus is made on the delivery mode of administrative support activities, later mentioned as support activities. Besides this difference the conceptualization of Hofman and Meijerink (in press) is used for this research.
2.1.2 Benchmarking the delivery mode
An important issue in organizational design is making a choice between the shared or non-shared delivery mode. This is why a benchmark needs to be determined, the so called performance indicator. The performance indicator, a set of values used to measure against make it possible to choose the most suitable delivery mode. In finding this set of values literature mentions a lot of advantages of the shared delivery mode (Quinn, Cooke, and Kris, 1977; Janssen and Joha, 2006; Schulman et al., 1999; Schulz et al., 2009). A shared delivery mode can increase productivity and decrease unit costs, often identified as economies of scale (Chandler, 1977). Furthermore pooled experience, enhanced career progression, independence of business, synergies, lean and flat organization, recognition of group functions and dissemination of best practices are
important motivations (Schulman, 1999). Next to this necessity is helping the business units to focus on their core business and several products and synthesis are achieved within an SSC (Janssen, 2004). The risks of developing new systems and services can be reduced by
concentrating innovations and by learning from experiences, the weaknesses of resources can be overcome and strengths can be exploited by centralization within the SSC (Janssen, 2004). This is an important risk reduction technique. The governmental case Janssen (2004) studied,
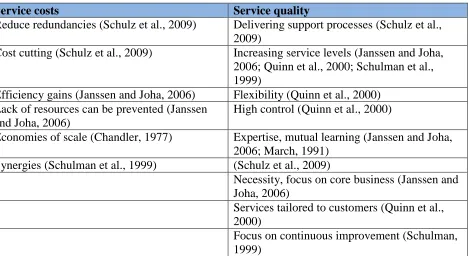
P a g e 9 | 45 These advantages facilitate a categorization, covering all the benefits. These categories are the service costs (what is given) and service quality (what is received), categorized in table 2.2. Within this research the performance indicator of the delivery mode is the ratio between service cost and service quality (Cronin, Brady, and Hult, Athanassopoulos, 2000; 2000; Hallowell, 1996). In the next paragraph a detailed conceptualization of the performance indicator is given.
Service costs Service quality
Reduce redundancies (Schulz et al., 2009) Delivering support processes (Schulz et al., 2009)
Cost cutting (Schulz et al., 2009) Increasing service levels (Janssen and Joha, 2006; Quinn et al., 2000; Schulman et al., 1999)
Efficiency gains (Janssen and Joha, 2006) Flexibility (Quinn et al., 2000) Lack of resources can be prevented (Janssen
and Joha, 2006)
High control (Quinn et al., 2000)
Economies of scale (Chandler, 1977) Expertise, mutual learning (Janssen and Joha, 2006; March, 1991)
Synergies (Schulman et al., 1999) (Schulz et al., 2009)
Necessity, focus on core business (Janssen and Joha, 2006)
Services tailored to customers (Quinn et al., 2000)
[image:10.612.78.546.152.408.2]Focus on continuous improvement (Schulman, 1999)
Table 2.2: The advantages of the shared delivery mode categorized in service costs and service quality
2.1.3 The conceptualization of the performance indicator
The performance indicator is the ratio between the service costs and service quality. Among others the conceptualization of the overarching performance indicator of the delivery mode is the perceived service value by the business units (Hofman and Meijerink, in press; Maatman,
Bondarouk and Looise, 2010; Meijerink et al., 2011). In this paragraph a thorough conceptualization of the performance indicator for the delivery mode is given.
First of all Zeithaml (1988, p. 14) conceptualizes perceived value as: ‘the consumer’s overall assessment of the utility of a product based on perceptions of what is received and what is given’. The ‘what is given’ focuses on the costs of the service and the ‘what is received’ reflects the quality of the service in this research. Numerous studies have endeavored to model the interrelationships between quality, value and satisfaction (Cronin et al., 2000). Hallowell (1996) mentions that value equals perceived service quality relative to the price the consumer pays. Furthermore Athanassopoulos (2000) describes value as the amalgamation of service quality and price attributes. Cronin et al. (2000, p. 211) concluded with: ‘the influence of perceptions of service quality and value on behavioral intentions is considerably more integrated than is
P a g e 10 | 45 Service quality is hard to evaluate because intangible services have other cues than tangible products and cannot be judged by style, hardness, color etcetera (Parasuraman, Zeithaml and Berry, 1985). Maatman et al. (2010) define the quality of services as the perceived value of the business units in relation to their needs. Parasuraman et al. (1985) labeled ten service quality determinants. In the next phase of their research an overlap of the determinants has been found, leading to five determinants ordered by importance (Berry, Zeithaml and Parasuraman, 1985; Parasuraman, Zeithaml, and Berry, 1988). 1] Reliability: the consistency of performance and dependability, this exists of performing services properly at the first time, honoring promises, accuracy, keeping correct records and performing the service at the designated time
(Parasuraman et al., 1985). 2] Responsiveness: the willingness or readiness of employees to provide service activities in terms of prompt service (Parasuraman et al., 1985). 3] Assurance: the possession of required knowledge and skills like; politeness, respect, consideration, believability, honesty and freedom of danger/risk/doubt (Johnston, 1995; Parasuraman et al., 1985). 4] Empathy: making the effort to understand the customer needs and the approachability of the employees (Johnston, 1995; Parasuraman et al., 1985). 5] Tangibles: the physical evidence of the service like; appearance of personnel, tools/equipment used and physical representations (Parasuraman et al., 1985). These five determinants measure the quality of support activities in the perception of business units. As mentioned these are ordered by importance in the eyes of the customers (the business units).
The costs construct of the perceived service value by the business units is two-dimensional; monetary and non-monetary. The monetary side is impressed in prices paid by business units (for performing the support activities) for the shared delivery mode in comparison to prices paid in a non-shared delivery mode. The non-monetary side is the time and effort business units need to invest for receiving the support activities in a shared delivery mode, thus also in the non-shared delivery mode (Meijerink, Hofman and Hemels, 2011). If the monetary costs of sharing a support activity are lower than not sharing a support activity, sharing positively influences the perceived value by the business in this case. Furthermore if the time and effort invested in a shared delivery mode is lower than it is in a non-shared delivery mode, sharing the activity has a positive effect on the perceived value of the business units. This construct is used for comparing the costs of shared and non-shared delivery mode. In this research the construct service costs is defined as prices paid, and time and effort invested by the business units.
The perceived value increases if the service quality of support activities improves and/or the costs drop. This conceptualization is used as the performance indicator for comparing the shared and the non-shared delivery mode and can support decision makers in choosing the most suitable delivery mode.
2.1.4 Service design for increasing service value
P a g e 11 | 45 these needs are not accomplished and are influencing the costs of the service. On the other hand service quality related needs like; mutual learning, higher service levels and lower control are not satisfied and cause the service quality to decrease for the shared delivery mode. Surprisingly this did not mean that the shared delivery mode was a failure in the eyes of the business units, a lower perceived value by the business units compared to the non-shared delivery mode. Due to the not anticipated benefits like; better cost predictability, better information
security/authorization and imposing successful practices the business units did not conclude that the shared delivery mode failed. Not fulfilling the predicted benefits can be caused by various reasons. Janssen and Joha (2006) argue that the design of the shared service is of paramount importance for reaching the benefits. The design of the shared delivery mode results in the allocation of support activities and for allocating support activities; the scope needs to be strictly demarcated, accountability needs to be delegated and authority needs to be assigned (Fawaz, Daheb, Audouin, Du-Pond, and Pujolle, 2004; Hofman and Meijerink, in press). This means that designed processes from the past need to be evaluated and adjusted to the semi-autonomous business unit. The redesign of these processes needs to be done accurately. An inaccurate redesign can decrease the perceived service value by the business units, increasing costs and decreasing quality. Costs may rise because continuous negotiations need to take place to keep the process run smoothly (Rindfleisch, 1997). Next to this quality can drop because service activities are not performed in a way business units want. This is why service design is important in
reaching the benefits of the shared delivery mode.
Discovering design rules of the delivery mode and increasing the perceived value in terms of higher quality and lower costs are leading to the platform design theory: ‘the collection of assets that are shared by a set of products (Robertson and Ulrich, 1998, p. 1)’. Designing a platform is the process of identifying commonalities in the offerings of the organization. First of all product families can be identified as the collection of products that share the same components of a product (Halman, Hofer and van Vuuren, 2003). The key of platform thinking is the sharing of these components across a family of products. The standardized components, used in every product of the product family can be integrated in the product platform. The differentiation in the products of the product family is created by the additional components that are added to the product platform, creating an individual product. Using a product platform is more efficient and economies of scale can be reached (Robertson and Ulrich, 1998). Economies of scale lower the costs per product. Furthermore the goal of platform design is reaching benefits like synergy, lower risk and improved service (Robertson and Ulrich, 1998). A clear comparison between the benefits of sharing support activities across a set of services in the service environment and the sharing of assets across a set of products in a product environment can be made. The shared delivery mode of support activities in service environments is the product platform in product environments. Furthermore platform design and the shared delivery mode have the common goal of increasing the perceived value (decreasing costs and increasing quality). For this reason platform thinking is used to explain the relationship between the delivery mode and the service value of support activities perceived by the business units.
P a g e 12 | 45 environments. This assumption has changed over the past years and among others, the leap between service design and platform design is set (Hofman and Meijerink, in press; Lin and Daim, 2009; Meyer and DeToreb, 2001; Pekkarinen and Ulkuniemi, 2008). The literature about product platforms is used to see if product design rules are useful in service design. Focusing on design rules elaborated in product platform design, thus not in service design. These design rules are used to explain the effect of the shared delivery mode on the perceived service value of support activities, trying to find a benchmark of what delivery mode to choose for a specific support activity.
2.2 Design rules
2.2.1 Platform thinking in service design
[image:13.612.73.430.414.687.2]The platform design originates from production environments. Halman et al. (2003, p. 150) conceptualize platform design as: ‘the process of identifying and exploiting commonalities among a firm’s offerings, target markets, and the processes for creating and delivering offerings, appears to be a successful strategy to create variety with an efficient use of resources (e.g., cost or time)’. Meyer and Lehnerd (1997, p. 7) define the product platform as: ‘a set of common components, modules, or parts from which a stream of derivative products can be efficiently developed and launched’. The key of the platform approach is sharing modules and other assets across a family of products (Halman et al., 2003). Within platform design the product family, components and the platform are important concepts. These concepts are elucidated here, and the link with service design is made. The concepts are clarified using a simplified example of an organization in the laboring market in the Netherlands existing of two business units with different target markets (figure 2.1).
P a g e 13 | 45 The product family is a collection of products that share the same assets (Meyer and Utterback, 1993; Sawhney, 1998). These assets may include components, knowledge, and production processes (Halman et al., 2003; Robertson and Ulrich, 1998). Within a service environment the product family is the collection of processes that share the same support activities. Within the example the service family can be identified as low and high segment laboring. The processes of both services share the same activities. The main activities of business unit A and B are more or less the same, thus there is a variation in for example the sales and recruiting activities that are performed. This leads to the component construct. A component is a part of the bigger total. The component needs to be recognizable in the individual product/service and needs to possess a substantial amount of functionality compared to the individual product/service it is part of (Miller and Elgard, 1998). To go short a component in service environments is a recognizable part of a service and can exist of several components, although its functionality needs to be substantial. Within the given example the activities are mentioned (i.e. collection, recruitment etc.), these activities exist of one or more components. Components of the activity ‘collection’ could be for example the regular collection, legal collection and reporting to the business units. The product platform is the most important concept in platform design. This is the not an
individual product nor a product family, thus the common basis of the individual products within the product family (Halman et al., 2003). The task of differentiating a product for a specific customers needs to be postponed until the latest point in the supply network (Feitzinger and Lee, 1997). First of all a platform in service environments needs to be conceptualized. A service is the sequence of activities, also called the process, performed to eventually deliver an individual service to a client. The individual delivered service can be seen as the non-material equivalent of an individual delivered end-product. The platform in a service process are the activities that can be standardized across business units. These specific activities can potentially be performed in a shared delivery mode, the service platform. At the moment the service platform in figure 1 is; declaration, invoice, payroll and collection. The other activities have common components over the product family, however there is a variety in some of the components within these activities. This means that these activities are hard to standardize, that is why these are not integrated in the product platform ‘yet’. The activity of sales for the low segment and for the high segment has grounding differences and this is the core business of the business units. This is due to the fact that there are two business units targeting specific markets (Simpson, 2003). These specific markets are approached and influenced on a different manner. This differentiation in components of the activities is why these are not in the service platform. The service platform; declaration, invoice, payroll and collection is the common basis of activities performed in a shared delivery mode for the business units. It is important that the process steps earlier in the process are fulfilled and agreed by all the parties, the employee, the employer and the business unit.
P a g e 14 | 45
2.2.2 Conditions in successful product platforms
In platform design several authors explored issues dealing with strategic benefits of developing product platforms, managing product families and conditions of the platform design (Galsworth, 1994; Martin and Ishii, 2002; Pine, 1993; Robertson and Ulrich, 1998; Sanderson, 1991). There is a possibility that these conditions can be translated to service design, fixed on the conditions that are needed for choosing a delivery mode. This choice needs to fulfill the anticipated benefits and increase the perceived value of the business units.
Robertson and Ulrich (1998) observed two common dysfunctions in attempting to create product platforms. 1] A balance between the commonality and the distinctiveness needs to be present. A fact is though that this balance is frequently hindered by organizational forces. These forces can exist between different departments of the organization, thus also between different activities. For example the pressure between sales (selling as much as possible) and engineering (producing as cheap as possible) can lead to a trade-off. During the design of a product platform a trade-off needs to be made between the commonality and the differentiation of the products in the product family (Simpson, 2003). According to Siddique, Rosen and Wang (1998) two separate indices for commonality exist, the component - and the connection commonality. This can be compared with the findings of Marten and Ishii (2002) introducing the GVI (general variety index). This index helps identifying components that are likely to change over time. Furthermore Marten and Ishii (2002) introduce the CI (coupling index) for measuring the coupling between the
components. The findings need to reduce the life cycle costs of a product by reducing the impact of variety. Analyzing GVI and CI can give an organization handhelds in choosing the delivery mode. The perceived service value of sharing support activities can be influenced by these constructs, and can help in making a rational decision for sharing or not sharing support
activities. Within platform design these constructs influence the choice for putting an activity in the product platform or not, which influences the perceived value. 2] Even when platform planning with a committed team is started it can cause problems. The committed teams need to create rational control over a product platform and take away resistance. Organizations have a history of embedding product development in business units and resistance against change can exist (Meyer and DeTore, 2001). Thus also with a committed team the platform planning can be bogged down in details. This can result in giving up the platform.
P a g e 15 | 45
2.2.3 Differentiation in needs and strength of coupling
The GVI, introduced by Marten and Ishii (2002, p. 1), is: ‘a measure for the amount of redesign effort required for future designs of the product’. A derivate of this conceptualization of the GVI is ‘differentiation in needs’. This also reflects the variety in support activities that the business units need and the heterogeneity of support activities performed for the business units (Halman et al., 2003; Martin and Ishii, 2002). In service platforms it is important to know what effort is required for future designs of the service. Meijerink et al. (2011) found that differentiation in needs is a significant moderator of the relationship between HR service value and the delivery mode. Differentiation in needs is a design rule that gives insight in the redesign effort of
activities to keep up with future needs. Considering and reconsidering the design of activities can be seen as conflict, because parties concerned with the redesign are negotiating about how the design of the activity should be. Conflict for non-shared activities that change regularly is time and resource consuming, although in a shared delivery mode this conflict is even more time and resource consuming because more parties are concerned with the changes. This slows down the flexibility of the business units, a change in activities needs to be agreed by several parties in the product family. Adjusting support activities in the shared delivery mode means that all the business units need to adapt the redesigned service platform, influencing the perceived service value by means of quality and costs. Meijerink et al. (2011) concluded that a shared delivery mode increases the service value positively when the differentiation in needs is low and negative when differentiation in needs is high. To go short choosing a shared delivery mode for a support activity that has a high differentiation in needs can cause a decrease of the perceived service value because more time and resources need to be invested to keep up with future needs. Within this research this moderating effect is tested in another setting, leading to the following
hypothesis:
Hypothesis 1a: The perceived value of support activities with low differentiation in needs is higher when delivered through a shared delivery mode compared to a non-shared delivery mode
Hypothesis 1b: The perceived value of support activities with high differentiation in needs is higher when delivered through a non-shared delivery mode compared to a shared delivery mode
Next to differentiation in needs the coupling index is an important construct in product platform design. The CI measures: ‘the coupling among the product components (Martin and Ishii, 2002, p. 1)’. According to Ulrich (1993, p. 423): ‘two components are considered coupled if a change made to one of the components, the more likely a change in one will require a change in the other’. Next to this the coupling between components, in our research support activities, can be two sided; information supplying activities and information requiring support activities (Martin and Ishii, 2002). Coupling of activities can be seen as the interaction, by means of information, between activities. Furthermore the interdependence is the extent to which activities depend on each other for accomplishing their tasks (Daft, 2007). Daft (2007) describes three
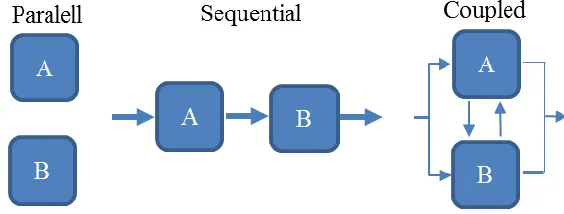
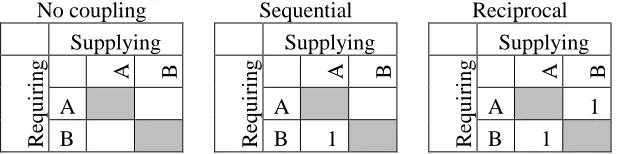
interdependencies; pooled (activity A and B do not interact with one another), sequential (activities A becomes input for activity B) and reciprocal (activity A is input for B and B on its turn is input for A). Within service environments this in- and output is seen as a flow of
P a g e 16 | 45 Design Structure Matrix (DSM) (Carracascosa, Eppinger and Whitney, 1998; Yassine, 2004). Although the constructs in this matrix are named differently, the meaning is the same (figure 2.2). The pooled, sequential and reciprocal interdependencies are in the DSM matrix respectively the parallel, sequential and coupled configurations of the interactions between activities
(Yassine, 2004). This are the three basic building blocks for describing the relationship between system elements (Yassine, 2004).
[image:17.612.88.370.171.278.2]
Figure 2.2: Parallel, sequential and coupled activities
According to Vanderfeesten, Reijers and van der Aalst (2008) coupling is measured by the number of interconnections among, in our case, support activities. The interconnection is the up- and/or downstream flow of information, the interaction between support activities. To go short the coupling is conceptualized as; the number of support activities a support activity requires information from and/or supplies information to. Clarifying this for the interdependencies means that: ‘parallel’ activities have no coupling, ‘sequential’ activities are coupled requiring
information for performing downstream activities and the most complex configuration ‘coupling’ are coupled, down- and upstream information flows are existing. The higher the numbers of interdependencies between support activities the more stakeholders are involved in the potential redesign of a support activity. These interdependencies of support activities can result in
complicated interactions between both people and tasks (Yassine, 2004), the process of considering and reconsidering the support activities. Eventually the complicated interactions should lead to a consensus that is presumed to be the best for the stakeholders, these complicated interactions are conceptualized as conflict. In organizations diverse forms of conflict between people and tasks exist. According to Cosier and Rose (1977) two common forms are goal conflict and cognitive conflict. These forms of conflict are conceptualized as respectively: ‘an interpersonal relationship involving divergent preferences regarding at least one of the decision outcomes and the awareness of inconsistent inferences drawn from identical information’ (Rose, 1977, pp. 378-379). According to De Drue and Weingart (2003) conflict can be defined as the process resulting from the tensions between members of a team of real or perceived differences. This conflict is concerned with relational (i.e. personal taste, political preferences and
interpersonal style) and task issues (i.e. distribution of resources and judgment and interpretation of facts) (De Dreu and Weingart, 2003).
P a g e 17 | 45 potential of conflict. To go short the higher the number of support activities a support activity is coupled to, the more stakeholders are involved in the process of solving the conflict, the harder it is to reach a consensus for solving the conflict. On the other hand not coupled support activities have a lower potential of conflict, since less stakeholders are involved. Coupling is assumed to be ‘positively’ related to conflict.
During the process of conflict reaching a consensus is the main goal, taking away the tensions between the stakeholders. While the process of solving the conflict takes place, the support activities are considered and reconsidered until a consensus between the stakeholders is reached. According to De Drue and Weingart (2003) conflict interferes with performance and has a negative influence on the productivity of teams, since time needs to be invested in negotiating the preferences. Next to this costs may rise because of the time and resources that are invested to make the considering and reconsidering of support activities possible and keep the process to run as smoothly as possible (Rindfleisch, 1997). The flexibility will be lower, because adjustments can only be made by negotiating with other stakeholders (Quinn et al., 2000). Since perceived value is conceptualized as the ratio between service costs and service quality a link between conflict and perceived value can be appointed. An increase of conflict causes the productivity and flexibility to decline and the costs to rise. Therefore a negative relation between the conflict and perceived value is expected, a rise of conflict causes a decline of the perceived value for support activities.
The causal relation between coupling and conflict and on its turn between conflict and the perceived value of support activities is explained in the following examples.
Example 1 (support activities, no coupling): Activity A does not interact with activity B, this means that activity B will not change if activity A is reconsidered and the other way around. The activities are not coupled and thereby the potential of conflict is low. In this case the
perceived value of activity A and B are not influenced by coupling.
Example 2 (support activities, sequentially coupled): Activity A interacts with activity B, information from activity A is needed to perform activity B, this means that if activity A changes the more likely activity B changes. The potential of conflict is high. In this case the perceived value of activity B can be influenced by coupling.
Example 3 (support activities, reciprocally coupled): Activity A interacts with activity B, information from activity A is needed to perform activity B and information from activity B is needed to perform activity A, this means that if activity A changes the more likely activity B changes and on its turn the more likely activity A changes again. The potential of conflict between stakeholders is high. In this case the perceived value of activity A and B can be influenced by coupling.
P a g e 18 | 45 coupled in terms of lower quality and higher costs. However being interconnected to other
support activities is not enough to cause conflict, which is why the relation is elaborated in depth. Every support activity can be classified as: not coupled support activity, information requiring support activity (IRSA) and/or information supplying support activity (ISSA). According to Ullrich (1993), in our case the support activities, are coupled if a change made to a support activity, the more likely another support activity requires a change. The assumed change rates of support activities are already conceptualized and elaborated as the differentiation in needs. In this research the differentiation in needs of the information requiring support activities are
abbreviated as IRSAdiff and the differentiation in needs of the information receiving support activities is abbreviated as the ISSAdiff. Every support activity has a degree of differentiation in needs, preferences in a specific moment in time thus also over time (Hofman and Meijerink, in press; Martin and Ishii, 2002). Coupling only measures the number of support activities it requires information from and/or supplies information to, leaving the change rates
(differentiation in needs) of these support activities out of scope. The interactions between activities are occurring more frequent if the ISSAdiff and the IRSAdiff is high. The change rates are higher and conflict occurs more often, this is why the variable strength of coupling is introduced.
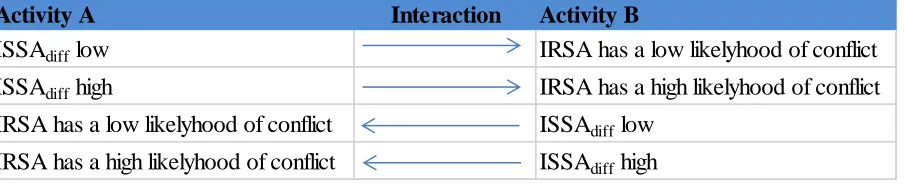
An analysis of all the interactions between support activities result in a complicated web of interactions, a web of down- and upstream interactions between two or more support activities. The interactions are elaborated in more depth for giving a conceptualization of the strength of coupling, where the ISSAdiff and the IRSAdiff is taken into account to measure the strength of coupling of the IRSA. The conceptualization makes clear how coupling and differentiation in needs are combined into the variable strength of coupling. There is a one-way downstream interaction of information between the support activities, sequential. If the ISSAdiff is high and the IRSA is sequentially coupled to the ISSA than the likelihood for the IRSA to change through interactions of information is higher. However an upstream interaction of information between support activities can also be present, reciprocal. In this case the IRSA becomes an ISSA and the ISSA becomes an IRSA, where the same relation counts. A high ISSAdiff increases the potential of conflict of the IRSA. In this research it is assumed that the IRSA is more likely to change if it is dependent of changes in ISSA’s with a high differentiation in needs. On its turn this
potentially causes more conflict, decreasing the service quality and raising service costs of the IRSA. The last option is that there is no interconnection between the support activities. The conflict and thereby the perceived value of the activities with no interconnection is not
[image:19.612.77.529.584.676.2]influenced by the differentiation in needs of other activities, thus only by the differentiation in needs of the activity itself.
Figure 2.3: Interactions
Activity A Interaction Activity B
ISSAdiff low IRSA has a low likelyhood of conflict
ISSAdiff high IRSA has a high likelyhood of conflict
IRSA has a low likelyhood of conflict ISSAdiff low
P a g e 19 | 45 The research focuses on the effect of the ISSA’s with a differentiation in needs that on first hand supplies information to the IRSA. The conflict and thereby the perceived value of the IRSA is assumed to be affected by the differentiation in needs of one or more ISSA’s, although also by the differentiation in needs of the IRSA itself. This total is conceptualized as the strength of coupling; the total differentiation in needs of the ISSA’s added with the differentiation in needs of the IRSA; Strength of coupling = (ISSAdiff+ISSAdiff+…+ISSAdiff) + IRSAdiff.
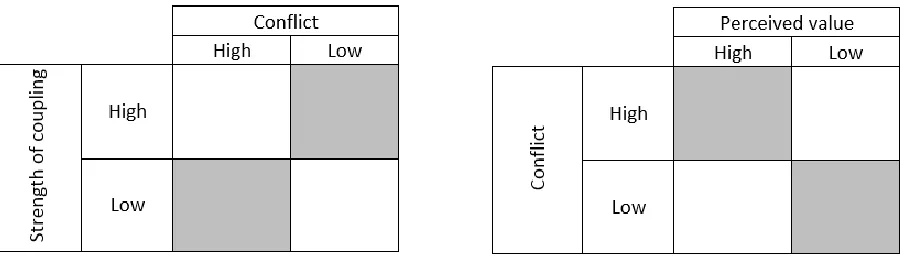
[image:20.612.85.537.215.344.2]The assumed effects of the strength of coupling on the conflict and thereby on the perceived value of the IRSA can be illustrated as follows.
Figure 2.4: the assumed effect of strength of coupling on perceived value
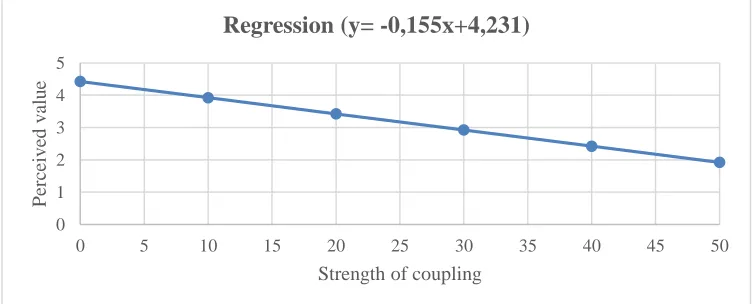
The white fields in the illustration clarify the expected relations in figure 2.4. First of all the strength of coupling of the IRSA is assumed to have a ‘positive’ correlation with conflict, the higher de strength of coupling the higher the conflict and the lower the strength of coupling the lower the conflict. On its turn an increase of conflict for the IRSA is negatively related to the perceived value and the other way around. To go short a high strength of coupling of the IRSA is assumed to have a lower perceived value compared to an IRSA with a low strength of coupling. The following hypothesis is tested to see if this theory can be confirmed or rejected.
Hypothesis 2: The perceived value of support activities with a high strength of coupling is significantly lower than it is for activities with a low strength of
coupling
The external driver of change (differentiation in needs) and the internal driver of change (strength of coupling) are already elaborated (Martin and Ishii, 2002). Both of these drivers are concerned with change rates and the number of stakeholders that are involved in solving a conflict leading to an in- or decrease of the perceived value of support activities. For
P a g e 20 | 45 assumed to be even more time and resource consuming since even more stakeholders are
involved in the considering and reconsidering of the IRSA. The strength of coupling of the IRSA is expected to moderate the relationship between the delivery mode and the perceived value of the business units. An IRSA can also be an ISSA for other support activities, this is why the information requiring and information supplying support activities are distinguished and conclusions are drawn on the strength of coupling of every IRSA. To go short an IRSA with a high strength of coupling in a shared delivery mode is assumed to have more conflict, since more stakeholders are involved compared to a non-shared delivery mode, leading to a decrease of the perceived value. On the other hand an IRSA with a low strength of coupling in a non-shared delivery mode is assumed to have less conflict, since fewer stakeholders are involved in solving the conflict. This is hypothesized as follows.
Hypothesis 3a: The perceived value of support activities with a high strength of coupling is higher when delivered through a non-shared delivery mode compared to a shared delivery mode
Hypothesis 3b: The perceived value of support activities with a low strength of coupling is higher when delivered through a shared delivery mode compared to a non-shared delivery mode
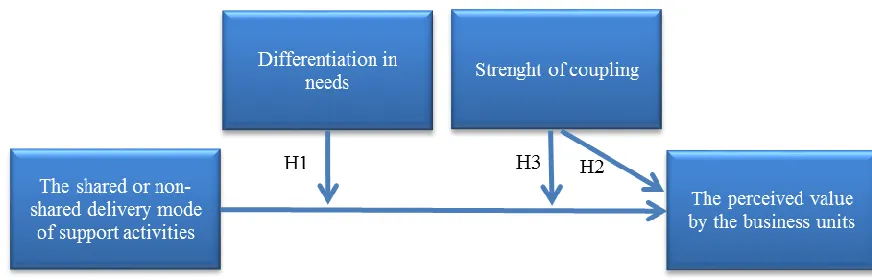
[image:21.612.71.507.385.525.2]2.3 Hypothesis
P a g e 21 | 45
3.
Methodology
In the chapters before, the hypothesis have been formulated. This chapter describes the research methods used for testing the hypothesis. First of all the contextual background, the sampling and the procedures are elaborated. Next to this an operationalization of the variables is given.
3.1 Contextual background
About ten years ago the laboring company in question (later mentioned LabCom) started a shared service center. Due to anonymity reasons this SSC is called ShareCom. They provide and are responsible for the administration and cash flow of LabCom. ShareCom is an internal joint venture of the business units within in the LabCom, existing of the several. ShareCom supports all of these labels. This research focuses on some of the business units of LabCom;
Professionals, Techniek, Bouw, Transport and Uitzenden. According to the annual report 2001, the main driver of setting up ShareCom was to raise the competitiveness and increase the profits of the business units. Furthermore focus on core competences of the business units, a culture aimed at good results and service value, efficient use of IT, reaching economies of scale, creating a flexible organization, fast integration of new developed/acquired business, an efficient
management of international customers and suppliers were reasons for setting up ShareCom. Since the establishment the service portfolio has been constantly changing, more activities are shared and others are delegated back to the business units. This way cost cuttings for the internal clients (the business units) are reached, service quality rose and some processes have been automated.
At the time of the research January 2014 till September 2014 ShareCom was constantly trying to unburden the business units by taking over more support activities (administrative activities). In doing this it appeared that in some cases support activities are shared across business units thus not for all business units ‘yet’. To go short there is a variety in the delivery mode of support activities; some are performed in a shared delivery mode and some in a non-shared delivery mode. That is why this case is a useful research setting for testing the hypothesis.
3.2 Unit of analysis and sampling
The unit of analysis in this research is the support activity that is performed through a shared or a non-shared delivery mode. First of all insight is needed in the support activities that are
P a g e 22 | 45 For these reasons the purposive (judgmental) sampling method is used, ‘select a sample on the basis of knowledge of a population, its elements and the purpose of the study’ (Babbie, 2010, p. 193). Knowledge of the various processes is gained through a detailed document analysis, the study of recorded human communications such as websites, working processes and systems (Babbie, 2010). Completing the list of support activities is done by reviewing the list with three knowledge carriers. 1] A consultant of LabCom; knowing the processes and how to perform the activities involved. 2] A rayon manager of LabCom; having an overview of the laboring
processes and activities involved in commercialization of the total service package LabCom delivers. 3] A team leader of ShareCom; this team performs shared support activities for a business unit of LabCom, having insight in the cooperation between ShareCom and LabCom. Furthermore the team leader has a detailed overview of the process. In these reviews additional questions can be asked and more detailed information can be gathered. In the pretest of the questionnaires the activities are discussed again, explained later on.
In the research the demands of the sample and knowledge gathered have led to the selection of two complete process steps that are performed by/for the earlier selected business units; ‘sign in’ and ‘placement’ (figure 2.1). Both of these process steps are to a large extend the same for the business units. The list of activities is generalized in such a way that every activity is performed in/for all the business units that are in the research. In the scheme underneath the spread of shared and non-shared activities is given. At the end this is leading to a sample of 52 activities that are researched for testing the hypothesis (appendix 1; the samples activities). Due to the fact that complete process steps and all of its activities need to be in the sample, it is impossible to spread the number of shared and non-shared activities equally. Covering both process steps completely leads to a sampling framework and sample that are the same.
Sample
Business unit
Number of support activities
Shared delivery mode
Non-shared delivery mode
Professionals 52 32 20
Techniek 52 16 32
Bouw 52 16 32
Transport 52 16 32
Uitzenden 52 16 32
Table 3.1: The Sample
3.3 Data collection procedures
P a g e 23 | 45
3.3.1 The survey research
Data on the differentiation in needs and the perceived value by the business units is collected through a survey research, this quantitative methodology is used because of the size of the sample, 52 support activities. The advantages of survey research are; feasibility within a short period of time and the flexibility in the amount of questions. Weaknesses of survey research can be; questions need to be at least appropriate to all respondents, inflexible in changing the initial survey throughout the study and artificiality (Babbie, 2010). Taking the weaknesses into account the survey research is the most appropriate method because of the repeating aspect of the
standard questions that are asked. Next to this the purpose of the research is not to reach a high generalizability to other populations and external validity may be low. The survey is divided in two questionnaires; the first questionnaire collects data on the variable differentiation in needs and the second on the perceived value of the business units. The survey is split up to prevent respondents to see a covariance between the variables (Podsakoff, Mackenzie and Lee, 2003), this prevents a common method bias.
The surveys are both conducted among the rayon managers (=RM) of the business units, instead of the large amount of consultants. In contrast to the consultants the RM is chosen because of their:
insight in the current demands of sampled activities
broad overview of expected changes and future expectations of the sampled activities
ability to appreciate the quality and costs of the sampled activities
control over the consultants that in some cases perform the activities
In total a number of 37 questionnaires for the first survey are send to personal mail addresses of the RM, the second survey is dependent on the response of the first survey. The list of mail addresses is collected using the on intranet available telephone guide. This guide is checked and tracked on a regular basis and up-to-date. The second survey is only send to the respondents on the first survey because both the questionnaires need to be coupled for analysis. A digital
questionnaire1 is send by personal mail, using a personal link so that the participation is restricted and both questionnaires can be coupled. The answers collected from the respondents are kept anonymous and personal data is deleted as soon as both questionnaires are coupled, to guarantee anonymity of the answers given. This is done so that the response bias is minimized, preventing distorted data due to motivated responses to create a favorable impression of reality (Fuller, 1974).
Within the first five working days 8 (22%) surveys returned. The RM, from whom no survey returned after the initial invitation, is mailed with a reminder after 7 days. After the reminder the response rate was 30%. Finally, 13 days after the initial questionnaire was send, the respondents that did not fill in the survey are called as a reminder for filling in the survey. The total response rate of the first survey is 43%, a total of 16 respondents who filled in the whole first survey. Nine days after the final call for the first survey the second survey was send to the respondents of the first survey. The response rate was 22% (8) and after reminding the total response rate was 24.3% (9 respondents). This response is enough for research because of the spread of the
P a g e 24 | 45 respondents (every business unit at least 1) and the large sample size resulted in 468 support activities.
3.3.2 The Design Structure Matrix (DSM)
The coupling is measured by using the Design Structure Matrix. In this matrix all the support activities are placed down the side as row headings and across the top as column headings (Yassine, 2004). The interactions, information requiring and information supplying, between activities are mapped in this matrix. In this research two separate matrixes are filled, this is done to keep the borders between the process steps ‘Sign in’ and ‘Placement’ clear.
The activities used for the survey research are also used in this matrix. For filling in these matrixes qualitative interviews are conducted with one RM of every business unit, five interviews in total. This method is used because giving clear and complete information to the participant is important for filling in the matrix in a proper manner. These interviews are conducted with one rayon manager of every business unit. The RM has insight in the sampled activities and the interactions between the support activities, have the ability to understand the research topic better and are also selected for filling in the questionnaires. The selection of the RM, located throughout the Netherlands, is done in a systematic manner for keeping the costs of travelling within limits. Next to this the RM that is interviewed is not asked to fill in the survey for preventing a common method bias. How both of datasets, survey and DSM matrix, are combined is explained in the operationalization of the variable strength of coupling. The native language of the respondents, Dutch, is used for enabling them to better express themselves. The interviews are structured in the following way. 1] First of all a short introduction about the research topic is given, making the interview subject feel ease (Leech, 2002) 2] The sampled activities are ordered in a chronological manner (what activity is performed first), this makes it easier to map the interactions between the activities. The matrix is analyzed and filled in a semi-structured way, walking through the matrix from top to bottom asking the interviewee if the activity requires information from one or more of the other activities. The questions in this interview are standardized to be sure that differences in answers are due to differences of insight of respondents rather than influenced by the questions asked (Gordon, 1975) 3] The filled matrix is than summarized mentioning all the interactions between activity the support activities, so that the respondent can think about the given answers again.
3.4 Operationalization of the variables
P a g e 25 | 45
3.4.1 The delivery mode
As depicted in the theoretical background the delivery mode is a two dimensional variable, the shared - and the non-shared delivery mode. In a shared delivery mode the support activity is performed by ShareCom and in the non-shared delivery mode the business unit performs the activity. Data on the delivery mode of the sampled activities is gathered during the reviews of the list of activities, these knowledge carriers have insight in the activities and who performs it. In this research the shared delivery mode is coded as 1 and the non-shared delivery mode as 0.
3.4.2 Differentiation in needs
According to Joshi and Sharma (2004) an explanation for product failure is that products do not reflect customer preferences. In this explanation two reasons are mentioned; customer
preferences are not verified enough and preferences have changed over time. The generation variety index is also about the customer knowledge that needs to be known for differentiating preferences in a specific moment in time, thus also over time (Hofman and Meijerink, in press; Martin and Ishii, 2002). The construct of Joshi and Sharma (2004) and Hofman and Meijerink (in press) is used for measuring the differentiation in needs. Like in the research of Hofman and Meijerink (in press), a survey is held and the questions are repeated for every support activity in the sample. The answers are based on a five-point Likert scale (1= ‘strongly disagree’ to 5 = ‘strongly agree’). The bivariate inter-item correlation is 0,640 (p < 0.01) with a reliability of 0.781, this is an acceptable level (0.8 > α ≥ 0.7).
Variable indicators:
Question 1: The needs of your business unit, with respect to the activities mentioned below, are constantly subject to change (change from time to time)
Dutch: Stelling: De eisen van uw label, ten aanzien van de onderstaande
activiteiten, zijn voortdurend aan verandering onderhevig (veranderen van tijd tot tijd)
Question 2: Your business unit has, with respect to the activities mentioned below, a wide range of (different) needs
Dutch: Stelling 2: Uw label heeft, ten aanzien van de onderstaande activiteiten, zeer uiteenlopende (verschillende) eisen
3.4.3 Strength of coupling
According to Vanderfeesten, Reijers and van der Aalst (2008) coupling is measured by the number of interconnections among, in our case, information receiving activities. In this research the Design Structure Matrix is used for measuring the coupling (Carracascosa, Eppinger and Whitney, 1998; Yassine, 2004). In the matrix all the support activities are placed down the side as row headings (information requiring) and across the top as column headings (information supplying) (Yassine, 2004). In figure 3.1 an example of the matrix is given.
No coupling Sequential Reciprocal
Supplying Supplying Supplying
R
equi
ri
ng A B
R
equi
ri
ng A B
R
equi
ri
ng A B
A A A 1
[image:26.612.71.380.627.704.2]B B 1 B 1
P a g e 26 | 45 In the matrix the interactions are marked with a 1 and fields that do not indicate interactions are left empty. For example in the sequential strength of coupling activity B (IRSA) requires
information from activity A (ISSA) and is marked with a 1. The diagonal fields do not have any interpretation for the activities, these fields are blacked out. The dataset of strength of coupling is gathered in interviews with one rayon manager of every business unit and by surveys conducted with one or more RM of every business unit. The strength of coupling is measured by combining the data from the survey and the DSM matrix. The survey research gives insight in the
differentiation in needs and perceived value of every support activity in the research and the coupling gives insight in the interactions with one another of every support activity. Because only one RM of every business unit is interviewed for filling in the DSM matrix, it is necessary to use one DSM matrix for more surveys that returned from a business unit. This enables us to calculate the strength of coupling for the total sample. The differentiation in needs of every activity is added to the column headings, the ISSA’s, as a figure. For every activity (row heading) the total differentiation in needs of the ISSA’s supplying information to one IRSA is summed up. Furthermore the differentiation in needs of the IRSA itself is added to this, leading to the following calculation: Strength of coupling = (ISSAdiff+ISSAdiff+…+ISSAdiff) + IRSAdiff. The strength of coupling of every activity is added to the dataset in SPSS as a variable.
3.4.4 Perceived value by the business units
The perceived value by the business units is conceptualized in terms of service costs and service quality. Perceived value raises when service quality of support activities improves and/or the costs drop. Service quality is the perceived value of the business units in relation to their needs and service costs (Maatman et al., 2010). The service costs are expressed in monetary (the prices paid) and non-monetary (time and effort invested by the business units). The conceptualization is the ratio between what is given (costs) and what is received (quality) (Cronin, 2000; Zeithaml, 1988). Like Hofman and Meijerink (in press) the perceived value is measured by giving a description of the support activity and asking the same questions for all of these activities. The answers are based on a five-point Likert scale (1= ‘strongly disagree’ to 5 = ‘strongly agree’). The bivariate inter-item correlation is 0.335 (p < 0.01) with a reliability of 0.502, where 0.6 > α ≥ 0.5 has a poor is a poor although acceptable reliability.
Variable indicators:
Question 1: Overall your label appreciates the execution of the following activities as very high
Dutch: Stelling: Overall waardeert uw label de uitvoering van de onderstaande activiteiten als zeer hoog
Question 2: In relation to the overall costs, time and effort, the execution of this activity satisfies the needs of your label very well
Dutch: Stelling: In verhouding tot de kosten, tijd en inspanning voldoet de uitvoering van de onderstaande activiteiten zeer goed aan de verwachtingen van uw label
3.4.5 Control variable: Job tenure