ORIGINAL RESEARCH
ADULT BRAIN
Moving Toward a Consensus DSC-MRI Protocol: Validation of a
Low–Flip Angle Single-Dose Option as a Reference Standard
for Brain Tumors
XK.M. Schmainda,XM.A. Prah,XL.S. Hu,XC.C. Quarles,XN. Semmineh,XS.D. Rand,X J.M. Connelly,XB. Anderies,XY. Zhou, XY. Liu,XB. Logan,XA. Stokes,XG. Baird, andXJ.L. Boxerman
ABSTRACT
BACKGROUND AND PURPOSE: DSC-MR imaging using preload, intermediate (60°) flip angle and postprocessing leakage correction has gained traction as a standard methodology. Simulations suggest that DSC-MR imaging with flip angle⫽30° and no preload yields relative CBV practically equivalent to the reference standard. This study tested this hypothesis in vivo.
MATERIALS AND METHODS: Eighty-four patients with brain lesions were enrolled in this 3-institution study. Forty-three patients satis-fied the inclusion criteria. DSC-MR imaging (3T, single-dose gadobutrol, gradient recalled-echo–EPI, TE⫽20 –35 ms, TR⫽1.2–1.63 seconds) was performed twice for each patient, with flip angle⫽30°–35° and no preload (P⫺), which provided preload (P⫹) for the subsequent intermediate flip angle⫽60°. Normalized relative CBV and standardized relative CBV maps were generated, including postprocessing with contrast agent leakage correction (C⫹) and without (C⫺) contrast agent leakage correction. Contrast-enhancing lesion volume, mean relative CBV, and contrast-to-noise ratio obtained with 30°/P⫺/C⫺, 30°/P⫺/C⫹, and 60°/P⫹/C⫺were compared with 60°/P⫹/C⫹ using the Lin concordance correlation coefficient and Bland-Altman analysis. Equivalence between the 30°/P⫺/C⫹and 60°/P⫹/C⫹ protocols and the temporal SNR for the 30°/P⫺and 60°/P⫹DSC-MR imaging data was also determined.
RESULTS:Compared with 60°/P⫹/C⫹, 30°/P⫺/C⫹had closest mean standardized relative CBV (P⫽.61), highest Lin concordance correlation coefficient (0.96), and lowest Bland-Altman bias (⫽1.89), compared with 30°/P⫺/C⫺(P⫽.02, Lin concordance correlation coefficient⫽0.59, ⫽14.6) and 60°/P⫹/C⫺(P⫽.03, Lin concordance correlation coefficient⫽0.88,⫽ ⫺10.1) with no statistical difference in contrast-to-noise ratios across protocols. The normalized relative CBV and standardized relative CBV were statistically equivalent at the 10% level using either the 30°/P⫺/C⫹or 60°/P⫹/C⫹protocols. Temporal SNR was not significantly different for 30°/P⫺and 60°/P⫹(P⫽.06).
CONCLUSIONS: Tumor relative CBV derived from low–flip angle, no-preload DSC-MR imaging with leakage correction is an attractive single-dose alternative to the higher dose reference standard.
ABBREVIATIONS:C⫺ ⫽postprocessing without contrast agent leakage correction; C⫹ ⫽postprocessing with contrast agent leakage correction; LCCC⫽Lin concordance correlation coefficient; nRCBV⫽normalized relative CBV; P⫺ ⫽a preload of contrast agent was not administered; P⫹ ⫽a preload of contrast agent was administered; rCBV⫽relative CBV; sRCBV⫽standardized relative CBV
D
SC-MR imaging measurement of relative cerebral blood vol-ume (rCBV) is the most commonly used approach for brain tumor perfusion imaging, with numerous studies demonstrating its value to predict glioma grade, overall survival, and response totreatment.1-8Yet, widespread adoption of DSC-MR imaging for
clinical trials and daily practice has been impeded by lack of agree-ment on the best data collection and analysis methodology, in-cluding the choice of the preload dose to mitigate the effects of contrast agent extravasation, bolus contrast-agent dose, flip angle, TE, and the use of postprocessing leakage correction. In response, Received November 13, 2018; accepted after revision January 18, 2019.
From the Departments of Biophysics (K.M.S., M.A.P.), Radiology (K.M.S., S.D.R.), Neurology (J.M.C.), and Division of Biostatistics, Institute for Health and Society (Y.L., B.L.), Medical College of Wisconsin, Milwaukee, Wisconsin; Departments of Radiology (L.S.H., Y.Z.) and Neurosurgery (B.A.), Mayo Clinic, Scottsdale, Arizona; Division of Imaging Research (C.C.Q., N.S., A.S.), Barrow Neurological Institute, Phoenix, Arizona; and Department of Diagnostic Imaging (J.L.B., G.B.), Rhode Island Hospital and Warren Alpert Medical School of Brown University, Providence, Rhode Island.
This work was supported by National Institutes of Health/National Cancer Insti-tute: U01 CA176110 (K.M.S., M.A.P., S.D.R., J.M.C.), R01 CA 082500 (K.M.S., M.A.P., S.D.R., J.M.C.), U01 CA180820 (J.L.B., G.B.), R01 CA158079 (C.C.Q.), R01 CA221938 (K.M.S., C.C.Q., L.S.H., J.L.B.), R01 CA213158 (A.S.), ADHS16-162414 (A.S.), R01 CA213158 (N.S.), and U01 CA220378 (L.S.H.).
Paper previously presented, in part, at: International Society of Magnetic Reso-nance in Medicine Annual Meeting and Exhibition and 35th Annual Scientific Meet-ing of the Congress of European Society of Magnetic Resonance in Medicine and Biology, June 16 –22, 2018, Paris, France; and Annual Meeting of the American Soci-ety of Neuroradiology and the Foundation of the ASNR Symposium, June 2–7, 2018, Vancouver, British Columbia, Canada.
Please address correspondence to Kathleen M. Schmainda, PhD, Medical College of Wisconsin, Department of Biophysics, 8701 W Watertown Plank Rd, Milwaukee, WI 53226; e-mail: [email protected]
Indicates open access to non-subscribers at www.ajnr.org
a study was performed to compare the most commonly published approaches for the determination of brain tumor rCBV9; the
re-sults were that for single-echo methodologies, the approach using full-dose contrast agent preload and postprocessing leakage cor-rection proved best. This result was confirmed by several subse-quent studies,1,2,10-12including a recent multicenter study
show-ing excellent concordance across sites for the analysis of DSC-MR imaging data acquired with a full-dose preload and bolus.13
Continued effort toward harmonization includes a recent American Society of Functional Neuroradiology white paper rec-ommending a 60°–70° flip angle, field-strength-dependent TE, and one-fourth-to-full-dose preload with a full-dose bolus.14Yet
a more recent constraint is that DSC-MR imaging paradigms comply with the standardized brain tumor imaging protocol,15
requiring postcontrast imaging to be performed after 1 full dose of gadolinium-based contrast agent, either split between the preload and DSC-MR imaging bolus before postcontrast imaging or given fully as a preload with variable-bolus-dose DSC-MR imaging after postcontrast imaging.
To further assist effort toward DSC-MR imaging harmoniza-tion, two independent studies using sophisticated computer simulations were recently performed,16,17one of which used a
glioblastoma-trained digital reference object permitting an ex-haustive search of many possible combinations of acquisition pa-rameters under a range of simulated physiologic conditions.17
This search revealed that the American Society of Functional Neuroradiology parameters with flip angle⫽60° and TE⫽30 ms had excellent accuracy and precision at both 1.5T and 3T for sin-gle-dose preload and bolus, but substantially degraded mance for fractional dosing schemes, and especially poor perfor-mance without preload. However, DSC-MR imaging without preload but with a comparatively lower flip angle (30°) and a midrange TE (30 ms at 3T) performed nearly as well as the dou-ble-dosing scheme, but also very well for fractional dosing schemes and even without using any preload dose.
While this theory is promising, data are lacking to support it.
Therefore, this study aimed to confirm these simulation results in vivo and to determine whether single-dose, low–flip angle DSC-MR imaging without pre-load gives rCBV estimates practically equivalent to double-dose, intermediate– flip angle DSC-MR imaging with full-dose preload and bolus in patients with contrast-enhancing brain lesions, including gliomas. Adoption of this protocol would eliminate preload trast agent injection and reduce con-trast agent usage.
MATERIALS AND METHODS
PatientsAll participants provided written, in-formed consent according to institu-tional review board policy in this Health Insurance Portability and Accountabil-ity Act– compliant study. Patients diag-nosed with a brain tumor or vascular malformation who were scheduled for a clinically indicated DSC-MR imaging were con-sidered for inclusion in this 3-institution (Medical College of Wis-consin, Rhode Island Hospital, Mayo Clinic Arizona) prospective study. The lesion was required to be at least 1 mL, and the DSC-MR imaging data had to be of sufficient quality with a dis-cernable signal transient without large motion artifacts to ensure a robust comparison between DSC methods as applied to lesion tissue only.
Imaging
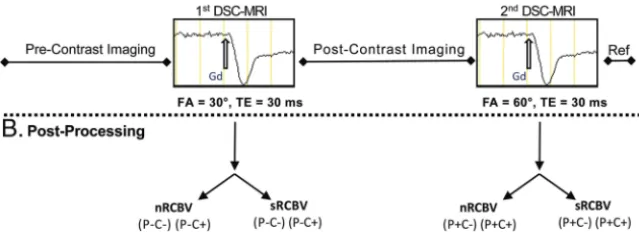
All studies were performed on 3T MR imaging systems (MAGNE-TOM Skyra (Siemens, Erlangen, Germany), MAGNE(MAGNE-TOM Verio (Siemens, Erlangen, Germany), PET/MR (GE Healthcare, Mil-waukee, Wisconsin) and two Discovery 750W systems (GE Healthcare, Milwaukee, Wisconsin).Figure 1Adepicts the image-acquisition protocol. Following standard precontrast FLAIR and T1-weighted spin-echo imaging, we performed low–flip angle (30°) DSC-MR imaging (gradient recalled-echo EPI, TE/TR⫽ 20 –35 ms/1200 –1630 ms) without contrast agent preload (P⫺) using a bolus injection of 0.1 mmol/kg of gadobutrol (Gadavist; Bayer Schering Pharma, Berlin, Germany). Additional DSC-MR imaging scan parameters included the following: FOV⫽220 mm, matrix⫽96⫻96 or 128⫻128, slice thickness⫽4 –5 mm, skip⫽ 0 mm. Subsequently postcontrast T1-weighted images were ob-tained according to the clinical protocol of each site, and a second DSC-MR imaging was performed using an intermediate flip angle (60°) and otherwise identical acquisition parameters. The time between the first and second DSC-MR imaging study was 5– 8 minutes. By virtue of the acquisition order, the second DSC-MR imaging was performed with a contrast agent preload (P⫹) pro-vided by the first DSC-MR imaging bolus. For both DSC-MR imaging datasets, 120 time points were collected and gadobutrol was bolus-injected (3–5 mL/s) after 40 – 60 baseline images. When the DSC-MR slices were not an exact subset of the T1-weighted image slices, an additional T1-weighted “reference” scan was ob-FIG 1. Acquisition protocol with postprocessing options.A, After precontrast standard imaging is
[image:2.594.56.376.62.178.2]tained using a slice prescription (orientation and spacing) match-ing the DSC-MR imagmatch-ing examination for ease of coregistermatch-ing the DSC-MR images to the anatomic images.
Image Analysis
All imaging data were anonymized and postprocessed at a central site (Medical College of Wisconsin) using OsiriX Imaging Soft-ware (http:// www.osirix-viewer.com) with IB NeuroTMand IB Delta SuiteTMplugins (Imaging Biometrics, Elm Grove, Wiscon-sin). Both normalized (nRCBV) to normal-appearing white mat-ter (NAWM) and standardized (sRCBV)18maps were created.
The NAWM ROI, selected by 1 person (M.A.P.), comprised two 8-mm-diameter circular ROIs placed on 2 separate image slices at the midventricular level within the normal brain near the frontal horns of the lateral ventricles. When this area was abnormal, the ROIs were drawn near the occipital horns. Standardization is a unique machine-learned calibration rule19that yields
quantita-tive rCBV maps with consistent values across time and patients.20
Unlike nRCBV, the creation of sRCBV does not require the de-termination of a reference ROI.
Both nRCBV and sRCBV maps were created for DSC-MR im-aging datasets obtained without (C⫺) and with (C⫹) application of Boxerman-Schmainda-Weisskoff leakage correction previ-ously described in detail10and implemented in a vendor-specific
fashion by IB NeuroTM. Therefore, 8 different rCBV maps were created for each subject, including nRCBV and sRCBV for each of 4 conditions: 30°/P⫺/C⫺, 30°/P⫺/C⫹, 60°/P⫹/C⫺, and 60°/P⫹/C⫹.
Using the IB Delta SuiteTM, we defined contrast-enhancing lesion volumes from quantitative dT1 (delta T1) maps, computed from the difference between calibrated and registered post- and precontrast T1-weighted images.21The quantitative dT1 maps
facilitate visualization of the enhancing lesion, free of intrinsically increased T1 signal from blood products or proteinaceous mate-rial. Because dT1 maps are quantitative, a single threshold can be applied to all cases for consistent delineation of contrast-enhanc-ing lesion volume. The DSC-MR imagcontrast-enhanc-ing volume was likewise coregistered to the contrast-enhanced T1-weighted images via the reference scan. The contrast-enhancing lesion volume ROI was transferred to the rCBV maps from which the rCBV mean and standard error of the mean could be determined using the ROI analysis tools available within OsiriX.
Statistical Analysis
Because subjects were their own control, mean estimates were modeled using generalized mixed modeling with sandwich esti-mation, assuming normal and log-normal distributions, in which observations were nested within each patient using SAS/GLIM-MIX (SAS Institute Inc., Cary, North Carolina). Because residuals were heterogeneous (differences increased with increasing con-trast-enhancing lesion volume), a log-normal distribution was also used. As a conservative effort, the Dunnett method was used for multiple comparisons, where P⫹/C⫹was the control to ex-amine whether the alternative approaches deviated significantly. Moreover, a Bonferroni correction was also used, where theP
value was adjusted for 6 comparisons, 0.05/6⫽0.00833. The Lin concordance correlation coefficients (LCCCs) and
Bland-Altman plots were calculated across all subjects for nRCBV and sRCBV obtained with 30°/P⫺/C⫺, 30°/P⫺/C⫹, and 60°/ P⫹/C⫺ protocols relative to the reference standard (60°/P⫹/ C⫹). Unlike intraclass or Pearson correlation coefficients, the LCCC provides a measure of both accuracy (deviation from the line of equality) and precision (deviation from best-fit line) rather than precision alone.
For methods showing strong agreement with the reference standard, a statistical equivalence test was performed. An equiva-lence test begins with the null hypothesis that the two tests are not equivalent, but if the 95% CI is contained in the margin, then the null is rejected and equivalence is confirmed for the chosen margins.
The contrast-to-noise ratio was also calculated across all sub-jects for nRCBV and sRCBV obtained with 30°/P⫺/C⫺, 30°/P⫺/ C⫹, and 60°/P⫹/C⫺protocols relative to the reference standard (60°/P⫹/C⫹), as follows:
CNR⫽关x⫺y] /[x2⫹y2]1/2,
whereand are the mean and SD of the ROI and x and y designate tumor and white matter, respectively. As a final com-parison of acquisition methods, the temporal signal-to-noise ra-tio (tSNR) was determined as follows:
tSNR⫽关BL⫺␦BL]/BL,
where,, and␦are the mean, SD, and minimum of the baseline (BL) signal time points used for the rCBV calculations. The paired Studentttest was used to compare the mean contrast-to-noise ratio with the reference standard and tSNR between the 30° and 60° acquisitions.
RESULTS
Since January 2017, eighty-four subjects from 3 institutions have been enrolled in this study. Of these, 41 were excluded from anal-ysis because of contrast-enhancing lesion volume⬍1 mL (n⫽35) or the DSC-MR imaging image quality being insufficient for anal-ysis (n⫽6). The diagnoses for the remaining patients (n⫽43) were grade IV glioblastoma (n⫽29) and fibrillary and gemisto-cytic astrocytoma (n⫽1); grade III anaplastic astrocytoma (n⫽
4) and anaplastic oligodendroglioma (n⫽1); high-grade glioma with treatment effect (n⫽1); grade II oligodendroglioma (n⫽1) and astrocytoma with treatment effect (n⫽1); grade II atypical meningioma (n⫽1); cavernous malformation (n⫽1); and me-tastases (n⫽3).
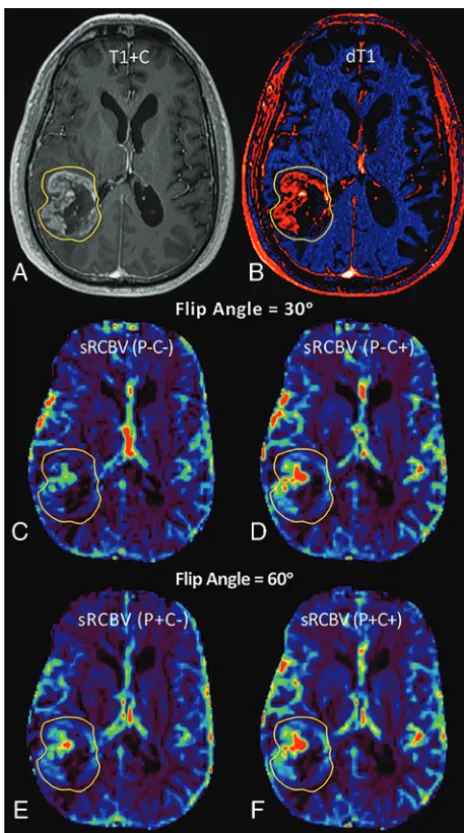
Sample images and parameter maps for a patient with glioblas-toma are shown inFig 2. The sRCBV maps are qualitatively sim-ilar for the 30°/P⫺/C⫹(Fig 2D) and 60°/P⫹/C⫹protocols (Fig 2F).
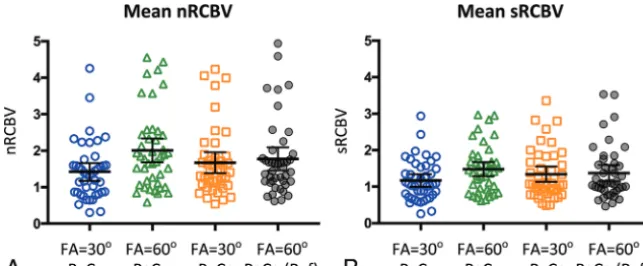
The results from all analyses are listed inTables 1–3and plot-ted inFigs 3–5.Table 1gives the rCBV statistics for each of the 8 acquisition/postprocessing protocols and thePvalue indicating whether the mean rCBV is significantly different from the 60°/ P⫹/C⫹reference. The mean rCBV data are shown inFig 3for both nRCBV (Fig 3A) and sRCBV (Fig 3B). The sRCBV using the 30°/P⫺C⫹protocol was not significantly different from the ref-erence (P⫽.61), while the nRCBV was borderline different (P⫽
There was excellent/substantial agreement22,23between the
30°/P⫺/C⫹protocol and the reference standard (60°/P⫹/C⫹), with LCCC values of 0.952 and 0.960 for nRCBV and sRCBV, respectively (Table 2). The nRCBV and sRCBV LCCC values were
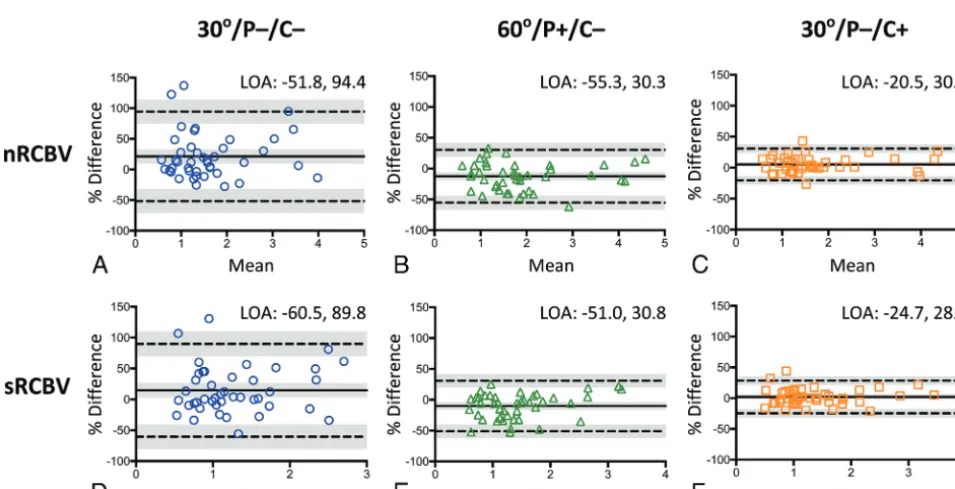
much lower for the 30°/P⫺/C⫺(0.648, 0.588) and 60°/P⫹/C⫺ (0.884, 0.877) protocols. These results are depicted inFig 4, with a Deming regression line and the identity line for reference. There was substantial improvement in the concordance provided by postprocessing leakage correction based on the sizable increase in LCCC between 30°/P⫺/C⫺and 30°/P⫺/C⫹for both nRCBV and sRCBV. Likewise, the Bland-Altman plots (Fig 5) and associ-ated bias values (Table 3) demonstrate that 30°/P⫺/C⫹yielded substantially improved limits of agreement with minimal bias (⫽1.89) compared with 30°/P⫺/C⫺and 60°/P⫹/C⫺ proto-cols (14.64 and⫺10.13, respectively) for sRCBV, with similar results for nRCBV.
Equivalence of the 2 measurements (30°/P⫺/C⫹versus 60°/ P⫹/C⫹) was determined for a⫾10% change at a significance level of .01. For nRCBV and sRCBV, the difference of measure-ments (30°/P⫺/C⫹ versus 60°/P⫹/C⫹) in the log scale was ⫺0.0517⫾0.132 and⫺0.0191⫾0.136, respectively. The 95% CIs for percentage change for 30°/P⫺/C⫹ compared with 60°/ P⫹/C⫹were (⫺9.12% to,⫺1.11%) for nRCBV and (⫺5.92%, ⫺2.31%) for sRCBV. ThePvalues of rejecting the 1-sided null hypothesis (H0: 30°/P⫺/C⫹ ⬍90% of 60°/P⫹/C⫹) were .00531 for nRCBV and .0000782 for sRCBV, indicating equivalence be-tween the methods.
For all protocols, there was no statistically significant differ-ence between the tumor-to-white matter contrast-to-noise ratio with respect to the reference. The temporal SNR of the DSC-MR imaging signal was not significantly different between the 30°/P⫺ and 60°/P⫹acquisitions for white matter (P⫽.35), trended to-ward significance for tumor (P⫽.06), and was significantly dif-ferent for gray matter (P⫽.008) with mean temporal SNRs of 2.11 and 2.22 for the 30°/P⫺/C⫹and 60°/P⫹/C⫹conditions, respectively.
DISCUSSION
This study confirms the theoretic conjecture of recent simula-tions16,17,24and demonstrates in vivo that low–flip angle,
no-preload DSC-MR imaging has excellent/substantial concor-dance22,23with full-dose preload-based, intermediate–flip angle
DSC-MR imaging and should be considered for consensus pro-tocol recommendation. It uses less contrast agent and requires fewer contrast agent injections, eliminating the potential error due to variable preload dosing and timing schemes. However, postprocessing leakage correction is impactful and essential, even for low–flip angle acquisitions with less T1-weighting.
Historically, a higher flip angle (90°) was commonly used for DSC-MR imaging. This was largely motivated by early studies using spin-echo25-27or combined
spin-echo plus gradient-spin-echo1,2,28 EPI
se-quences, in which a higher flip angle pre-served the SNR. Alternative gradient-echo approaches using a lower flip angle (30°–35°) diminished T1 contamination effects due to contrast agent extravasa-tion; however, longer TEs (ie, 54 ms) were typically chosen to maintain T2* sensitivity to the susceptibility effect in-duced by the passage of contrast agent FIG 2. Images and sRCBV parameter maps from a patient with
[image:4.594.53.285.102.518.2]glio-blastoma. Shown are the post-contrast T1-weighted (T1⫹C) (A) and quantitative dT1 (B) images with the corresponding sRCBV maps ob-tained from the first DSC-MR imaging contrast dose (CandD) without preload (P⫺) and without leakage correction (C⫺) and without pre-load (P⫺) plus leakage correction (C⫹). The sRCBVs obtained during the second contrast dose (EandF) and thus after the preload are shown without (P⫹C⫺) and with (P⫹C⫹) leakage correction.
Table 1: Mean rCBV in reference to flip angleⴝ60o/Pⴙ/Cⴙ
Parameter/Metric 30o(P−C−) 30o(P−C+) 60o(P+C−) 60o(P+C+)
nRCBV
Mean 1.42⫾0.79 1.67⫾0.93 2.01⫾1.06 1.77⫾1.03
95% CI 1.18–1.66 1.39–1.96 1.68–2.34 1.46–2.09
Pvalue .003 .06a .002 NA
sRCBV
Mean 1.17⫾0.55 1.34⫾0.68 1.48⫾0.64 1.37⫾0.73
95% CI 1.0–1.34 1.13–1.55 1.28–1.68 1.15–1.60
Pvalue .05 .61a .07 NA
Note:—NA indicates not applicable.
[image:4.594.51.375.619.714.2]bolus.29,30Comparative rCBV data from brain tumors indicated
that low–flip angle, long-TE approaches were suboptimal for dis-tinguishing high-grade tumor from normal-appearing brain9and
often required manual identification of rCBV “hot spots” to ob-tain clinically relevant results. Instead, preload-based DSC-MR imaging using intermediate-to-high flip angles with a minimum TE and postprocessing leakage correction was found to work best.9Yet a systematic exploration of the
image-acquisition-parameter space aimed at maximizing the DSC-MR imaging signal while minimizing contrast agent leakage effects had not been performed until recently. We considered 60°/P⫹/C⫹to be the reference standard because its utility,1,2reliability,20and
accuracy9,12 have been repeatedly proved in multiple
treat-ment and outcomes studies,4-6,31including those with spatially
correlated tissue samples8,11,32and recent simulations as
de-scribed above.16,17,24
For this study, the⫾10% difference chosen for the test of equivalence is clinically justified because clinically relevant rCBV changes of⬎10% have been frequently reported. For example, it was shown that for patients treated with topotecan, the percent-age change in rCBV at 1 month for those with progressive disease was⫹12% versus⫺29% for those with nonprogressive disease (P⫽.02).33Similarly, after treatment with
radiation-temozolo-mide, patients with pseudoprogression had a mean decrease in rCBV of 41% and those with true progression had a mean increase in rCBV of 12%.34In addition, in a multicenter clinical trial,5all
patients with a statistically significant survival advantage had a mean decrease in rCBV of 53% measured at 2 weeks after starting treatment with bevaci-zumab. Finally, another indication that the 10% margin is indicative of excellent agreement is the previously reported repeatability of the intermediate–flip angle technique (repeatability coeffi-cient⫽1.78),20measured twice within a
few days, which is worse than the esti-mated agreement in this study between the leakage-corrected low–flip angle and intermediate–flip angle techniques (re-peatability coefficient⫽0.59).
The ability to obtain comparable rCBV measurements with up to 50% less contrast agent is a step toward addressing concerns regarding the use of suprastandard (⬎0.1 mmol/kg) contrast agent dosing. This is important due to recent restrictions imposed by the FDA on the use of gadolinium-based contrast agents due to the small-but-real risk of nephro-genic systemic fibrosis35and more recent concerns regarding
gad-olinium deposition in the brain.36 Single-dose, low–flip angle
methodology also improves the likelihood of performing DSC-MR imaging more routinely on both adult and pediatric patients because it would require no extra contrast agent beyond standard dosing for conventional T1-weighted postcontrast im-aging and could be acquired during the standard bolus injection of contrast agent.
In addition to reducing the contrast agent dose, the low–flip angle, no-preload protocol eliminates the potential for vari-ability in measured rCBV resulting from variations in contrast agent incubation time. Hu et al11demonstrated that with an
incubation time of 5– 6 minutes between a single or half-dose preload and bolus injection, rCBV could distinguish posttreat-ment-related enhancement from recurrent tumor. However, other than simulations showing little dependence of rCBV on incubation time,16,17,24there are no other in vivo data
address-ing the potential influence of incubation time on rCBV mea-surements. By not using any preload, the low–flip angle proto-col eliminates the chance that measured rCBV fluctuations due FIG 3. Normalized and standardized mean rCBV results. Mean nRCBV (A) and sRCBV (B) for each
of the acquisition/postprocessing conditions without/with preload (P⫺/P⫹) and without and with leakage correction (C⫺/C⫹).
Table 2: Lin concordance correlation coefficient (LCCC) and Deming equations
nRCBV sRCBV
LCCC Slope CI Equation (Deming) LCCC Slope CI Equation (Deming)
P⫺C⫺ 0.648 (0.48–0.90) y⫽0.69⫻x⫹0.19 0.588 (0.41–0.90) y⫽0.65⫻x⫹0.27
P⫺C⫹ 0.952 (0.82–0.98) y⫽0.90⫻x⫹0.07 0.960 (0.85–1.01) y⫽0.93⫻x⫹0.07
P⫹C⫺ 0.884 (0.88–1.19) y⫽1.04⫻x⫹0.17 0.877 (0.73–0.99) y⫽0.86⫻x⫹0.30
Table 3: Bland-Altman results
Metric
nRCBV sRCBV
P−C− P−C+ P+C− P−C− P−C+ P+C−
Bias 21.34 5.14 ⫺12.48 14.64 1.89 ⫺10.13
95% CI (9.9–32.8) (1.1–9.2) (⫺5.8 to⫺19.2) (2.8–26.4) (⫺2.3–6.1) (⫺3.7 to⫺16.6)
SD bias 37.29 13.08 21.85 38.35 13.56 20.86
Lower LOA ⫺51.75 ⫺20.49 ⫺55.31 ⫺60.52 ⫺24.68 ⫺51.01
Upper LOA 94.43 30.78 30.34 89.79 28.46 30.75
[image:5.594.54.376.237.370.2]to inadvertent differences in incubation time could be mis-taken for true differences in tumor rCBV.
The complete elimination of the preload dose would be an important advancement for efforts to harmonize DSC-MR imag-ing acquisitions. Balancimag-ing the experimentally proven benefit of preload with the goal of maintaining total contrast dose near sin-gle-dose levels (0.1 mmol/kg) has resulted in several disparate dosing protocols. While many studies have reported clinically rel-evant results using a single-dose preload,9,11others have used
fractional preload doses consistent with the American Society of Functional Neuroradiology recommendation14but unproven
ex-perimentally. Additionally, in an effort to comply with the con-trast agent dosing and timing required for the consensus brain tumor imaging protocol,15some have chosen to split the single
dose between the preload and bolus dose, again without experi-mental evidence to justify this choice. Given the recent simulation results,16,17,24there is concern that split-dose protocols will yield
suboptimal rCBV estimations, potentially impacting decisions re-FIG 4. The Lin concordance correlation (LCCC) results, including Deming regression (solid lines), for normalized rCBV (A–C) and standardized rCBV (D–F) for each of the preload (P) and leakage-correction (C) conditions in reference to the 60°/P⫹/C⫹condition. The 30°/P⫺/C⫹ condition for both nRCBV (C) and sRCBV (F) has the best concordance. FA indicates flip angle.
[image:6.594.52.539.53.289.2] [image:6.594.53.531.332.576.2]garding the efficacy of clinical trials and the utility of rCBV as a treatment-response biomarker. Therefore, this study motivates adoption of a single-dose, no-preload protocol that would over-come current limitations regarding harmonization of DSC-MR imaging acquisition and dosing protocols.
Although several previous studies collected DSC-MR imaging data using a lower flip angle,29,30,37-39these studies also used a
longer TE of approximately 50 ms in an effort to accentuate T2*-weighting. This combination of a low flip angle with intermedi-ate-long TEs may explain why earlier low–flip angle approaches proved less reliable compared with other higher flip angle tech-niques,9which provided clinically relevant results only when
tu-mor hot spots were sampled.39Simulations have also
demon-strated that the combination of a lower flip angle with a longer TE at 3T is less accurate and reliable.17
The temporal SNR was reduced in gray matter for the lower flip angle method, with a statistically significant difference in comparison with the 60°/P⫹/C⫹method. Although no differ-ences were found for white matter and tumor, a reduced SNR must be considered when balancing the benefits of using less con-trast agent with a reduced SNR when using lower flip angle methods.
Additional limitations of this study include a small number of patients and therefore necessitate performing a larger multicenter trial in which a greater range of tumor types and grades are stud-ied. Also, as the simulations predict, low–flip angle methods may be less reliable compared with the preload/higher flip angle meth-ods at 1.5T. Therefore, repeating this study at 1.5T is necessary to confirm the 30°/P⫺/C⫹method as a general replacement for the reference standard 60°/P⫹/C⫹. Although statistical tests indicate excellent agreement, further evaluation of the repeatability of these methods and their ability to predict clinical outcomes are required. Finally, the results of this study were obtained using a single postprocessing platform. Thus, equivalent results obtained with other platforms cannot be guaranteed solely on the basis of the results reported here.
CONCLUSIONS
This study provides experimental evidence showing that rCBV can be reliably determined using a single dose of contrast agent and a low–flip angle, no-preload acquisition at 3T.
ACKNOWLEDGMENTS
We thank Cathy Marszalkowski, Radiology Research Coordina-tor, who has played a key role in the recruitment of patients with brain tumor at the Medical College of Wisconsin, and the Robert C. Olson MD Endowment for providing support for Dr Kathleen Schmainda.
Disclosures: Kathleen M. Schmainda—RELATED: Grant: National Institutes of Health/National Cancer Institute,Comments: U01 and R01 grants*;UNRELATED: Grants/Grants Pending: National Institutes of Health,Comments: several grants pending*;Stock/Stock Options: IQ-AI,Comments: ownership interest;Other: IQ-AI, Comments: spouse’s salary. Leland S. Hu—RELATED:Grant: National Institutes of Health,Comments: U01 CA220378, R01 CA221938.* Christopher C. Quarles— RELATED:Grant: National Institutes of Health.**Money paid to the institution.
REFERENCES
1. Donahue KM, Krouwer HGJ, Rand SD, et al.Utility of simultane-ously acquired gradient-echo and spin-echo cerebral blood volume and morphology maps in brain tumor patients.Magn Reson Med 2000;43:845–53CrossRef Medline
2. Schmainda KM, Rand SD, Joseph AM, et al.Characterization of a first-pass gradient-echo spin-echo method to predict brain tumor grade and angiogenesis.AJNR Am J Neuroradiol2004;25:1524 –32
Medline
3. Kong DS, Kim ST, Kim EH, et al.Diagnostic dilemma of pseudopro-gression in the treatment of newly diagnosed glioblastomas: the role of assessing relative cerebral blood flow volume and oxygen-6-methylguanine-DNA methyltransferase promoter methylation status.AJNR Am J Neuroradiol2011;32:382– 87CrossRef Medline
4. Schmainda KM, Prah M, Connelly J, et al.Dynamic-susceptibility contrast agent MRI measures of relative cerebral blood volume pre-dict response to bevacizumab in recurrent high-grade glioma. Neuro Oncol2014;16:880 – 88CrossRef Medline
5. Schmainda KM, Zhang Z, Prah M, et al.Dynamic susceptibility con-trast MRI measures of relative cerebral blood volume as a prognos-tic marker for overall survival in recurrent glioblastoma: results from the ACRIN 6677/RTOG 0625 multicenter trial.Neuro Oncol 2015;17:1148 –56CrossRef Medline
6. Kickingereder P, Wiestler B, Burth S, et al.Relative cerebral blood volume is a potential predictive imaging biomarker of bevaci-zumab efficacy in recurrent glioblastoma.Neuro Oncol2015;17: 1139 – 47CrossRef Medline
7. Hu LS, Eschbacher JM, Heiserman JE, et al.Reevaluating the imag-ing definition of tumor progression: perfusion MRI quantifies re-current glioblastoma tumor fraction, pseudoprogression, and radi-ation necrosis to predict survival. Neuro Oncol 2012;14:919 –30
CrossRef Medline
8. Prah MA, Al-Gizawiy MM, Mueller WM, et al.Spatial discrimina-tion of glioblastoma and treatment effect with histologically-vali-dated perfusion and diffusion magnetic resonance imaging met-rics.J Neurooncol2018;136:13–21CrossRef Medline
9. Paulson ES, Schmainda KM.Comparison of dynamic susceptibility-weighted contrast-enhanced MR methods: recommendations for measuring relative cerebral blood volume in brain tumors. Radiol-ogy2008;249:601–13CrossRef Medline
10. Boxerman JL, Schmainda KM, Weisskoff RM. Relative cerebral blood volume maps corrected for contrast agent extravasation sig-nificantly correlate with glioma tumor grade, whereas uncorrected maps do not.AJNR Am J Neuroradiol2006;27:859 – 67Medline
11. Hu LS, Baxter LC, Pinnaduwage DS, et al.Optimized preload leak-age-correction methods to improve the diagnostic accuracy of dy-namic susceptibility-weighted contrast-enhanced perfusion MR imaging in posttreatment gliomas.AJNR Am J Neuroradiol2010;31: 40 – 48CrossRef Medline
12. Boxerman JL, Prah DE, Paulson ES, et al.The role of preload and leakage correction in gadolinium-based cerebral blood volume es-timation determined by comparison with MION as a criterion stan-dard.AJNR Am J Neuroradiol2012;33:1081– 87CrossRef Medline
13. Schmainda KM, Prah MA, Rand SD, et al.Multisite concordance of DSC-MRI analysis for brain tumors: results of a National Cancer Institute Quantitative Imaging Network Collaborative Project. AJNR Am J Neuroradiol2018;39:1008 –16CrossRef Medline
14. Boxerman JL, Shiroishi MS, Ellingson BM, et al.Dynamic suscepti-bility contrast MR imaging in glioma: review of current clinical practice.Magn Reson Imaging Clin N Am2016;24:649 –70CrossRef Medline
15. Ellingson BM, Bendszus M, Boxerman J, et al; Jumpstarting Brain Tumor Drug Development Coalition Imaging Standardization Steer-ing Committee.Consensus recommendations for a standardized brain tumor imaging protocol in clinical trials.Neuro Oncol2015; 17:1188 –98CrossRef Medline
correction algorithms on the fidelity of dynamic-susceptibility contrast MRI estimates of relative cerebral blood volume in glio-mas.AJNR Am J Neuroradiol2017;38:478 – 84CrossRef Medline
17. Semmineh NB, Bell LC, Stokes AM, et al.Optimization of acquisi-tion and analysis methods for clinical dynamic susceptibility con-trast MRI using a population-based digital reference object.AJNR Am J Neuroradiol2018;39:1981– 88CrossRef Medline
18. Bedekar D, Jensen TR, Schmainda KM.Standardization of relative cerebral blood volume (rCBV) image maps for ease of both inter-and intrapatient comparisons.Magn Reson Med2010;64:907–13
CrossRef Medline
19. Nyu´l LG, Udupa JK.On standardizing the MR image intensity scale. Magn Reson Med1999;42:1072– 81CrossRef Medline
20. Prah MA, Stufflebeam SM, Paulson ES, et al.Repeatability of stan-dardized and normalized relative CBV in patients with newly diag-nosed glioblastoma. AJNR Am J Neuroradiol 2015;36:1654 – 61
CrossRef Medline
21. Bedekar D, Jensen T, Rand S, et al.Delta T1 Method: an automatic post-contrast RO1 selection technique for brain tumors.In: Pro-ceedings of the International Society for Magnetic Resonance in Medi-cine,Stockholm, Sweden. May 1–7, 2010
22. Altman DG.Practical Statistics for Medical Research.London: Chap-man and Hall/CRC Texts in Statistical Science Series, Taylor & Francis; 1990
23. McBride GB.A proposal for strength-of-agreeement criteria for Lin’s concordance correlation coefficient. NIWA Client Report: HAM2005– 0622005:62
24. Semmineh NB, Stokes AM, Bell LC, et al.A population-based digital reference object (DRO) for optimizing dynamic susceptibility con-trast (DSC)-MRI methods for clinical trials.Tomography2017;3: 41– 49CrossRef Medline
25. Oh J, Henry RG, Pirzkall A, et al.Survival analysis in patients with glioblastoma multiforme: predictive value of choline-to-N-acety-laspartate index, apparent diffusion coefficient, and relative cere-bral blood volume.J Magn Reson Imaging2004;19:546 –54CrossRef Medline
26. Lev MH, Ozsunar Y, Henson JW, et al.Glial tumor grading and outcome prediction using dynamic spin-echo MR susceptibility mapping compared with conventional contrast-enhanced MR: confounding effect of elevated rCBV of oligodendrogliomas [cor-rected].AJNR Am J Neuroradiol2004;25:214 –21Medline
27. Aronen HJ, Gazit IE, Louis DN, et al.Cerebral blood volume maps of gliomas: comparison with tumor grade and histologic findings. Ra-diology1994;191:41–51CrossRef Medline
28. Schmiedeskamp H, Straka M, Newbould RD, et al.Combined
spin-and gradient-echo perfusion-weighted imaging.Magn Reson Med 2012;68:30 – 40CrossRef Medline
29. Law M, Young RJ, Babb JS, et al.Gliomas: predicting time to pro-gression or survival with cerebral blood volume measurements at dynamic susceptibility-weighted contrast-enhanced perfusion MR imaging.Radiology2008;247:490 –98CrossRef Medline
30. Cha S, Lu S, Johnson G, et al.Dynamic susceptibility contrast MR imaging: correlation of signal intensity changes with cerebral blood volume measurements. J Magn Reson Imaging 2000;11:114 –19
CrossRef Medline
31. Harris RJ, Cloughesy TF, Hardy AJ, et al.MRI perfusion measure-ments calculated using advanced deconvolution techniques predict survival in recurrent glioblastoma treated with bevacizumab. J Neurooncol2015;122:497–505CrossRef Medline
32. Hu LS, Eschbacher JM, Dueck AC, et al.Correlations between per-fusion MR imaging cerebral blood volume, microvessel quantifica-tion, and clinical outcome using stereotactic analysis in recurrent high-grade glioma.AJNR Am J Neuroradiol2012;33:69 –76CrossRef Medline
33. Surapaneni K, Kennedy BC, Yanagihara TK, et al.Early cerebral blood volume changes predict progression after convection-en-hanced delivery of topotecan for recurrent malignant glioma. World Neurosurg2015;84:163–72CrossRef Medline
34. Mangla R, Singh G, Ziegelitz D, et al.Changes in relative cerebral blood volume 1 month after radiation-temozolomide therapy can help predict overall survival in patients with glioblastoma. Radiol-ogy2010;256:575– 84CrossRef Medline
35. Prince MR, Zhang HL, Roditi GH, et al.Risk factors for NSF: a liter-ature review. J Magn Reson Imaging 2009;30:1298 –308CrossRef Medline
36. McDonald RJ, McDonald JS, Kallmes DF, et al.Intracranial gadolin-ium deposition after contrast-enhanced MR imaging.Radiology 2015;275:772– 82CrossRef Medline
37. Cha S.Perfusion MR imaging: basic principles and clinical applica-tions. Magn Reson Imaging Clin N Am2003;11:403–13CrossRef Medline
38. Law M, Cha S, Knopp EA, et al.High-grade gliomas and solitary metastases: differentiation by using perfusion and proton spectro-scopic MR imaging.Radiology2002;222:715–21CrossRef Medline