Probability model to Solve the School Bus Routing Problem with Stops
Selection
Ricardo Pérez-Rodríguez, Arturo Hernández-Aguirre
Center for Mathematics Research CIMAT, AC
[email protected]
Abstract. This paper describes the use of a new algorithm that solves the school bus routing problem with stops selection. The aim is to reduce the travel time of a set of buses that transport students to a school. The fundamental contribution of the authors is the use of a probability model to describe the feasible solution space distribution and thus to get the best solution. An estimation of distribution algorithm is used to address the combinatorial complexity of the problem statement. Different and better results are obtained with the proposed algorithm against a genetic algorithm. The contribution of this paper is to propose an alternative to solve permutation-based representation problems with logistics application.
Keywords: probability model; school bus routing; vehicle routing; genetic algorithm; estimation of distribution algorithm.
1
Introduction
The transportation of students is an important factor in the efficient management of the services offered by the different schools especially when such transportation complexity increases as the number of students to attend. A large number of transport companies and schools in different countries are faced with the transport situation every day for students. Various laws that regulate the way in which students are transported and to where the bus stops can be placed is discussed, approved and modified continuously. The school bus routing problem is a logistics issue that requires more accountability and better service by drivers and the companies that offer the service. Bus stops are constantly changing. As students move or change of degree, it may be necessary to move, add or delete any stop on the route. Security considerations also come into play with the location of stops, for example, whether the bus turns to the right for a pickup or students crossing the street can be critical in making decision the correct location of the stop bus. An additional requirement may be that a stop should be located at a distance of no more than n meters in the direction of each student.
Unlike traditional vehicle routing formulations where there is a set of nodes (vertices) already established, this research focuses on the school bus routing problem where a set of potential bus stops is known. Then, determining the set of bus stops really to use is a part of the formulation in this research. The objective of this problem is (1) finding the set of bus stops to visit, (2) determine for each student what bus stop should be addressed and (3) set the path for the chosen bus stops, so that the total travel time is minimized.
Pérez-Rodríguez and Hernández-Aguirre / Probability model to solve the school bus routing problem with stops selection. IJCOPI, Vol. 7, No. 1, Jan-April 2016, pp. 30-39. ISSN: 2007-1558.
Niu [3] focuses on how to determine an operations schedule for an urban transportation company (a real case) for the peak hours during the morning. An operations schedule at irregular intervals intends to match the demands in terms of time and increase the use of vehicles. This program allows buses depart at times different from each other. In addition, a linear programming model is formulated to minimize the waiting time and costs incurred by the use of vehicles. Finally, a heuristic method based on a genetic algorithm is developed to generate feasible solutions. The representation of the solution is binary and indicates that a bus part or not in the corresponding time point.
Diaz-Parra et al. [4] proposed an application of a bio-inspired algorithm for a school bus routing problem with the features of a single school, urban services, mixed cargo, special students and homogeneous fleet. In this study, each chromosome is represented by a set of numbers. Each number represents a bus stop. The order of the numbers shows a feasible route. A set of test cases were developed by the authors and these cases were resolved by the proposed genetic algorithm.
Other contributions that are virtually in the same direction of current research are Euchi and Mraihi [5], Pacheco et al. [6] and a review of the problem mentioned can be found in Park and Kim [7]. Most of the methods developed for the school bus routing problem with stops selection are characterized by using a sequential approach [2], that is, a selection procedure for the bus stops is followed for a routing process or vice versa. In the first case (selection-routing), it has the drawback of generating more routes than the opposite case (routing-selection). Moreover, the trend of current research is to develop algorithms and iterative search procedures where the process of variation (represented by the cross and mutation operators on the algorithms based-population) has control of the solutions that are generated without having totally clear for the user as such solutions were obtained. Th e random nature of the process of variation makes changes to the existing solutions as a black box approach, whereas in this study the black box approach is avoided, that is, the search process is transparent.
The Estimation of Distribution Algorithms (EDA) is a relatively new paradigm in the field of evolutionary computing. Compared with other evolutionary algorithms, in the EDA the new population is reproduced without using traditional evolutionary operators. In the EDA, a probability model of the most promising area is built with statistical information based on the search experience, and then the probability model is used to generate new individuals. The EDA make use of a probability model to describe the solution space distribution. The updated process of the solution space distribution reflects the tendency of the evolution population (Wang et al. [8]). To describe the solution space distribution, the EDA tries to determine a relationship or interaction between the variables of the problem as its main objective. Traditional evolutionary operators are replaced by a probability model that is built with information about relationships and interactions between the variables of the problem. The main idea is to learn and benefit from interaction between variables by estimating the population distribution and sample new offspring from it. Although the interaction may or may not be present, usually, this is explicitly unknown even for the school bus routing problem. In this investigation, an EDA is proposed in order to improve the sequential selection-routing approach. Finally, although different algorithms have been proposed in order to solve the above problem successfully, in the best of our knowledge, probability models have not been used to address the problem described.
2 Experimental procedures
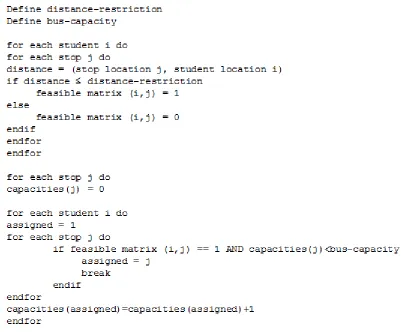
2.1 Allocation
Fig. 1. A method of allocating student-stop.
As an example, Schittekat et al. [2]’s first test is used, which has 5 stops with 25 potential stops to assign students, and where the distance-time restriction is only 5 min. Then given the above procedure a feasible allocation is below
1 1 1 1 1 2 2 2 2 2 3 3 3 3 3 4 4 4 4 4 5 5 5 5 5
Where each number represents the stop assigned to each student.
The second decision concerns the routing procedure. For this research a population of M vectors is initialized with size m, where m is the total number of selected stops. Each vector is initialized as a permutation of selected stops mentioned. A permutation is shown below according to the above example
4 2 5 1
Pérez-Rodríguez and Hernández-Aguirre / Probability model to solve the school bus routing problem with stops selection. IJCOPI, Vol. 7, No. 1, Jan-April 2016, pp. 30-39. ISSN: 2007-1558.
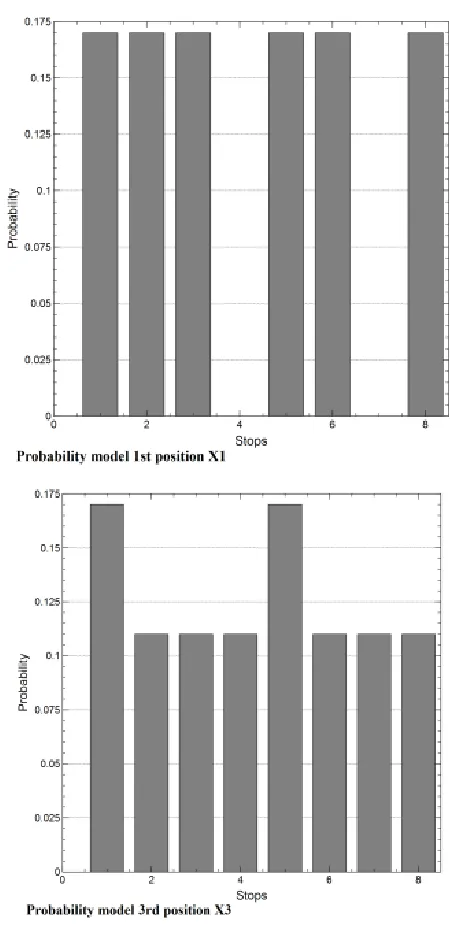
2.3 Probability model
The proposed probability model uses the simplest approach for estimating the joint probability distribution of selected individuals in each generation, pt(x). This joint probability distribution is factored as a product of the univariate marginal
distributions pt(x)=p(x|N)=∏l pt(xl). Each univariate marginal distribution is estimated with marginal frequencies
pt(xl)=∑Nδj(Xi=xi|N)/N where: δj(Xi=xi|N)=1, if the j-th case N, Xi=xi
Figure 2 details an example where for the first position (first column) in the permutation are only six possible stops according to the individuals selected. Therefore, the possible values to choose for the first bus stop on the route (first column) are 2, 3, 4, 6, 7 and 9 and each has a 1 /6 chance of being chosen.
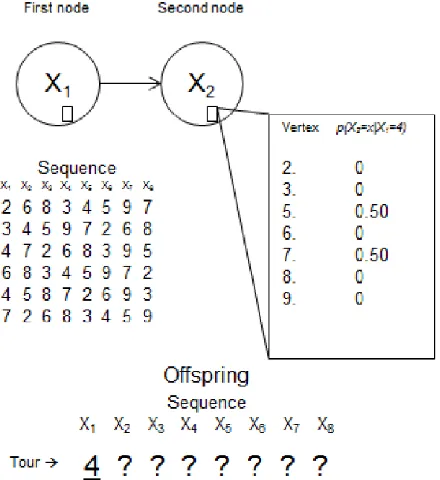
2.4 Sampling
Pérez-Rodríguez and Hernández-Aguirre / Probability model to solve the school bus routing problem with stops selection. IJCOPI, Vol. 7, No. 1, Jan-April 2016, pp. 30-39. ISSN: 2007-1558.
Fig. 3. Update on the probability distribution of the sample.
3 Results
[image:6.612.176.437.499.706.2]Schietekat et al. [2]’s test sets serve as input parameters to show that the sequential selection-routing approach can be improved. A better position to each bus stop in the sequence can be estimated by the probability model. The tests mentioned ranging from 5 stops and 25 students to 800 students and 80 stops. In addition, four maximum walking distances are considered: 5, 10, 20 and 40. The maximum walking distance-time determines the average number of stops that a student is able to walk. From Table 1 to Table 5 include seven columns: the instance (id column), the number of stops (stop column), the number of students (stud column), bus capacity (cap column), the maximum distance-time walk (column wd), the shortest travel time obtained with a genetic algorithm used as comparative (GA column), and the proposed EDA (EDA column). Table 1 provides details on the results for 5 potential stops. From Table 1 can see how the probability model is able of detecting competitive sequences than the genetic algorithm for the problem stated.
Table 1. Comparative results for 5 potential stops
id stop stud cap wd GA EDA
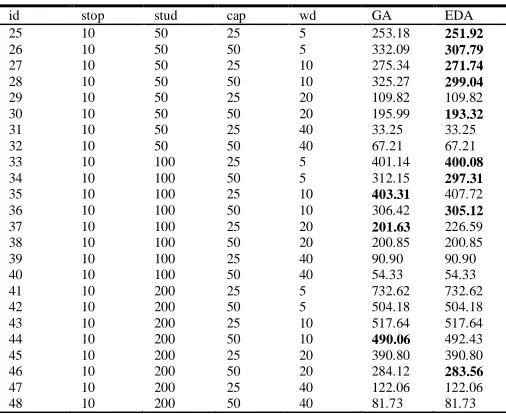
Table 2 provides information on the results when there are 10 potential stops. From Table 2 can see how the probability model is able to detect competitive sequences and sometimes getting less time than the genetic algorithm.
Table 2. Comparative results for 10 potential stops
id stop stud cap wd GA EDA
25 26 27 28 29 30 31 32 33 34 35 36 37 38 39 40 41 42 43 44 45 46 47 48 10 10 10 10 10 10 10 10 10 10 10 10 10 10 10 10 10 10 10 10 10 10 10 10 50 50 50 50 50 50 50 50 100 100 100 100 100 100 100 100 200 200 200 200 200 200 200 200 25 50 25 50 25 50 25 50 25 50 25 50 25 50 25 50 25 50 25 50 25 50 25 50 5 5 10 10 20 20 40 40 5 5 10 10 20 20 40 40 5 5 10 10 20 20 40 40 253.18 332.09 275.34 325.27 109.82 195.99 33.25 67.21 401.14 312.15 403.31 306.42 201.63 200.85 90.90 54.33 732.62 504.18 517.64 490.06 390.80 284.12 122.06 81.73 251.92 307.79 271.74 299.04 109.82 193.32 33.25 67.21 400.08 297.31 407.72 305.12 226.59 200.85 90.90 54.33 732.62 504.18 517.64 492.43 390.80 283.56 122.06 81.73
[image:7.612.179.433.386.594.2]Table 3 details the results when there are 20 potential stops. According to the Table 3, the probability model is able to detect competitive sequences and many occasions getting less time than the genetic algorithm.
Table 3. Comparative results for 20 potential stops
id stop stud cap wd GA EDA
49 50 51 52 53 54 55 56 57 58 59 60 61 62 63 64 65 66 67 68 69 70 71 72 20 20 20 20 20 20 20 20 20 20 20 20 20 20 20 20 20 20 20 20 20 20 20 20 100 100 100 100 100 100 100 100 200 200 200 200 200 200 200 200 400 400 400 400 400 400 400 400 25 50 25 50 25 50 25 50 25 50 25 50 25 50 25 50 25 50 25 50 25 50 25 50 5 5 10 10 20 20 40 40 5 5 10 10 20 20 40 40 5 5 10 10 20 20 40 40 713.64 671.19 535.17 558.57 385.90 223.88 108.15 46.74 966.16 657.03 750.58 630.02 608.72 341.25 153.75 78.93 1329.41 836.29 1007.80 719.19 918.31 460.24 280.07 118.33 659.51 601.85 559.42 494.50 381.34 220.32 108.15 46.74 938.74 609.33 724.65 615.54 559.40 318.49 154.58 78.93 1329.41 807.82 1007.80 672.55 920.04 425.94 280.07 122.49
Pérez-Rodríguez and Hernández-Aguirre / Probability model to solve the school bus routing problem with stops selection. IJCOPI, Vol. 7, No. 1, Jan-April 2016, pp. 30-39. ISSN: 2007-1558.
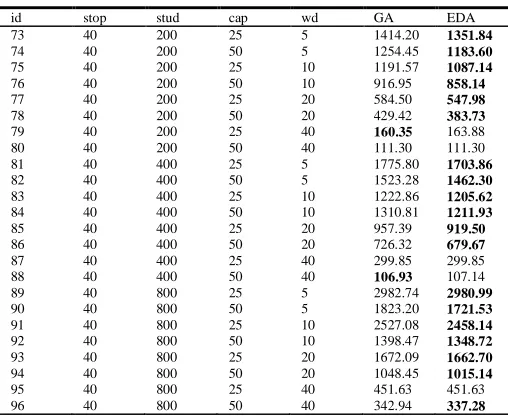
Table 4. Comparative results for 40 potential stops
id stop stud cap wd GA EDA
73 74 75 76 77 78 79 80 81 82 83 84 85 86 87 88 89 90 91 92 93 94 95 96 40 40 40 40 40 40 40 40 40 40 40 40 40 40 40 40 40 40 40 40 40 40 40 40 200 200 200 200 200 200 200 200 400 400 400 400 400 400 400 400 800 800 800 800 800 800 800 800 25 50 25 50 25 50 25 50 25 50 25 50 25 50 25 50 25 50 25 50 25 50 25 50 5 5 10 10 20 20 40 40 5 5 10 10 20 20 40 40 5 5 10 10 20 20 40 40 1414.20 1254.45 1191.57 916.95 584.50 429.42 160.35 111.30 1775.80 1523.28 1222.86 1310.81 957.39 726.32 299.85 106.93 2982.74 1823.20 2527.08 1398.47 1672.09 1048.45 451.63 342.94 1351.84 1183.60 1087.14 858.14 547.98 383.73 163.88 111.30 1703.86 1462.30 1205.62 1211.93 919.50 679.67 299.85 107.14 2980.99 1721.53 2458.14 1348.72 1662.70 1015.14 451.63 337.28
[image:8.612.180.433.352.495.2]Table 5 provides the results when there are 80 potential stops. From Table 5 can see how the probability model is able to detect competitive sequences and almost always getting less time than the genetic algorithm.
Table 5. Comparative results for 80 potential stops
id stop stud cap wd GA EDA
97 98 99 100 101 102 103 104 105 106 107 108 109 110 111 112 80 80 80 80 80 80 80 80 80 80 80 80 80 80 80 80 400 400 400 400 400 400 400 400 800 800 800 800 800 800 800 800 25 50 25 50 25 50 25 50 25 50 25 50 25 50 25 50 5 5 10 10 20 20 40 40 5 5 10 10 20 20 40 40 3183.28 3206.93 2308.92 1751.58 1228.60 765.17 277.24 164.84 3792.85 3119.84 2777.51 2225.75 2037.22 1292.76 480.24 271.94 2971.76 3037.08 2215.67 1728.20 1180.88 753.68 275.95 165.01 3708.18 3033.81 2713.75 2158.87 1964.91 1183.44 485.03 271.77
Fig. 4. Dispersion and symmetry between both algorithms.
Further, a hypothesis test is performed to determine whether the proposed EDA is better than the genetic algorithm. Table 6 describes when there is a statistically significant difference between the algorithms.
Table 6. Hypothesis testing between algorithms
Stops t-test t-critical
µ GA µ EDA σ GA σ EDA
5 10
0.037 0.036
0.0630 0.0630
158.16 278.59
159.17 276.75
94.43 175.77
[image:9.612.174.438.580.659.2]Pérez-Rodríguez and Hernández-Aguirre / Probability model to solve the school bus routing problem with stops selection. IJCOPI, Vol. 7, No. 1, Jan-April 2016, pp. 30-39. ISSN: 2007-1558.
4 Conclusions
Based on the above results, the contribution of this research to the solution of permutation-based representation problems such as the school bus routing problem with stops selection is confirmed. The probability model used is able to find better solutions to reduce the travel time for a set of school buses. The proposed model makes explicit the search, a situation that is random in the variation process on other algorithms. The construction mechanism of the solutions permits to determine the chance for a bus stop to be chosen on the route through the probability model. The method of allocating student-stop used in this research was no downside to reduce travel time by the model used.
References
1. B. Minocha and S. Tripathi, "Solving School Bus Routing Problem Using Hybrid Genetic Algorithm: A Case Study," in Proceedings of the Second International Conference on Soft Computing for Problem Solving (SocProS 2012), vol. 236, B. Babu, A. Nagar, K. Deep, M. Pant, J. Bansal, K. Ray, et al., Eds. Springer India, 2012, pp.93-103.
2. P. Schittekat, J. Kinable, K. Sörensen, M. Sevaux, F. Spieksma and J. Springael, "A metaheuristic for the school bus routing problem with bus stop selection," European Journal of Operational Research, vol. 229, pp. 518-528, 2013.
3. H. Niu, "Application of Genetic Algorithm to Optimize Transit Schedule under Time-Dependent Demand," in Computational Intelligence for Traffic and Mobility, vol. 8, W. Wang and G. Wets, Eds. Atlantis Press, 2013, pp. 71-88. 4. O. Díaz-Parra, J. Ruiz-Vanoye, M. Buenabad-Arias and A. Canepa-Saenz, "Vertical Transfer Algorithm for the School Bus
Routing Problem," in Transactions on Computational Science XXI, vol. 8160, M. Gavrilova, C. Tan and A. Abraham, Eds. Springer Berlin Heidelberg, 2013, pp. 211-229.
5. J. Euchi, and R. Mraihi, "The urban bus routing problem in the Tunisian case by the hybrid artificial ant colony algorithm," Swarm and Evolutionary Computation, vol. 2, pp. 15-24, 2012.
6. J. Pacheco, R. Caballero, M. Laguna, and J. Molina, "Bi-Objective Bus Routing: An Application to School Buses in Rural Areas," Transportation Science, vol. 47(3), pp. 397-411, 2013.
7. J. Park, and B.I. Kim, "The school bus routing problem: A review," European Journal of Operational Research, vol. 202(2), pp. 311-319, 2010.
8. L. Wang, S. Wang, Y. Xu, G. Zhou and M. Liu, "A bi-population based estimation of distribution algorithm for the flexible job-shop scheduling problem," Computers and Industrial Engineering, vol. 62, pp. 917-926, 2012.