Eliminating Redundancy by Spectral Relaxation for Multi-Document
Summarization
Fumiyo Fukumoto Akina Sakai Yoshimi Suzuki
Interdisciplinary Graduate School of Medicine and Engineering University of Yamanashi
{fukumoto, t05kg014, ysuzuki}@yamanashi.ac.jp
Abstract
This paper focuses on redundancy, over-lapping information in multi-documents, and presents a method for detecting salient, key sentences from documents that discuss the same event. To elimi-nate redundancy, we used spectral clus-tering and classified each sentence into groups, each of which consists of seman-tically related sentences. Then, we ap-plied link analysis, the Markov Random Walk (MRW) Model to deciding the im-portance of a sentence within documents. The method was tested on the NTCIR evaluation data, and the result shows the effectiveness of the method.
1 Introduction
With the exponential growth of information on the Internet, it is becoming increasingly difficult for a user to read and understand all the materials from a series of large-scale document streams that is po-tentially of interest. Multi-document summariza-tion is an issue to attack the problem. It differs from single document summarization in that it is important to identify differences and similarities across documents. Graph-based ranking methods, such as PageRank (Page et al., 1998) and HITS (Kleinberg, 1999) have recently applied and been successfully used for multi-document summariza-tion (Erkan and Radev, 2004; Mihalcea and Tarau, 2005). Given a set of documents, the model con-structs graph consisting vertices and edges where vertices are sentences and edges reflect the rela-tionships between sentences. The model then ap-plies a graph-based ranking method to obtain the rank scores for the sentences. Finally, the sen-tences with large rank scores are chosen into the summary. However, when they are strung to-gether, the resulting summary still contains much
overlapping information. Because all the sen-tences are ranked based on a sentence as unit of information. Therefore, for example, semanti-cally related two sentences with “high recommen-dation” are ranked with high score, and thus are regarded as a summary sentence. To attack the problem, Wan et al. proposed two models, i.e., the Cluster-based conditional Markov Random Walk model and the Cluster-based HITS model, both make use of the theme clusters in the document set (Wan and Yang, 2008). Their model first groups documents into theme clusters by using a simple clustering method,k-means. Next, the model con-structs a directed or undirected graph to reflect the relationships between sentences and clusters by using link analysis. They reported that the results on the DUC2001 and DUC2002 datasets showed the effectiveness of their models. However, one of the problems using multivariate clustering such as k-means is that it is something of a black art when applied to high-dimensional data. The avail-able techniques for searching this large space do not offer guarantees of global optimality, thus the resulting summary still contains much overlapping information, especially for a large amount of doc-uments.
This paper focuses extractive summarization, and present a method for detecting key sentences from documents that discuss the same event. Like Wan et al.’s approach, we applied link analysis, the Markov Random Walk (MRW) model (Bre-maud, 1999) to a graph consisting sentences and clusters. To attack the problem dealing with the high dimensional spaces, we applied spectral clus-tering technique (Ng et al., 2002) to the sentences from a document set. Spectral clustering is a trans-formation of the original sentences into a set of or-thogonal eigenvectors. We worked in the space de-fined by the first few eigenvectors, using standard clustering techniques in the transformed space.
2 Spectral Clustering
Similar to other clustering algorithms, the spec-tral clustering takes as input a matrix formed from a pairwise similarity function over a set of data points. Given a set of points S = {s1, · · ·, sn} in a high dimensional space, the algorithm is as follows:
1. Form a distance matrix D ∈ R2. We used cosine similarity as a distance measure.
2. Dis transformed to an affinity matrixAij.
Aij =
exp(−Dij2
σ2 ), ifi=j
0, otherwise.
σ2 is a parameter and controls the rate at
which affinity drops off with distance.
3. The matrixL=D−1/2AD−1/2is created.D is a diagonal matrix whose (i,i) element is the sum ofA’si-th row.
4. The eigenvectors and eigenvalues of L are computed, and a new matrix is created from the vectors associated with the number of l largest eigenvalues.
5. Each item now has a vector oflcoordinates in the transformed space. These vectors are normalized to unit length.
6. K-means is applied toSin thel-dimensional space.
3 Cluster-based Link Analysis
The link analysis we used is an approach presented by Wan et. al (Wan and Yang, 2008). The model called “Cluster-based Conditional Markov Ran-dom Walk Model” incorporates the cluster-level information into the process of sentence rank-ing. The model is summarized as follows: Let
π(clus(si)) ∈ [0,1] be the importance of
clus-ter clus(si) in the whole document set D. Let alsoω(si, clus(si))∈[0,1]denote the strength of the correlation between sentencesiand its cluster
clus(si). clus(si)refers to the cluster containing sentence si. The transition probability from si to
sj is defined by formula (1).
p(i→j|clus(si), clus(sj))
=
8 > > > < > > > :
f(i→j|clus(si), clus(sj))
|S|
X
k=1
f(i→k|clus(si), clus(sk))
, if Σf = 0
0, otherwise.
(1)
f(i→j |clus(si), clus(sj))in formula (1) refers to the weight between two sentences si and sj, conditioned on the two clusters containing the two sentences, and defined by formula (2).
f(i→j|clus(si), clus(sj))
=f(i→j)·{λ·π(clus(si))·ω(clus(si))
+(1−λ)·π(clus(sj))·ω(clus(sj))} (2)
λ ∈ [0,1] in formula (2) is the combination weight controlling the relative contributions from the source cluster and the destination cluster.
π(clus(si)) denotes the value indicating the
im-portance of the cluster clus(si) in the document setD. Similarly,ω(si, clus(si))refers to the sim-ilarity value between the sentencesiand its cluster
clus(si). These values are obtained by using the cosine similarity. The new row-normalized matrix
M is defined by formula (3).
Mij = p(i→j|clus(si), clus(sj)) (3)
The saliency scores for the sentences are com-puted based on formula (3) by using the iterative form in formula (4).
Score(si) = μ
X
allj=i
Score(sj)·Mji+ (1−
μ)
|S| (4)
μin formula (4) is the damping factor, which we set to 0.85. The above process can be considered as a Markov chain by taking the sentences as the states and the final transition matrix is given by formula (5), and each score of the sentences is ob-tained by the principle eigenvector of the new tran-sition matrixA.
A = μMT+ (1−μ)
|V | ee T
(5)
4 Experiments
We had an experiment by using the NTCIR-31 SUMM to evaluate our approach. NTCIR-3 has two tasks, single, and multi-document summariza-tion. The data is collected from two years(1998-1999) Mainichi Japanese Newspaper articles. We used multi-document summarization task. There are two types of gold standard data provided to human judges, FBFREE DryRun and FormalRun, each of which consists of 30 topics. There are two types of correct summary according to the charac-ter length, i.e., “long” and “short”. All documents were tagged by a morphological analysis, ChaSen (Matsumoto et al., 1997) and noun words are ex-tracted.
We used FormalRun consisting of 30 topics as a test data. Similarly, we randomly chose 10 topics from the FBFREE DryRun data to tuning a param-eterσin Spectral Clustering, and the number ofl in the l-dimensional space obtained by the Spec-tral Clustering. σis searched in steps of 0.01 from 1.0 to 5.0.lin thel-dimensional space is searched in steps 10% from 0 to 80% against the total num-ber of words in the training data. The size that op-timized the average F-score of 10 topics was cho-sen. Here, F-score is the standard measure used in the clustering algorithm, and it combines recall and precision with an equal weight. Precision is a ratio of the number of correct pair of sentences ob-tained by thek-means divided by the total number of pairs obtained by thek-means. Recall indicates a ratio of the number of correct pair of sentences obtained by thek-means divided by the total num-ber of correct pairs. As a result,σandlare set to 4.5 and 80%, respectively.
It is difficult to predict the actual cluster number
k in a given input sentences to produce optimal results. The usual drawback in many clustering algorithms is that they cannot give a valid criterion for measuring class structure. Therefore, similar to Wan et. al’s method (Wan and Yang, 2008), we typically set the number ofkof expected clusters as √N where N is the number of all sentences in the document set. We used these values of the parameters and evaluated by using test data.
We used two evaluation measures. One is co-sine similarity between the generated summary by the system and the human generated summary. Another is ROUGE score used in DUC (Liu and Hovy, 2003).
1http://research.nii.ac.jp/ntcir/
ROUGE =
X
s∈Cand
X
ngram∈s
Countmatch(ngram)
X
s∈Cand
X
ngram∈s
Count(ngram) (6)
We used a word instead of n-gram sequence in formula (6). The results are shown in Table 1. “# of doc” and “# of sent” refer to the average number of documents and sentences, respectively. “# of sum” denotes to the average number of summary sentences provided by NTCIR3 SUMM. “cos” and “ROUGE” refer to the results evaluated by using cosine, and ROUGE score, respectively. “MRW” indicates the results obtained by directly applying MRW model to the input sentences.
We can see from Table 1 that our approach (Spectral) outperforms the baselines, “MRW” and “k-means”, regardless of the types of sum-mary (long/short) and evaluation measures (co-sine/ROUGE). The results obtained by three ap-proaches show that “short” was better than “long”. This indicates that the rank score of correct sen-tences within the candidate sensen-tences obtained by the MRW model works well. Comparing the results evaluated by “ROUGE” were worse than those of “cos” at any approaches. One rea-son is that the difference of summarization tech-nique, i.e., our work is extractive summarization, while the gold standard data provided by NTCIR-3 SUMM is the abstracts written by human pro-fessionals. As a result, a large number of words in a candidate summary are extracted by our ap-proaches. For future work, it is necessary to tend our method to involve paraphrasing for ex-tracted key sentences to reduce the gap between automatically generated summaries and human-written abstracts (Barzilay et al., 1993; Carenini and Cheung, 2008).
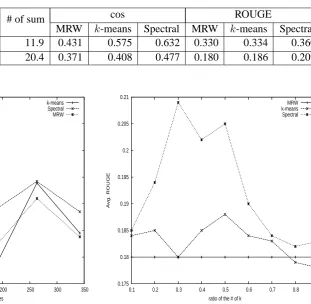
It is interesting to note how our approach affects for the number of sentences as an input. Figure 1 illustrates the results of summary “long” with evaluated ROUGE score. We can see from Figure 1 that our approach is more robust than k-means and the MRW model, even for a large number of input data. We have seen the same observations from other three results, i.e., the results of short and long with evaluated cos and short with evalu-ated ROUGE.
Table 1: Results against 30 topics
# of doc # of sent # of sum cos ROUGE
MRW k-means Spectral MRW k-means Spectral
Short 7.5 83.0 11.9 0.431 0.575 0.632 0.330 0.334 0.360
Long 20.4 0.371 0.408 0.477 0.180 0.186 0.209
0.05 0.1 0.15 0.2 0.25 0.3 0.35 0.4
0 50 100 150 200 250 300 350
ROUGE
# of sentences
[image:4.595.75.322.95.391.2]k-means Spectral MRW
Figure 1: Long with ROUGE vs. # of sentences
affects the summarization performance. In the ex-periment, we set k = r∗ | N | where r is a pa-rameter ranged from 0 to 1 (Wan and Yang, 2008). Because of space is limited, we report only the re-sult with summary “long” and ROUGE score. The result is shown in Figure 2.
Overall the results obtained by our approach and k-means outperformed the results obtained by directly applying MRW model, while the re-sults by k-means was worse than the results by MRW model when the ratio of the number of sen-tences was larger than 0.8. This shows that cluster-based summarization is effective reduce redun-dancy, overlapping information. Figure 2 also shows that our approach always outperforms, re-gardless of how many number of sentences were used. This indicates that the MRW model with spectral clustering is more robust than that with the baseline, k-means, with respect to the differ-ent number of clusters.
5 Conclusion
We have developed an approach to detect salient sentences from documents that discuss the same
0.175 0.18 0.185 0.19 0.195 0.2 0.205 0.21
0.1 0.2 0.3 0.4 0.5 0.6 0.7 0.8 0.9
Avg. ROUGE
ratio of the # of k
MRW k-means Spectral
Figure 2: Long with ROUGE score measure vs. # ofk
event. The results showed the effectiveness of the method. Future work will include: (i) compar-ing other approaches that uses link analysis to re-duce redundancy, such as (Zhu et al., 2007), (ii) applying the method to the DUC evaluation data for quantitative evaluation, and (iii) extending the method to classify sentences into more than one classes by using soft-clustering techniques such as EM (Dempster et al., 1977) and fuzzy c-means al-gorithms (Zhang and Wang, 2007).
References
R. Barzilay, K. R. McKeown, and M. Elhadad. 1993. Information Fusion in the Context of Multi-document Summarization. In Proc. of the 37th
An-nual Meeting of the Association for Computational Linguistics, pages 550–557.
P. Bremaud. 1999. Markov Chains: Gibbs Fields,
Monte Carlo Simulation, and Queues. Springer-Verlag.
In Proc. of the 5th International Natural Language
Generation Conference, pages 33–41.
A. P. Dempster, N. M. Laird, and D. B. Rubin. 1977. Maximum Likelihood from Incomplete Data Via the EM Algorithm. Royal Statistical Society, 39(B):1– 38.
G. Erkan and D. Radev. 2004. LexPageRank: Prestige in Multi-document Text Summarization. In Proc. of
the 2004 Conference on Empirical Methods in Nat-ural Language Processing, pages 365–371.
J. M. Kleinberg. 1999. Authoritative Sources in a Hy-perlinked Environment. ACM, 46(5):604–632.
C-Y. Liu and E. H. Hovy. 2003. Automatic Evalu-ation of Summaries Using N-gram Co-occurrence Statistics. In Proc. of Human Language
Technolo-gies: The Annual Conference of the North American Chapter of the Association for Computational Lin-guistics, pages 71–78.
Y. Matsumoto, A. Kitauchi, T. Yamashita, Y. Haruno, O. Imaichi, and T. Imamura. 1997. Japanese
Mor-phological Analysis System Chasen Mannual.
R. Mihalcea and P. Tarau. 2005. Language Indepen-dent Extractive Summarization. In In Proc. of the
43nd Annual Meeting of the Association for Compu-tational Linguistics, pages 49–52.
A. Y. Ng, M. I. Jordan, and Y. Weiss. 2002. On
Spec-tral Clustering: Analysis and an Algorithm,
vol-ume 14. MIT Press.
L. Page, S. Brin, R. Motwani, and T. Winograd. 1998. The Pagerank Citation Ranking: Bringing Order to the Web. In Technical report, Stanford Digital
Li-braries.
X. Wan and J. Yang. 2008. Multi-document Sum-marization Using Cluster-based Link Analysis. In
Proc. of the 31st Annual International ACM SIGIR Conference on Research and Development in Infor-mation Retrieval, pages 299–306.
Z. Zhang and R. Wang. 2007. Identification of Overlapping Community Structure in Complex Net-works using Fuzzy C-means Clustering. PHYSICA, A(374):483–490.
X. Zhu, A. Goldberg, J. V. Gael, and D. Andrzejew-ski. 2007. Improving Diversity in Ranking using Absorbing Random Walks. In In Human Language