METEOROLOGICAL SERVICE
THE SECULAR VARIATION OF MAGNETIC DECLINATION
IN IRELAND
(1980)
By
. . / ~ . , .. (,
-t",L~ • .
J McWilliams. B. Sc.
19314
. /
UDC 550.38
538.71
Glasne.in Hill Dublin 9
1980
SummarY .
Since the previous publication [~~ :leasure-r::ents of the =a,e:net ic
Declination have been continued at a network of "repeat stations" throughout Ireland. The deduced annual :::lean values for those stations during' the past decade together with the corresponding annual mean valuf>s 3t the three observatories at Valent ia, Hartland and Eskdale:::uir are analyse~ to obtain a revised equation for the secular variat ion of Westerly Declinat ion o'ver the country.
Using this equation the survey !:lap for 1970.0 [~J has been up-dated to epoch 1980.0. From this up-dated map and the equation for the annual change in Declination (or the 1980 Isopors) the value of Declination for any place in Ireland may be conveniently extrapol::r~ed for any subsequent time. The
extrapolation should be reasonably accurate until about 1965.0 Vio'hen,
hopefully, more r!>easureoents will be a\'ailable to ag-ain re\'ise and up-date the map and equation of change.
1. Introduction
A comprehensive magnet ic sur\'e~' of Ireland was co:::pleted during
1964-1965 [I] as lrE'lands contribution to the World llagnetic Survey and involved a prol;Ta:r.:::e of observations at 57 stations. Since then the Meteorological Service has rt::ade magnetic survey observations at a number of "repeat" stations to provide data on the sE'cular variation of the magnetic elements (Declination, Horizontal Force and Vertical Force) and enable the co::r:prehensive !taps to be up-dated at frequent intervals.
In 1969 ~.lcl\'illiams [~l analysed the available data for magnetic Declination and prepared a survey map for epoch 1970.0. All oeasurements made since then have now been analysed to up-date this Itap for epoch 1980.0.
Throughout the area covered by the survey the [X?clination is "'est so where "Declination" alone is used for con\'enience it should be
interpreted as Westerly Declinat ion.
2. Procedure
The instru=ents used, the calibration and !Leasure-oent procedure "ere iden tical to those used in the cornprehensi ve survey [11. The control centre to which all the survey observations .... ere referred and at which continuous records were a\'ailable to provide instantaneous deviations from the mean values at each particular time of observation was Valentia Obser\,atory.
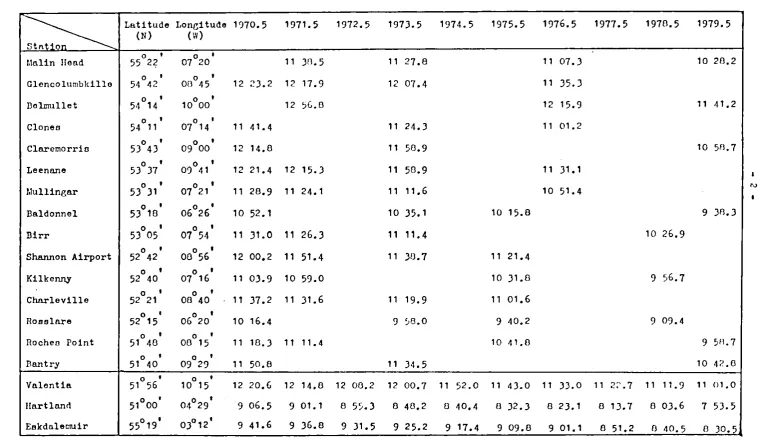
Table I shows the Latitude and Longitude of the repeat stations
to~ther with Valentia Observatory. the control centre. and the
Observatories at Hartland and Eskdalet:luir .... hich were also U5·:;,>tj in this
-Table 1 Annual ~!ee.n Values of Macnetic Declination (Degreen and Minutes - Went)
~
Latitude Loncitude 1970.5 1971.5 1912.5 1913.5 1914.5 1975.5 1976.5 1971.5 1910.5 1919.5(N) (1'/)
0
•
01°20
•
1,ln11n Hend 55 22 11 30.5 11 21.8 11 01.3 10 20.2
°
•
00°45•
Glencolumbkillo 54 42 12 23.2 12 11.9 12 01.4 11 35.3 °
•
10°00•
Delmullet 54 14 12
,G.a
12 15.9 11 41.2°
•
°•
Clones 54 11 07 14 11 41.4 11 24.3 11 01.2 °
•
09°00•
Clnremorrio 53 4J 12 14.0 11 50.9 10 50.1
53°37
•
0<)°41,
Leenane 12 21.4 12 15.3 11 50.9 11 31.1
53°31
,
07°21
,
!.1ullingar 11 20.9 11 24.1 11 11.6 10 51.4
53°10
,
06°26•
Daldonnel 10 52.1 10 35.1 10 15.8 9 30.3
53°05
,
°
,
Dirr 07 54 11 )1.0 11 26.3 11 11. 4 10 26.9
°
,
00°56,
Shannon Airport 52 42 12 00.2 11 51.4 11 30.7 11 21.4
°
,
°,
Kilkenny 52 40 07 16 11 0).9 10 59.0 10 31.0 9 56.7
°
,
°,
Chnrleville 52 21 00 40 11 37.2 11 31.6 11 19.9 11 01.6
°
•
°,
ROBslnre 52 15 06 20 10 16.4 9 ~8 .. 0 9 40.2 9 09.4 °
,
°•
nocheo Point 51 40 00 15 11 10.3 11 11.4 10 41.0 9 511.1 °
•
°,
Bantry 51 40 0<) 2? 11 50.0 11 34.5 10 4~.0
51056
•
0•
Valenti .. 10 15 12 20.6 12 14.8 12 00.2 12 00.1 11 52.0 11 43.0 11 )).0 11 2~.7 11 11 .9 11 () 1.0
51°00
•
04°29,
Hnrtlnnrl 9 06.5 9 01.1 8 5~.J 0 40.2 0 40.4 0 32.3 0 23.1 0 1 J. 7 0 03.6 7 53.5
55°19
,
03° 12' 9 41.6 9 )6.8 [image:3.842.45.810.67.505.2]3
-3. Reduction of the Obse~ations
The values of the Leclination as ce~~d at the su-~~ stations were adjusted b~ ~eans of the i~stru=ent calibration data, to conform to the Valentia standard.
Follorln<; the procedure discussed in [2] i t was ass=ed that the diurnal va.-iation was a siDple function of local til:le, and that the annual variation at the surve~ station r.as the s~e as at Valentia. lor each individual tiI:!e of observation at the !r.lrve~ station the value ot
the instantaneous deviation of Leclination (D) from the base line was
co~ted from the Valentia cagnetogr~ for the corresponding local
ti:ne. Co~bining this instantaneous deviation r.!th the base line Talue' gave the Valentia Declinstion (Dv) for the sace local t~ as the survey value (Ds)., The annual cean value of L'eclination at Valentia
(V~) was computed froIl the hourl,y cean values tabulated from the
cagnetograos. The value of'the corresponding annual mean,at the surve~
station was obtained froc the relation:
Annual ~ean of D at Surve~ Station D Vo + DB - Dy
The ~~ual ~ean values of D at the repeat stations as reduced by
the cethod'indicated above, are given in Table 1. Co=responding values for Valentia, Hartland and Eskdalemuir are also included.
Table 2 Annual Ileans and Annual Decrease o!' 7:esterl,y Declination at Valentia
Annual Annual Annual Annual Annual Annual
Year l.!ean Chan~e Year
!Jean Chan,~e Year Mean ChanJte
0
,
,
0,
,
0,
,
1899 21 35.0 1926 18 10.8 11.6 1953 14 0.3.~ 6.7
1900 21 30.0 5.0 1921 11 59.5 11.3 1954 13 55.9 1.7
'1901 21 21.7 2.3 1928 11 48.0 11.5 1955 1.3 48.5 7.4
1902 21 24.2 3.5 1929 11 .31.3 10.1 1956 13 41.6 6.9
1903 21 18.1 5.5 19.30 11 21.6 9.1 1957 1 J .35.1 6.5
1904 21 15.2 .3.5 1931 17 16.8 10.8 1958 13 29.0 6.1
1905 21 10.4 4.8 1932 17 05.4 11.4 1959 1.3 22.9 6.1
1906 21 06.3 4.1 1933 16 54.5 10.9 1960 1.3 16.4
6.5
1907 21 01.4 4.9 1934 16 4.3.7 10.8 1961 13'10.3 6.1
1908 20 55.7 5.1 19.35 16 .32.1 11.0 1962 13 04.1 6.2
1909 20 50.3 5.4 1936 16 21.6 11.1 19(j3 12 51.6 6.5
1910 20 44.6 5.1 19J1 16 11.1 9.9 1964 12 51.6 6.0
1911 20 38.,1 6.5 19J8 16 02.4 9.3 1965 12 46.1 5.5
,1912 20 29 • .3 8.8 19.39 15 54.1 S.3 1966 12 40.8 5.3
1913 20 19.6 9.1 1940 15 45.3 8.8 1961 12 35.1 5.1
1914 20 12.3 1.3 1941 15 36.8 8.5 1968 12 .30.1 5.0
1915 20 03.8 8.5 1942 15 28.0 8.8 1969 12 25.8 ' 4.9
1916 19 5.3.1 10.1 1943 15 19.8 8.2 1910 12 20.6 5.2
1911 19 43.0 10.1 1944 15 11.6 8.2 1911 12 14.8 5.8
1918 19 .36.2 6.8 1945 15 03.6 8.0 1912 12 08.2 6.6
1919 19 21.2 9.0 1946 14 54.2 9.4 1913 12 00.1 1.5
,1920 19 11.9 9.3 1941 14 45.1 9.1 1914 11 52;0 8.7
1921 19 06.5 11.4 1948 14 37.2 1.9 1915 11 43.0
9.0
1922 18 51.0 9.5 1949 14 30.1 1.1 1916 11 33.0 ,10.0
1923 18 46.5 10.5 1950 14 23.9 6.2 1911 11 22.1 40.3
1924 18 34.9 11.6 1951 14 16.5 1.4 1918 11 11.9 ' 10.8
[image:4.602.72.558.382.778.2]•
21 r - - - -
- - -
... - . . - - . - - - _.- _.- ._-_ ... --19
18
16
15
14
•
12
11
10
-9
o
7~---L---~
__________
~____________
L -_ _ _ _ _ _ _ _ _ ~ _ _ _ _ _ _ _ _ _ _ _ _ ~ _ _ _ _ _ _ _ _ _ _ ~"'0
fig. I.
1920 19)0 1940 19$0 1960
1970 1980
5
-4. Analysis ot the Data
The secular variation ot Westerl1 Declination at the 'three
ObserTatories since epoch 1910.5 is shown in Pig. 1 troo which 1t can be seen that Declination has continued to decrease. HonTer the annu" rate ot change which had been stea.d.1l1 decreas1ns since about 1929 began to increase again in 1970. This can be seen in Fig. 2. ba.sed on the dAta in Table 2. which shows the lear to lear ch.e.ns8 in Declination at Valentia s1zlce 1910. Inclividual annual Talun ehOY sooe scatter prob"~l1 dlu
to variation in solar activitl but the overall pattern 1s clear trom the curve tor 11-lear oeans wh1ch is also dra1FIl on' ths dillgr8.m.
An examination ot the rate ot change at the Observatories and ,repeat stations suggested as in [2J that the a~~ual rate ot change (R)
over the area since 1970. ~ be represented bl a function otLat1tud. and Longitude in the torm:
'R • al(I'/'-50) + b1(}.-5) + c1, + t{a2(cp-50) + b2().-5) + C2} ••••••••••••• (1)
where C/ is the Latitude North and ).. the Longitude ;Vest in degren and
a1' b1. cl. a2. b2. and c2 are constants.
R is 1i1 l:Ii.nu t e s •
Using all the available measurements since 1970 at the ObserTatorie. and repeat stations and using the method ot least squares the ,equat1on tor rate ot change was tound to be: '
R . 0.17(q-50)
-0.20~t}.-5)
-4.667 -t(0.033(CI-50) -0.012C).-5) +0.710) ••• (2)Integrat1ns equation (2) with respect to "t- and taking t • 0 at epoch
1970.0 we get the general equat10n tor Declinat10n D (in minutes) in
the torm:
_t2{0.355+0.017~-50)-O.906~-5~
... (31
rutting t • 10 we get
Dao.O • D70.0 - 82.17 - 1.48(A-5) ••••••••••••••••••••••••••••••••••• (4)
Equation (4) may be used to up-date all the stations occupied in the general survey to epoch 19S0.0. These up-dated values together with the change since 1970.0 are given in Table 3 and torm the basis ot the Isogonic map tor epoch 1980.0 which is appended to thi's paper.
'In [2] the terrestrial isogonals tor epoch 1970.0
w.~
tound to beD70 • 0 • 16. 85«(,P -50) + 30.87(). -5) + 551.82 •••••••••••••••••••••••••• (5)
Combining this with equation (4) we get the terrestrial isogonals tor epoch 1980.0 in,the form:
DSO.O • 16.85(~- 50) + 29.39(~ - 5) + 469.65 •••••••••••••••••••••• (6)
"
cE
'"
0'> C
'"
'"
u13
4
3
-OL---~-
_ _ _L __
~
___
J_
1910 1920 1930
Fig. 2. Annual chang' in decl in.tion .1 Valentia.
1
Annu.l chang.
11- year meon of annual change
1 ___
[image:7.841.265.801.49.573.2]7
-~o taoilitate ext~apolation
0:
the ~ata on the 1980 =ap to tutureI'Jr'
(to 1985 Bay) Iquation (3)~~ ~e a~justl~ BO that Ziro time i. at 'pooh 1980.0. The 'quation then ~ICO=I'D • D80 -t{". 77+0. 1 7 (<1-50)+0. 09
()'-5~
-t 2~. 355+~: ~~; ~::~~:~: ~~~~~:~~~7)
The UBI ot this equation to~ ext~apolation ot Declination value.
tor tutur. ye.:! assuces t~~t the ar~ual ~ate ot ~eor.a!e will oont~1
the incr.asing t~end which r~s ~een the teature ot the past 10 liar ••
However it CAY ~e note~ that the anLual rate ot cr~~e at Vallntia at epoch 1980.0 has equalle~ the -.x1~1= annual ~ate ot change Ixplrilno.~
since o~Bervations ~eg~~ in 1888 i.e. 12.5 c1nutes, which was laet reach,d in 1925 (See fig.
2).
It is likely theretore that the annual rate otchange cay now settle at the 1980 value tor the next tew years.
At epoch 1980.0 the a!l..~al rate
0:
change is given ~y the equation(~)80.0
• -f1.77 + 0.17«(1-50) +0.09(~-5)}
... (8)This ·equation gives the Isopo~B or lines ot equal change in
Declination which are sho~~ on the cap as ~~oken red lines ~~
appro:d=tely South '.vest to North East. Whether we use these IBopore or equation
(7)
tor future extrapolation the ditterence will be small, and accw::llating to only 4 to 5 :1nutes0:
a~c by 1985. For :CBtpractical pu-'"Poses.:o~ which the =p will ~e used this ditterence in a torecast tor 5 years hence should not be very signiticant.
References
VcWilliacs, J. ~ Byrne, J.
A ~etic Survey ot Ireland tor Epoch 1965.5
~eteorological Service, Dublin, 1966.
l!clVillia::lS, J.
c
-Table 3 Declination Values at Enoch 1970.0 ar.d Un-dated Values for
Enoch 1980.0
station 1970.0 D
lg
·0 1980.0 Station 1970.0~g.O
1980.0D80.0 D80.0
0
,
,
0,
0,
,
0,
Llalin ilead 11 46.3 85.6 10 20.7 Carrick-on- 12 02.1 86.7 10 35.4 Shannon
Dun:fanaghy
"
59.5 86.5 10 33.0 Westport 12 18.0 88.8 10 49.2Coleraine 11 56.1 84.7 10 31.4 Castlereagh 12 15.4 87.4 10 48.0
Viateri'oot 11 18.7 83.7 9 55.0 Clare::orris 12 16.3 88.1 10 48.2
Derry 11 48.8 85.6 10 2:3.2 Drogheda 10 58.5 84.2 9 .34 • .3
Tobe=ore 11 30.7 84.8 10 05.9 Kells 11 19.0 84.9 9 54.1
Glencolu=.b- 12 25.4 87.7 10 57.7 Leenane 12 26.4 89.1 10 57 • .3 kille
Donegal 11 47.8 86.8 10 21.0 :':ullingar 11 .30.9 85.6 10 05 • .3
Bangor 10 38.9 83.1 9 15.8 Clifden 12 38.5 89.6 11 08.9
Streefe Fort 10 54.2 85.3 9 28.9 Athlone 11 32.4 86.5 10 05.9
Ar-...agh 11 17.7 84.6 9 53.1 Oughterard 12 42.3 88.5 11 13.8
Enn.iskillen 11 54.6 87.6 10 27.0 Baldon.nel 10 52.0 84.3 9 27.7
Sligo 12 04.9 87.3 10 37.6 Galway 12 31.7 88.1 11 03.6
Belcullet 13 05.3. 89.6 11 35.7 Kildare 11 08.8 84.9 9 43.9
Clones 11 40.0 85.5 10 14.5 Birr 11 32.8 86.4 10 06.4
Ballina 12 14.9 88.3 10 46.6 Gort 11 54.8 87.8 10 27.0
Greenore 11 13.5 8.3.8 9 49.7 Lisdoonvarna 12 10.8 88.5 10 42.3
[image:9.597.62.553.93.815.2]9
-Table 3 Declination Values at Epoch 1970.0 and Up-dated values ~or
Enoch 1980.0
D70.0 Il?0.0
Station 1970.0 to 1980.0 Station 1970.0 to 1980.0
D80.0 D80.0
--u- --0 0 0
Shannon 12 00.6 88.0 10 32.6 I'ater~ord 10 41.8 85.4 9 16.4 Airport
Bagna1 stown 10 57.1 85.0 9 32.' Tralee 12 21.2 89.2 10 52.0 (lfuineoeag)
Kilkenn,r '1 05.1 85.5 9 39.6 Rosslare 10 22.2 84.1 8 58.1
Limerick 11 50.8 87.6 10 23;2 Listlore 11 17.9 86.5 9 51.4
Kilrush 12 19.4 88.8 10 50.6 Killarney 12 11.9 88.9 10 43.0
Tipperary 11 28.4 86.9 10 01.5 Valentia 12 24.7 89.9 10 54.8
Ball,y1r111ian 10 44.2 8~.9 9 19 • .3 Cork 11 34.9 87.3 10 07.6
I'e:dord 10 29.2 84.3 9 04.9 Roches Point 11 19.4 87.0 9 52.4
[image:10.600.62.556.91.507.2]~3'
~2'
ISOII' t'IIl(, MA JF LAN
r
,,
,
/ ~ (~,
•
.-IRELAND
o 0
~-... o
10
r-'-T 1 20
1
E L ~A 1 N W T
'RI nONI S fiLA K
RREC;TRIAI 'C;OI)ONI S REJ
o
PO!? ,RC KEN RED~ ~
~
3
~,
II' o's
l
v<
'
~
I~. f f,
~,
.-,
'.
~ reel'~
'1,s-"
•
/ !? !?,
0J
It! • !?g' r
g'
,
3'"
~",
,
~,
,
h . . g ~
9.1 9 6,
i
,
'"
5 ,
(
10- 16'
g
-
.,
..
..
.
,
,
t;t
,
,
~~
,
~/~ ~
,
~~
,
L ~ ,
,
10- 07'8. ~
~ ~