A Corpus of Human-written Summaries of Line Graphs
Charles F. Greenbacker, Sandra Carberry, and Kathleen F. McCoy
Department of Computer and Information Sciences University of Delaware, Newark, Delaware, USA
[charlieg|carberry|mccoy]@cis.udel.edu
Abstract
We describe a corpus of human-written En-glish language summaries of line graphs. This corpus is intended to help develop a system to automatically generate summaries captur-ing the most salient information conveyed by line graphs in popular media, as well as to evaluate the output of such a system.
1 Motivation
We are developing a system designed to automati-cally generate summaries of the high-level knowl-edge conveyed by line graphs found in multimodal documents from popular media sources (e.g., mag-azines, newspapers). Intended applications include making these graphics more accessible for people with visual impairments and indexing their infor-mational content for digital libraries. Information graphics like line graphs are generally included in a multimodal document in order to make a point supporting the overall communicative intent of the document. Our goal is to produce summaries that convey the knowledge gleaned by humans when in-formally viewing the graphic, focusing on the “take-away” message rather than the raw data points.1
Studies have shown (Carberry et al., 2006) that the captions of information graphics in popular me-dia often do not repeat the message conveyed by the graphic itself; such captions are thus not appropriate for use as a summary. Furthermore, while scientific graphs are designed for experts trained in their use
1
Users generally preferconceptualimage descriptions over perceptualdescriptions (J¨orgensen, 1998; Hollink et al., 2004).
for data visualization, information graphics in pop-ular media are meant to be understood by all read-ers, including those with only a primary school ed-ucation. Accordingly, summaries for these graphics should be tailored for the same general audience.
Research into information graphics by Wu et al. (2010) has identified a limited number of intended message categories conveyed by line graphs in pop-ular media. Their efforts included the creation of a corpus2 of line graphs marked with the overall in-tended message identified by human annotators.
However, we hypothesize that an effective sum-mary should present the graph’s intended message plusadditional informational propositions that elab-orate on this message. McCoy et al. (2001) observed that the intended message was consistently included in line graph summaries written by human subjects. Furthermore, participants in that study augmented the intended message with descriptions of salient vi-sual features of the graphic (e.g., steepness of a trend line, volatility of data values). As part of the pro-cess of building a system to identify which visual features are salient and to describe them using nat-ural language expressions, we collected a corpus of human-written summaries of line graphs.
2 Building the Corpus
We selected 23 different line graphs for use in build-ing our corpus. This set covered the eight most-common intended message categories from the Wu corpus; only Point Correlation and Stable Trend were omitted. Table 1 shows the distribution of
2www.cis.udel.edu/~carberry/Graphs/viewallgraphs.php
Message Category No.(graphs)
Big Fall (BF) 4(20–23)
Big Jump (BJ) 2(18, 19) Changing Trend (CT) 4(8–11) Change Trend Return (CTR) 2(12, 13) Contrast Trend with
Last Segment (CTLS)
2(14, 15)
Contrast Segment with Changing Trend (CSCT)
2(16, 17)
Rising Trend (RT) 4(1–4) Falling Trend (FT) 3(5–7)
[image:2.612.360.494.52.252.2]Total 23(1–23)
Table 1: Distribution of overall intended message cate-gories in the set of line graphs used to build the corpus.
graphs across message categories.3 Ten of the line graphs were real world examples in popular media taken from the Wu corpus (e.g., Figure 1). Another ten graphs were adapted from items in the Wu cor-pus – modified in order to isolate visual features so that their individual effects could be analyzed (e.g., Figure 2). The remaining three line graphs were cre-ated specifically to fill a gap in the coverage of in-tended messages and visual features for which no good example was available (e.g., Figure 3). Our goal was to include as many different combinations of message category and visual features as possible (e.g., for graphs containing a dramatic change in val-ues because of a big jump or fall, we included ex-amples which sustained the change as well as others that did not sustain the change).
69 subjects participated in our study. All were native English speakers, 18 years of age or older, without major sight impairments, and enrolled in an introductory computer science course at a university in the US. They received a small amount of extra credit in their course for participating in this study.
Each participant was given the full set of 23 line graphs in differing orders. With each graph, the sub-jects were presented with an initial summary sen-tence describing the overall intended message of the graphic, as identified by a human annotator. The captions for Figures 1, 2, and 3 each contain the cor-responding initial summary sentence that was pro-vided to the participants. Participants were tasked with writing additional sentences so that the
com-3Category descriptions can be found in (Wu et al., 2010).
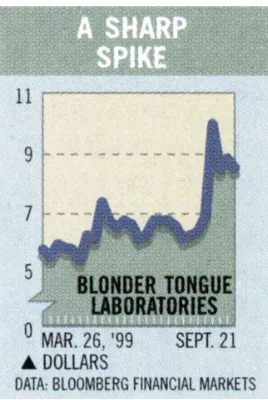
Figure 1: From “This Cable Outfit Is Getting Tuned In” inBusinessweekmagazine, Oct 4, 1999. (Initial sentence: “This line graph shows a big jump in Blonder Tongue Laboratories stock price in August ’99.”)
pleted summary of each line graph captured the most important information conveyed by the graphic, fin-ishing as many or as few of the 23 graphs as they wished during a single one-hour session.
Participants were told that we were developing a system to convey an initial summary of an informa-tion graphic from popular media (as opposed to text-books or scientific articles) to blind users via speech. We indicated that the summaries they write should be brief (though we did not specify any length re-quirements), but ought to include all essential infor-mation provided by the graphic. Subjects were only given the graphics and did not receive the original ar-ticle text (if any existed) that accompanied the real-world graphs. Finally, the participants were told that a person able to see the graphics should not think that the summaries they wrote were misleading.
3 Corpus Characteristics
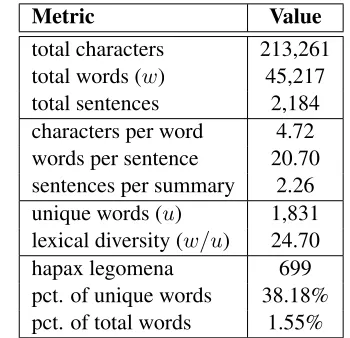
A total of 965 summaries were collected, ranging from 37 to 49 summaries for each individual line graph. Table 2 offers some descriptive statistics for the corpus as a whole, while Table 3 lists the ten most commonly-occurring content words.
[image:2.612.77.297.53.225.2]! Figure 2: Adapted from original in “Dell goes with a few
AMD chips,”USA Today, Oct 19, 2006. (Initial sentence: “This line graph shows a falling trend in Dell stock from May ’05 to May ’06.”)
From March 26, 1999 the graph rises and de-clines up until August 1999 where it rises at about a 90-degree angle then declines again.
(1)
The graph peaked in July ’05 but then sharply decreased after that. It had several sharp in-clines and dein-clines and ended with a shaper decline from March ’06 to May ’06.
(2)
February has a much larger amount of jackets sold than the other months shown. From dec-ember to january, there was a slight drop in the amount of jackets sold and then a large spike from january to february.
(3)
The values in November and May are pretty close, with both being around 37 or 38 jackets. At its peak (February), around 47 jackets were sold.
(4)
4 Potential Usage
To our knowledge, this is the first and only publicly-available corpus of line graph summaries. It has sev-eral possible applications in both natural language generation and evaluation tasks. By finding and ex-amining patterns in the summaries, we can discover which propositions are found to be most salient for certain kinds of graphs. We are currently analyzing the collected corpus for this very purpose – to iden-tify relationships between visual features, intended messages, and the relative importance of includ-ing correspondinclud-ing propositions in a summary (e.g., volatilityis more salient in Figure 2 than Figure 3).
!
Figure 3: Sample line graph created for this study. (Ini-tial sentence: “This line graph shows a rising trend in Boscov’s jacket sales from November to February fol-lowed by a falling trend through May.”)
Metric Value
[image:3.612.101.268.55.235.2]total characters 213,261 total words (w) 45,217 total sentences 2,184 characters per word 4.72 words per sentence 20.70 sentences per summary 2.26 unique words (u) 1,831 lexical diversity (w/u) 24.70 hapax legomena 699 pct. of unique words 38.18% pct. of total words 1.55%
Table 2: Various descriptive statistics for the corpus.
Not only does this corpus offer insight into what humans perceive to be the most important informa-tion conveyed by line graphs, it provides a large set of real-world expressions from which to draw when crafting the surface realization forms for summaries of line graphs. From a generation perspective, this collection of summaries offers copious examples of the expressions human use to describe characteris-tics of information graphics. The corpus could also be used to determine the proper structural character-istics of a line graph summary (e.g., when multiple information is included, how propositions are aggre-gated into sentences, which details come first).
[image:3.612.336.511.289.458.2]human-Word Count Word Count
[image:4.612.95.276.54.139.2]graph 715 stock 287 price 349 increase 280 august 305 may 279 dollars 300 decrease 192 around 299 trend 183
Table 3: The ten most frequently occurring words in the corpus (omitting stopwords and punctuation).
generated descriptions at the propositional (content) level, as well as judgments involving clarity and co-herence. The set of summaries for each graph may be used as a “gold standard” against which to com-pare automatically-generated summaries in prefer-ence judgment experiments involving human judges. We are currently developing rules for identifying the most salient information conveyed by a given line graph based on an analysis of this corpus, and will also use the expressions in the collected sum-maries as examples for surface realization during the summary generation process. Additionally, we are planning to use the corpus during part of the evalu-ation phase of our project, by asking human judges to compare these human-written summaries against our system’s output across multiple dimensions of preference. It may also be useful to perform some additional human subjects experiments to determine which summaries in the corpus are found to be most helpful and understandable.
5 Related Work
Prior to this study, we performed an initial investi-gation based on a questionnaire similar to the one used by Demir (2010) for bar charts. A group of human subjects was asked to review several line graphs and indicate how important it would be to include various propositions in an initial summary of each graphic. Although this method was effec-tive with bar charts, it proved to be far too cumber-some to work with line graphs. Bar charts are cumber- some-what simpler, propositionally-speaking, as there are fewer informational propositions that can be ex-tracted from data represented as discrete bars rather than as a continuous data series in a line graph. It required far more effort for subjects to evaluate the relative importance of each individual proposi-tion than to simply provide (in the form of a
writ-ten summary) the set of propositions they consid-ered to be most important. In the end, the summary-based approach allowed for a more direct exami-nation of salience judgments without subjects be-ing constrained or influenced by the questions and structure of the questionnaire-based approach, with the added bonus of producing a reusable corpus of human-written summaries of line graphs.
McCoy et al. (2001) performed a study in which participants were asked to write brief summaries for a series of line graphs. While they did not release a corpus for distribution, their analysis did suggest that a graph’s visual features could be used to help select salient propositions to include in a summary.
Although several corpora exist for general im-age descriptions, we are unaware of any other cor-pora of human-written summaries for information graphics. J¨orgensen (1998) collected unconstrained descriptions of pictorial images, while Hollink et al. (2004) analyzed descriptions of mental images formed by subjects to illustrate a given text pas-sage. Aker and Gaizauskas (2010) built a corpus of human-generated captions for location-related im-ages. Large collections of general image captions have been assembled for information retrieval tasks (Smeaton and Quigley, 1996; Tribble, 2010). Roy (2002) evaluated automatically-generated descrip-tions of visual scenes against human-generated de-scriptions. The developers of the iGraph-Lite system (Ferres et al., 2007) released a corpus of descrip-tions for over 500 graphs collected from Statistics Canada, but these descriptions were generated auto-matically by their system and not written by human authors. Additionally, the descriptions contained in their corpus focus on the quantitative data presented in the graphics rather than the high-level message, and tend to vary only slightly between graphs.4
Since using corpus texts as a “gold standard” in generation and evaluation can be tricky (Reiter and Sripada, 2002), we tried to mitigate some of the common problems, including giving participants as much time as they wanted for each summary to avoid “hurried writing.” However, as we intend to use this corpus to understand which propositions hu-mans find salient for line graphs, as well as
generat-4The iGraph-Lite system provides the same information for
ing and evaluating new summaries, a larger collec-tion of examples written by many authors for several different graphics was more desirable than a smaller corpus of higher-quality texts from fewer authors.
6 Availability
The corpus is freely available for download5without restrictions under an open source license.
The structure of the corpus is as follows. The “summaries” directory consists of a series of subdi-rectories numbered 1-23 containing the summaries for all 23 line graphs, with each summary stored in a separate file (encoded as ASCII text). The files are named according to the graph they are associ-ated with and their position in that graph’s collec-tion (e.g., 8-10.txt is the 10th summary for the 8th line graph, and is located in the directory named8). The root of the distribution package contains a directory of original image files for the line graphs (named “line graphs”), the initial sentences describ-ing each graph’s intended message (which was pro-vided to the participants) in sentences.txt, and a README file describing the corpus layout.
The corpus is easily loaded with NLTK (Loper and Bird, 2002) using these Python commands:
from nltk.corpus import PlaintextCorpusReader LGSroot = './LGSummaryCorpus/summaries' corpus = PlaintextCorpusReader(LGSroot, '.*')
Acknowledgments
This work was supported in part by the National In-stitute on Disability and Rehabilitation Research un-der Grant No. H133G080047.
References
Ahmet Aker and Robert Gaizauskas. 2010. Model sum-maries for location-related images. In Proceedings of the Seventh Conference on International Language Resources and Evaluation, LREC ’10, pages 3119– 3124, Malta, May. ELRA.
Sandra Carberry, Stephanie Elzer, and Seniz Demir. 2006. Information graphics: an untapped resource for digital libraries. In Proceedings of the 29th Annual International ACM SIGIR Conference on Research and Development in Information Retrieval, SIGIR ’06, pages 581–588, Seattle, August. ACM.
5www.cis.udel.edu/~mccoy/corpora
Seniz Demir. 2010.SIGHT for Visually Impaired Users: Summarizing Information Graphics Textually. Ph.D. thesis, University of Delaware, February.
Leo Ferres, Petro Verkhogliad, Gitte Lindgaard, Louis Boucher, Antoine Chretien, and Martin Lachance. 2007. Improving accessibility to statistical graphs: the iGraph-Lite system. In Proceedings of the 9th Inter-national ACM SIGACCESS Conference on Computers and Accessibility, ASSETS ’07, pages 67–74, Tempe, October. ACM.
L. Hollink, A. Th. Schreiber, B. J. Wielinga, and M. Wor-ring. 2004. Classification of user image descriptions.
International Journal of Human-Computer Studies, 61(5):601–626, November.
Corinne J¨orgensen. 1998. Attributes of images in de-scribing tasks. Information Processing and Manage-ment, 34:161–174, March–May.
Edward Loper and Steven Bird. 2002. NLTK: The nat-ural language toolkit. InProceedings of the ACL-02 Workshop on Effective Tools and Methodologies for Teaching Natural Language Processing and Compu-tational Linguistics, pages 63–70, Philadelphia, July. ACL.
Kathleen F. McCoy, M. Sandra Carberry, Tom Roper, and Nancy Green. 2001. Towards generating textual summaries of graphs. InProceedings of the 1st Inter-national Conference on Universal Access in Human-Computer Interaction, UAHCI 2001, pages 695–699, New Orleans, August. Lawrence Erlbaum.
Ehud Reiter and Somayajulu Sripada. 2002. Should cor-pora texts be gold standards for NLG? In Proceed-ings of the Second International Conference on Natu-ral Language Generation, INLG 2002, pages 97–104, Harriman, New York, July. ACL.
Deb K. Roy. 2002. Learning visually grounded words and syntax for a scene description task. Computer Speech & Language, 16(3–4):353–385, July–October. Alan F. Smeaton and Ian Quigley. 1996. Experiments on using semantic distances between words in image cap-tion retrieval. InProceedings of the 19th Annual Inter-national ACM SIGIR Conference on Research and De-velopment in Information Retrieval, SIGIR ’96, pages 174–180, Zurich, August. ACM.
Alicia Tribble. 2010. Textual Inference for Retrieving Labeled Object Descriptions. Ph.D. thesis, Carnegie Mellon University, April.