B-cell and T-cell Leukemia Classification using Genetic
Algorithm, PCA, SVM and ANN
Sakshi Sharma
Computer Science and Engineering Thapar University, Patiala, India
Ajay Kumar
Computer Science and Engineering Thapar University, Patiala, India
ABSTRACT
Microarray technology can be used for learning number of genes expressions at one time. In recent years, DNA microarray method has a large influence in deciding the informative genes which originates cancer. The important step is the extraction of relevant genes in analyzing microarray cancer data. In this paper, microarray classification is done in two phases. In the first phase, a hybrid approach of principle component analysis is and genetic algorithm is applied on leukemia microarray dataset for extracting relevant features. Feed forward back propagation neural network is used and support vector machine for the classification purpose in the second phase and finally their results are compared.
Keywords
Feature extraction, micro array gene expression, principle component analysis, genetic algorithms, feed forward back propagation neural network, support vector machine.
1.
INTRODUCTION
Deoxyribonucleic acid (DNA)[1] microarray technology enables us to find the number of gene expressions concurrently. Various microarray gene expression datasets can be accessed publicly from the Internet. A microarray dataset consists of a few numbers of samples and each sample consists of around 8000 genes(features). Matrices are generally used to represent gene expression data, where columns signify samples and the rows signify genes[2]. These matrices are known as gene expression matrix. For the analysis of cancer disease, gene expression data can be utilized.
From DNA microarray gene expression data is represented by several genes with only a few samples(observations). Classification, clustering and prediction methods are used for analyzing the data[3]. The classification of biological data is one significant application of gene expression data. In microarray technology tissue, samples are categorized with the help of gene expression profiles of tissues as one of the subtypes of cancer.
Curse of dimensionality problem[4-5] is one of the major issue exists in the analysis of microarray data. This hides the necessary facts of dataset and can leads to computational uncertainty. Therefore, for analyzing microarray cancer data, the extraction of relevant genes remains an important step.
Microarray data classification [6] involves three steps namely, feature extraction, feature selection and classification. Principle component analysis(PCA) is used for feature extraction, genetic algorithm for feature selection and then applied feed forward back propagation neural network(FFBNN) and support vector machines(SVM) for precisely classifying the genes into their respective types. These algorithms are applied on leukemia cancer dataset to classify data into one of cancer category (either B cell or T cell Leukemia). Performance of classification is assessed using performance metric error rate and accuracy.
Hence, in this proposed methodology. An efficient combination of feature extraction and classification techniques is used which provides better performance. In previous approaches in the literature, The problem of huge memory requirement and slow speed of probabilistic neural networks was faced[7]. Further, the comparative study of classification accuracy using FFBNN and SVM algorithms is provided.
Rest of the paper is organized as follows. In Section II, a brief overview of principle component analysis is presented, genetic algorithm and presents key components of the paper. The proposed work to select the features and to classify the microarray data using PCA, GA and FFBNN and SVM is presented in section III. Experimental results obtained are given in section V. Section VI concludes the paper with future scope.
2.
KEY COMPONENTS2.1 Principle Component Analysis
Principle component analysis (PCA)is a statistical method for finding a few numbers of uncorrelated variables from a large data set that are termed as principle components [8]. The main principle behind PCA is to reduce dimensionality of dataset that consists number of interrelated variables, while maintaining most of the variation existing in the dataset and retaining the characteristics of data[6]. To achieve this goal Eigen vectors of covariance matrix are computed and each principle component is corresponding to one Eigen vector. These principle components are ordered such that few components of beginning are responsible for retaining most of the variation.
2.2 Genetic Algorithm
A genetic algorithm is based on the concept of natural selection that owns the theory of survival of the fittest[9]. It is a method to resolve optimization problems. Genetic algorithms (GA) belong to a category of evolutionary algorithms, which uses three basic operators’ selection, crossover and mutation to find a solution of an optimization problem[10]. In case of GA, a population of individuals is repeatedly modified. To produce the children candidates for the next generation the genetic algorithm randomly chooses candidates from the current population and uses them as parents at each step. The population evolves towards an optimal solution, over consecutive generations[11].
2.3 Feed Forward Back Propagation Neural
Network
method by which mean squared error of the output calculated by net is minimized[13].
2.4 Support Vector Machine
SVM[14] is a supervised learning algorithm that is used for classification purpose. The algorithm depends on the concept of a decision plane(hyperplane). A decision plane has decision boundaries that separate objects into their respective class labels.SVM tries to minimize classification error and maximizes margin, hence it is also known as maximum margin classifier[15].
3.
RELATED WORK
A successful cancer classification has been performed by various researchers. Shreepada et al.[6] used a hybrid technique of Principle Component analysis and genetic algorithm for feature extraction. In second phase they used Probabilistic Neural Network as a classifier and then implement Genetic algorithm to optimize PNN topology. They applied technique on Diffuse Large B-cell Lymphoma, Colon Tumor, Diffuse Large B-cell Lymphoma and Leukemia, Acute myeloid leukemia(AML) and ALL.
Faroun et al.[11] Enhanced multi-classification process by choosing optimal features set, and then using this feature set as an input for training. Dimensionality of the data was reduced by selecting a subset. They used a genetic search to find all possible feature subsets. They proposed a new measure for the computation of information gain that each features subset provides and applied as a fitness function of a genetic search. Experiments were performed on the KDD99 dataset for classifying intrusions of DOS network with 41 features that exists. Multi-layered neural network was applied on the obtained features. The proposed method can improve both learning runtime and the classification rate.
Lee et al.[16] developed a methodology for analyzing the gene expressions data. For feature extraction, they used a metric mechanism with the property that metric expression of a gene of a class should be different from the other but in the same class the variation should be as little as possible. They used metric mechanism fit in with this property. For classifying samples into correct category, they used SVM and applied the methodology on leukemia microarray gene expression dataset.
Saravanan et al.[17] proposed a method based on SVM for classification of cancer data by utilizing minimum number of microarray gene expressions. They proposed a novel method to improve performance for classification of cancer by using a few gene expression data. It involves classification with individual gene and gene subset ranking. Same classifier is used to select and classify features. They applied this methodology to three publicly available cancer gene expression datasets which are Liver, Lymphoma and Leukemia. They tested three distinct classifiers K-nearest neighbor, linear discriminant analysis and SVM-one against all. The results show that SVM classifier give improved performance as compared to the other two classifiers based on all the three datasets.
Victoire et al.[18] suggested a hybrid gene selection approach and applied approach on different microarray gene expression datasets of Colon, Leukemia, and Lymphoma. This method selects genes in two stages. In first stage, genes are selected with the entire sample by using mutual information followed by only unclassified samples augmented variance ratio. In second stage, feed forward back propagation is used for classifying the samples.
Vinayababu et al.[19] proposed an efficient methodology for classifying microarray gene data. Initially, they have used genetic algorithm to reduce dimensionality, next selected features were applied to feed FFBNN for classification.
Li et al.[20] proposed multiple approaches for feature selection and feature extraction. PCA and partial least square were implemented for extracting the features. They have used genetic algorithm for the feature selection; and SVM and KNN for classification purpose. The accuracy of feature subset was tested.
4.
PROPOSED SCHEME
Here, an efficient methodology for classification of microarray gene cancer data is proposed. In this methodology PCA, Genetic Algorithm for feature extraction/selection and FFBNN and SVM is applied for classification purpose. Figure 1 shows the pictorial representation of proposed methodology.
Fig.1. leukemia microarray gene classification techniques structure
Detailed description of method is described in following steps:
Input: m×n size metric where n is the number of genes(features/dimensions) and m is number of samples.
Output from phase I: Reduced feature subset after applying PCA and Genetic algorithm.
Output from phase II: Accuracy and error rate as classification results after applying FFBNN and SVM classification algorithm and SVM algorithm separately.
Phase I:
4.1 Principle Component Analysis
Initially, PCA on leukemia microarray dataset is applied. PCA was proposed by Pearson in 1901 and was used by various researchers (Shreepada et al.[6], Li et al.[20], Zhou et al.[21], Bu et al.[22] and many more). Same algorithm in the experiment is applied.
Following flowchart represents the steps of the algorithm as proposed by developer.
Microarr ay leukemia
gene expressio
n dataset
Feature Extraction/
Selection by using PCA and Genetic algorithm
Cancer gene classificati
Fig. 2: Flow chart of PCA algorithm
4.2 Genetic algorithm
Reduced principle components are given as an input to the genetic algorithm. GA was proposed by Holland at the University of Michigan during 1960’s to 1970’s. Their work was used by various researchers such as Faroun et al.[11], Li et al.[20], Hernandez et al.[23]. Same genetic algorithm is also used for the feature selection. This algorithm works as shown in Fig. 3. f(xi) is a fitness value of an individual depends on the
fact that the value is greater than the mean of population or not.
Fig. 3. Flow chart of Genetic algorithm
Phase II:
4.3 Feed Forward Back Propagation
[image:3.595.312.549.158.310.2]Reduced features obtained after the application of GA are now applied to FFBNN for classifying samples into correct cancer type.FFBNN is a supervised learning algorithm. Figure 2 represents structure of FFBNN. It has layers of processing elements.
Fig.4. FFBNN Neural Network Architecture [13]
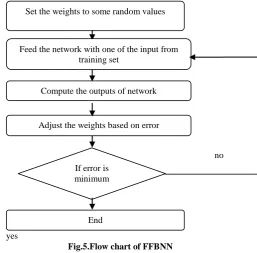
The first conceptual model of an artificial neural network was developed by McCulloch and Pitts and used by various researchers such as Abdalla et al. [13], Victoire et al.[18], Vinayababu et al.[19], Darby et al.[24]. The working of FFBNN is shown in Fig. 5.
yes
Fig.5.Flow chart of FFBNN
4.4 Support vector machine:
SVM algorithm was invented in 1963 by Vapnik and Alexery Ya. Chervonenkis and was used by researcher like Leeet al.[8], Saravanan et al.[17] ,Li et al.[20]etc. The aim of the algorithm is to determine the location of decision boundaries to optimally separate the classes. In case of two class classification problems where classes can be separated linearly SVM selects hyperplane which minimizes the generalization error and maximizes margin. Training points that are nearest to the hyperplane are utilized for measuring the margin and the training points are called support vectors.
Set the weights to some random values
Feed the network with one of the input from training set
Compute the outputs of network
Adjust the weights based on error
If error is minimum
End
no
yes
Initialize the population
Evaluate the fitness of individual by fitness function f(xi)≥mean(f(x))
Select the best individuals to produce offsprings
Apply crossover operator
Apply mutation operator
Evaluate fitness of each individual population
Determine the average fitness population
If terminating condition is true
End
no Mean center the data of matrix A to find mean
centered data matrix B
Determine the Covariance matrix C of mean centered matrix B such as C=BTB
Obtain the Eigen vectors of the covariance matrix C
Sort the Eigen vectors in decreasing order of the Eigen values
[image:3.595.55.283.373.736.2] [image:3.595.306.564.389.642.2]Training points can be separated linearly for a two class
classification(
y
{ 1, 1}
) problem provided that there is a weight vector w and scalar b such that yi(w.xi+b)-1≥0.Hypothesis space is represented as the set of functions
Fw,b=sign((w.x+b)) [25] (1)
Finding of hyper-plane to maximize distances between classes along with a perpendicular line to the hyper-plane can be attained by answering following optimization problem
[25] (2)
If classes are not separated linearly, SVM attempts to find hyperplane for maximizing the margin along with minimizing misclassification errors. For this there is a Constraint that for a particular class all of its training points rests on optimal hyperplane’s same side can be relaxed with the use of a new ‘slake variable’ ≥0. A constant C such that ∞>C>0 is used to control a tradeoff between margin and misclassification error. Equation 2 for a non-separable data can be written as follows
] [27] (3)
Above algorithm is to handle linear decision surfaces.
5.
RESULTS AND ANALYSIS
Proposed classification methodology is implemented in the MATLAB platform version 7.10.0.499 (R2010a) and is assessed by using the leukemia microarray gene expression data. Dataset that is publicly available from the websitewww.physionet.org is collected. The dataset contains 98 samples and in each sample there are 7129 genes. Among these 98 samples, 1 to 50 samples are BCELL class type and 51 to 98 samples are TCELL class type. For dimensionality reduction this dataset is applied to PCA and GA. Finally, these selected features are applied to the FFBNN and SVM separately for training and testing purposes. In FFBNN, 70% data is used for training purpose and rest of the 30% data for testing. The results obtained after applying proposed methodology are presented as follows:
5.1 Principle Component Analysis results
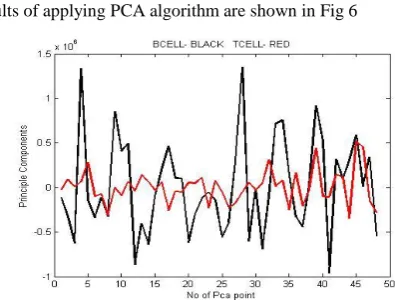
Results of applying PCA algorithm are shown in Fig 6Fig.6. PCA components obtained as a result of applying Principle Component Analysis algorithm
This graph plots principle components obtained that are always less than number of dimensions. Most of the information is scattered along these components and dimensionality has been reduced. Black lines represent BCELL principle components and Red line represents T CELL components.
5.2 Genetic Algorithm results
[image:4.595.323.532.115.248.2]Results of applying Genetic algorithm are shown in Figure 7 and Figure 8.
[image:4.595.320.532.124.374.2]Fig.7. Reduced B CELL features after applying GA
Fig.8. Reduced T CELL features after applying GA
Above graphs shows reduced BCELL and TCELL features with Eigen values plotted along with Y axis.
5.3 Feed Forward Back Propagation
Algorithm results
newff function of matlab is used to train the data.
Fig.9. training state using nntraintool
Figure 9 represents gradiants and validation checks as training state.
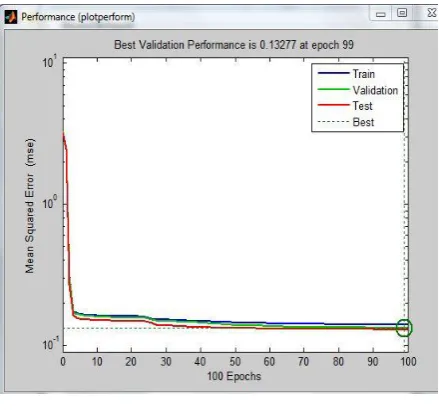
[image:4.595.313.540.504.677.2] [image:4.595.71.269.506.656.2]Fig.10. Performance graph using nntraintool
Figure 10 plotted between predicted and target values show minimized Mean Square Error(MSE). This indicates the iteration at which mean square error becomes minimum.
Fig. 11.snapshot of regression using nntraintool
Training, validation and testing data is represented by figure 11 above plots. In each plot dashed line represents target that is equal to difference between perfect result and outputs. By using solid lines best fit linear regression line between outputs and inputs is represented. R value is for relationship between outputs and targets. R=1 means there is a perfect linear relationship between targets and outputs. R is close to zero means there is no linear relationship between outputs and targets.
As the end results accuracy obtained is 84.9201% and Error rate is 0.1508.
[image:5.595.311.546.73.251.2]5.4 Support vector machine results
Fig. 12. A linear SVM classifier for leukemia cancer data
Figure 12 represents linear classification of data obtained after application of genetic algorithm. Hyper plane is responsible to classify data into correct category. Accuracy achieved using this SVM classifier is 71.7201% and error rate is 0.2827.On the application of proposed methodology on leukemia it is observed that the classification accuracy of FFBNN is more as compared to SVM accuracy for this dataset.
6.
CONCLUSION AND FURTURE WORK
In this paper, an efficient methodology is introduced for classifying the microarray genes into their respective leukemia cancer subtype. To achieve this objective, a two-phase classification model is designed and acceptable results are received. A FFBNN and SVM classifier and feature extraction/selection using hybrid PCA and GA have been developed. Beside of reducing number of features classifier’s was built with superior classification performance. Finally, ANN results are compared to SVM for same dataset. As a future work this methodology can be applied on other datasets having multiple classes.
7.
REFERENCES
[1] V. Trevino, F. Falciani and H. Barrera-saldana, “DNA microarrays: A Powerfull Genomic Toolfor Biomedical and Clinical Research”, Molecular Medicine, 13(9-10), 527-541, 2007.
[2] K. Vaishali, A. Vnayababu, “A Classification of Microarray Gene Expression Data Using Hybrid Soft Computing Approach”, International jounral of Computer Science Issues(IJCSI), 9, 246-255, 2012.
[3] D. Nguyen, D. Rocke, “Classification of Accute Leukemia Based on Gene Expression from DNA Microarrays Using Partial Least Squares”, Methods for microarray data analysis:papers from CAMDA Springer,109-124, 2001.
[4] M. Verleysen and D. François, “The Curse of Dimensionality in Data Mining and Time Series Prediction”, 8th
international conference on Artificial Neural Networks IWANN,LNCS Springer, 3512, 758-770, 2005.
[image:5.595.63.277.325.544.2]Science,54, 301-310, 2015.
[6] R. Sreepada,S. Vipsita and P. Mohapatra,“An Efficient Approach for Classification of Gene Expression Microarray Data”, Emerging Applications of Information Technology(EAIT) 4th international conference, 344-308,2014.
[7] S. Sawant and P. Topannavar, “Introduction to Probablistic Neural Network-Used for Image Classification”, International Jounral ofAdvanced Reasearch in Computer Science and Software Engineering(IJARCSSE), 5, 279-283, 2015.
[8] Jolliffe, I. T., “Principle Component Analysis”, Springer Series in Statistics, Vol 2, 2002.
[9] A. Eiben, P. Raue and Zs. Ruttkay, “Genetic algorithm with multi-parent recombination”, 866, 78-87, 1994.
[10]G. Joshi, “Review of Genetic Algorithm:An optimization Technique”, International Jounral of Advanced Research in Computer Science and Software Engineering(IJARCSSE), 4, 802-805, 2014.
[11]K. Faraoun and A.Rabhi, “Data dimensionality reduction based on Genetic selection on feature subsets”,INFOCOMP journal of computer Science, 6(3),33-46,2007.
[12]J. Yayad, M. Yadav and A. Jain, “Artificial Neural Network”, International Jounral of Scientific Research and Education, 1, 108-118, 2013.
[13]O. A. Abdalla, M. N. Zakaria, S. Sulaiman and W. F. W. Ahmad, “A comparision of feed-forward back- propagation and radial basis artificial neural networks”, International Symposium on Information Technology, 2, 994-998, 2010.
[14]C. Cortes and V. Vapnik, “Support-vector networks”, Machine Learnig(Springer), 20, 273-297, 1995.
[15]H. Bhavsar and M. Panchal, “A Review of Support Vector Machine for Data Classification”, International Jounral of Advanced Reasearch in Computer Science & Technologies(IJARCET), 1, 185-189, 2012.
[16]Y. Lee and C. Chao, “A Data Mining Application to Leukemia Microarray Gene Expression Data Analysis”,
International Conference on Informatics Cybernetics and Systems (ICICS), Kaohsiung, Taiwan,2003.
[17]R. Mallika and V. Saravanan, “An svm based classification method for cancer data using minimum microarray gene expressions”, World Academy of Science, Engineering and Technology International Journal of Computer, Electrical, Automation, Control and Information Engineering, 4(2), 266-270, 2010.
[18]P. G. Kumar, J. Rathinaraja, T. Aruldoss and A. Victoire, “A combined MI-AVR approach for informative gene selection”,2nd
International conference on Sustainable Energy and Intelligent System (SEISCON),870-875,2011.
[19]P.K. Vaishali and A. Vinayababu, “Application of Microarray Technology and Softcomputing in Cancer Biology: A Review",International Journal of Biometrics and Bioinformatics (IJBB), 5(4), 225-233, 2011.
[20]B. Li, C. Zheng, D. Huang, and L.Zhang, K. Han, “Gene expression data classification using locally linear discriminate embedding”, Computers in Biology and Medicine, 40(10), 802-810,2010.
[21]X. Zhou, L. Guo, T. Wang and Y. Hu, “Text Feature Selection Based on Class Subspace” IEEE International Conference on Data Mining Workshop,267-273, 2014.
[22]H. Bu , S. Zheng and F. Qian, “tumer classification byComputer PCA with relief wrapper”, International Conference on Science and Information Technology(ICCSIT), pp. 514-517, 2009.
[23]J. C. H. Hernandez, B. Duval and J.K. Hao, “A Genetic Embedded Approach for Gene Selection and Classification of Microarray Data, Lecture notes in Computer Science, Springer, 4447, 90-101, 2007.
[24]E. Darby; T. Nettimi, S. Kodali and L. Shih, “Head and neck cancer metastasis prediction via artificial neural networks”,IEEE workshop on Computational Systems Bioinformatics Conference (CSBW'05),43-44,2005.