Balance Automatic Control System Load 3 Phase
Fanny Doringin
Department of ComputerEngineering, Manado State Polytechnic
Marson James Budiman
Department of ComputerEngineering, Manado State Polytechnic
Stephy Walukow
Department of ComputerEngineering, Manado State Polytechnic
ABSTRACT
All electrical energy is generated, transmitted, and distributed in the form of a three-phase system. Ideally, the perceived stress of the equipment is a three-phase voltage with a sinusoidal and balanced shape. However, the unbalanced loading and impedance of the line impedance causes the voltage felt by the equipment to become unbalanced. For large power consumers, such as educational institutions,s hotels, offices, shopping centers, industries, etc. are connected with 3 phase electricity (phase R, S and T). In the planning and installation of electrical installations by installers (Electrical Experts) it is always planned that the load connected to the R, S and T phases is attempted evenly (equally), but in operation (ON / OFF) electricity is not always evenly distributed in each phase, so it occurs unbalanced load between phases. As a result of unbalanced load between phases causes electrical power losses. The purpose of this study is to test the intelligence of the control of the balance of the three-phase electrical load and compare the unbalanced load current with the load current after being balanced. The results obtained are in the form of a prototype control of the three-phase electric load balance, which can control unbalanced and balanced currents on the input side sensor as well as the voltage on the sensor output side. From the results of testing the current at unbalanced load with the current after being balanced, obtained phase unbalanced phase data R = 4.43, S phase = 1,162 phase T = 3.18 after being balanced by the system to R = 2.78, phase S = 3.27 phase T = 3.27, from the results of measurements and calculations in theory the average percentage error is obtained for each current test in phase R, S, T = 0.01 A
Keywords
Load balance, load imbalance, 3 phase load balance control system
1.
INTRODUCTION
Unbalanced loads in phases R, S and T will make the current flow in the neutral point. The greater the unbalanced load will also make the greater the current flowing at the neutral point. This makes electricity wasted or power loss occurs. In addition to loss of power, this unbalanced load will contribute to the distribution of power by the transformer to a lower level. To minimize the loss of electrical power caused by unbalanced load operations and over time the development of the electrical installation takes place without regard to the initial planning of the installation of the electrical installation, and if there is a loss of one or two phases of electricity, a system control that can detect and regulate the load in phase R, the S phase and the T phase are relatively balanced, besides that the Control system created can also provide information to the user if there is a loss of one or two phases to avoid power loss. The integrated system in making an unbalanced load loss control system uses Lab View and Arduino Uno controllers to function as a regulator of the overall work of the system [1] [2], the current sensor that functions as a detector
of load current changes [3], the voltage of the sensor that functions to detect phase loss [4], a program algorithm (flow chart) that functions for the steps that must be taken in programming and modeling systems [5] [6]. To run the system, we need a program that is embedded into the Arduino Uno microcontroller, where the software used to create the program is IDE View Lab, with reference to the flowchart created [7].
2.
METHODOLOGY
System control design from unbalanced power loss, the system design process is carried out which includes, hardware design, software design, system testing through laboratory testing to obtain current and voltage data in connection with system work.
2.1
Designing a System Model
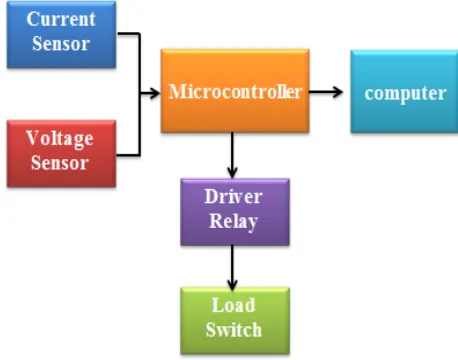
The design of the system model aims to describe and determine the components that support the work of automatic control systems, unbalanced power loss in R, S, T. phases. The system model is shown in Figure 1, with the following job description:
[image:1.595.323.552.518.698.2]Current sensor, functions as a detector of changes in load current on a 3-phase network. Missing phase detection sensor, serves to detect phase loss from a 3 phase system. Lab View and Arduino Uno controllers, which function as media controllers in the process of managing load supply, use 2 controllers that function as slave masts. Relay, serves as a Triac input for Switching power load. Triac, functions as a switch of power supply to the load
34
2.2
3 Phase Load Balance Switch Model
Table 1. Main Contactor Load Balancing Switch Model Phasa
Conditions
Main Contactor 3 lines Phasa R,S,T
R1 R2 R3 S1 S2 S3 T1 T2 T3
R>S,T 0 1 1 1 1 1 1 1 1
S>R,T 1 1 1 1 1 0 1 1 1
[image:2.595.36.300.99.190.2]T>R,S 1 1 1 1 1 1 1 0 1
Table 2 .Switch Load Balancing Switch Model Phasa
Conditions
3 lane balance contactor Phasa R,S,T Ket K1 K2 K3 K4 K5 K6
R>S,T 0 0 0 0 1 0 KR1=0 0 0 0 0 0 1 KR1=0 S>R,T 1 0 0 0 0 0 KS3=0 0 1 0 0 0 0 KS3=0 T>R,S 0 0 1 0 0 0 KT2=0 0 0 0 1 0 0 KT2=0
Tables 1 and 2 are automatic 3-phase load balancing control models with 2 combinations of each phase. That is, if phase R> of S and T, table 1 shows Switch KR1 will be "OFF" and K5 and K6 will be "ON" (table 2) according to the condition of the large load ie the current detected if the phase path is more than 10% of the phase current another.
2.3
Designing ACS758 Current Sensor
Circuits
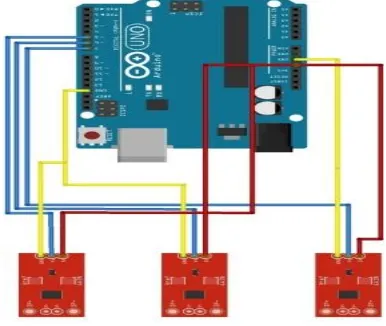
[image:2.595.324.543.185.339.2]In Figure 2. The system is integrated with 3 ACS758 type current sensors with a maximum capacity of 100 Amperes. The sensor input side is connected to the R, S, T phases while the output side is connected to the Microcontroller. The current sensor connection with a microcontroller where the Current Sensor R is connected to pin A3, the current sensor S is connected to A4, and the current sensor T is connected to A5 on Arduino. Where is the blue line. The yellow line is connected to Ground (GND), and the red line is connected to the 5volt pin on Arduino.
Fig 2: Current Sensor Circuits
2.4
Desaining Voltage Sensor Circuits
The voltage sensor that serves to detect the missing phase on the side of phase R, S, T is designed by using a voltage rectifier that is adjusted to the input voltage of the microcontroller Digital pin is 5 Volt DC, where the voltage sensor input is connected to the 3 phase network between phase and neutral and the sensor output side with the voltage generated from the rectifier circuit is 5 volts connected to pins 2,3 and 4Fig 3: Voltage Sensor Circuits
2.5
Desaining Relay Circuits
[image:2.595.317.540.441.640.2]The relay used in the system serves to provide a trigger to the Triac in accordance with the control conditions obtained from the current value that detects the load imbalance. The relay used in the system uses a microcontroller that is separate from the microcontroller used by current and voltage sensors. With a total of 15 relays connected to Pins 2-13, A0 - A2.
Fig 4: Relay Circuit
3.
RESULT AND DISCUSSION
[image:2.595.71.264.582.745.2]Table 1. Flow measurement under conditions R > of S and T
[image:3.595.57.277.94.219.2]In Table .1 is control testing by inputting the load and measuring the current sensor output, which supplies different loads in each phase R, S, and T. Then the system will process the data and if the system obtains data where there is one phase with a load which is 10% greater than the other two phases, the system will move the load from that phase to a phase that has a smaller load than the three phases to make the load in all three phases balanced.
Fig 5. Load Graph of Phase R > S and T
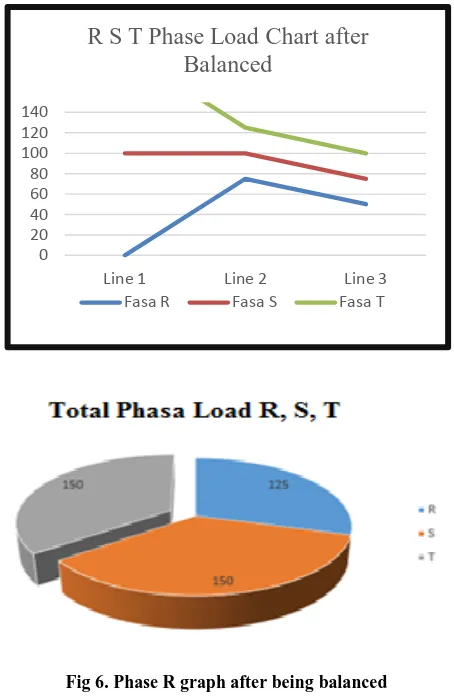
Phaseload R after being balanced by the system
Fig 6. Phase R graph after being balanced
3.2
Testing The Sensor Voltage Output
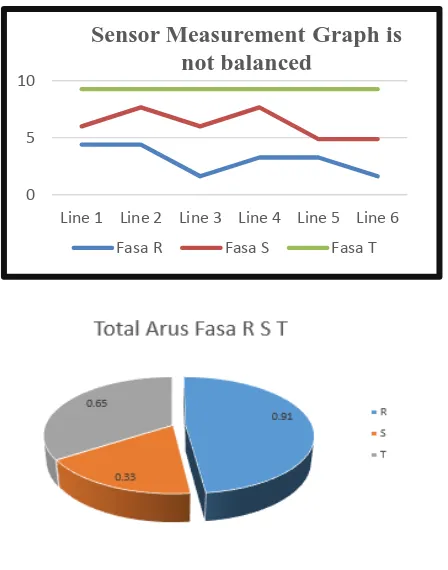
In the measurement of current sensor output there is an unbalanced current condition shown in table 2Table 2. Measurement of sensor output when the load is unbalanced
NO
Measurement of Unbalanced Sensor Voltage Output
PHASE
R S T
1 4.43 1.62 3.18
2 4.35 3.20 1.72
3 3.16 4.46 3.18
4 3.27 4.54 1.70
5 3.09 1.69 4.36
6 1.74 3.34 4.50
In table 2. this is the unbalanced output data that is received by the system where in test 1 and 2 there is the value of the phase sensor voltage output R> S and T, as well as in tests 3 and 4 where the phase S> R and T, and in Tests 5 and 6 obtained the results of phase measurement T> from R and S. From the results of the measurement of data for each phase if there is one phase that is greater than the other phases, the system will move the phases that have more burden to the less phases. Table 3. Shows the results of the measurement of output voltage after being balanced by the system.
0 20 40 60 80 100 120 140
Line 1 Line 2 Line 3
Load Chart R Phase > S and T
Fasa R Fasa S Fasa T
0 20 40 60 80 100 120 140
Line 1 Line 2 Line 3
R S T Phase Load Chart after
Balanced
[image:3.595.55.281.325.630.2]36
Fig 7. The measurement chart of the sensor’s unbalanced output voltage
Tabel 3. Balanced current sensor output measurement
NO
Balanced Sensor Voltage Output Measurement
FHASE
R S T
1 2.78 3.27 3,27
2.83 3.22 3.32
2 3.17 2.83 3.32
3.07 2.88 3.32
3 3.32 3.22 2.88
3.32 3.36 2.73
4 3.36 2.83 3.32
In table 3. This is the output data that has been balanced by the system
[image:4.595.64.270.398.583.2]Fig 8. Balanced Sensor Measurement Chart
Table 0. Phase Testing is lost at Voltage R, S, T
NO
Phasa Testing is Lost at Voltage
R, S, T
Information FHASE
R S T
1 0 3.27 3,27 System trip
2 2.83 0 3.32 System trip
3 3.17 2.83 0 System trip
4 0 0 0 System trip
In table 4. this is the missing phase test data with the condition that when one phase is zero (0) then the system trip
4.
CONCLUSIONS
Test results Automatic control system of three-phase electrical load balance, can be measured unbalanced and balanced current on the sensor input side (table 1) and the voltage at the output side of the phase sensor R, S, T (tables 2 and 3). From the results of testing the load and stress load is not balanced with the current and voltage after being balanced, the phase data is unbalanced, phase R = 4.43, phase S = 1.162 phase T = 3.18. After being balanced by the system to R = 2.78, S phase = 3.27 phase T = 3.27, From the results of measurements and
calculations in theory the percentage error is obtained for the average for each test current in phase R, S, T = 0, 01 A. With the implementation of an automatic control system that immediately detects phases to overload, where if there is an overload of more than 10% in one phase, the system will balance the load by activating the phase switches R, S, T by moving more phase paths to the phase path that is lacking until a load balance is obtained.
5.
ACKNOWLEDGMENT
Thanks to the Ministry of Research and Technology and Higher Education and the Manado State Polytechnic, who have funded this research with the PTUPT program in 2019 so they can conduct research and work well.
6.
REFERENCES
[1] Budiharto, W, Interfacing Komputer dan Mikrokontroller, Elex Media Komputindo, Jakarta, 2004. [2] Fanny Jouke Doringin, .Sistem Kendali Penyeimbang
Beban Tiga Fasa Pada Jaringan Distribusi. Tesis 2010 [3] Stephy Beatrix Walukow, Sistem Kendali Jalur Fasa
Pada KWH Meter Pelangan Listrik Daya Besar. Tesis UNHAS, 2010
[4] I Wayan Suwardana, I Putu Sutawinaya dan I Ayu Rai Wulandari ,Studi Analisis Rugi-Rugi Daya pada Penghantar Netral Akibat Sistem Tidak Seimbang di Jaringan Distribusi Gardu KA 1495 Penyulang Citraland Menggunakan Simulasi Program ETAP 7.0. JURNAL LOGIC. VOL. 14. NO. 3. NOPEMBER 2014
[5] Hanny H. Tumbelaka, Thian, Marselin, Aplikasi Active Power Filter Tiga Fasa Tipe Seri Berbasis Jaringan Syaraf Tiruan Untuk Mengatasi Sumber Tegangan Yang Terdistorsi, ITS,
[6] Peng F. Z, Harmonic sources and filtering approaches, Industry Applications Magazine, IEEE, 2001 7(4):
p.18-0 5 10
Line 1 Line 2 Line 3 Line 4 Line 5 Line 6
Sensor Measurement Graph is
not balanced
Fasa R Fasa S Fasa T
0 5 10
Line 1 Line 2 Line 3 Line 4 Line 5 Line 6 Line 7
Phase Sensor Voltage Measurement
Chart
[image:4.595.57.280.614.744.2]25.
[7] Green, T.C. and J.H, Marks, Control techniques for active power filters, Electric Power applications, IEEE Proceedings, 2005, 152(2):pp.369-381.
[8] Temurtas, F., et al., Harmonic detection using feed forward and recurrent neural networks for active filte, Electric Power Systems Research, 2004, 72(1): pp. 33-40.
[9] Insan Hakim Maliki Priangga, Analisa Ketidakseimbangan Beban Terhadap Rugi-Rugi Daya Pada Saluran Dan Transformator Distribusi 20kv (Studi Kasus Pada Penyulang Badai Di Gardu Induk Teluk Betung), Skripsi, Universitas Lampung, 2016
[10] Setiatmoko Adi Prakoso, Iwa Garniwa M.K, Analisis Pengaruh Harmonik Terhadap Arus netral Transformator Pelanggan Industri, Bisnis dan Rumah Tangga, Universitas Indonesia 2014
[11] Ahmad Deni Mulyadi, ”Pengaruh Ketidakseimbangan Beban Terhadap Arus Netral dan Losses Pada Trafo Distribusi,” Metrik Polban, [online], vol 5, no 1, 24-28, 2011. http://jurnal.polban.ac.id/index.php/mesin/article/ download/23/20. (Accesed : 8 juni 2014)