http://dx.doi.org/10.4236/cn.2012.43024 Published Online August 2012 (http://www.SciRP.org/journal/cn)
Optimization of Security Communication Wired Network
by Means of Genetic Algorithms
Fabio Garzia1,2, Natale Tirocchi1, Michele Scarpiniti1, Roberto Cusani1 1
Department of Information, Electronics and Telecommunication Engineering, SAPIENZA University of Rome, Rome, Italy
2
Wessex Institute of Technology, Southampton, UK Email: [email protected]
Received April 8,2012; revised May 10, 2012; accepted June 12, 2012
ABSTRACT
The realization of security wired network is very critical when the network itself must be installed in an environment full of restrictions and constrains such as historical palaces, characterized by unique architectural features. The purpose of this paper is to illustrate an advanced installation design technique of security wired network based on genetic algo- rithm optimisation that is capable of ensuring high performances of the network itself and significant reduction of the costs. The same technique can be extended to safety system such as fire signalling.
Keywords: Security System; Genetic Installation Design Optimisation; Communication Network
1. Introduction
Thanks to the continuous technology development it is possible to realize new varieties of devices, sensors and other powerful instruments which allow to implement advanced safety/security systems that show all their power when they are properly integrated in higher level systems [1-3].
The integrated safety/security systems allows the per- sonnel to check directly each zone of the protected build- ing or infrastructure and to be immediately informed if a dangerous event takes place.
The integrated systems are generally divided into safety/ security sub-systems so that each sub-system is capable of working even in the case of malfunctioning of the other systems.
In this way an integrated system is capable of per- forming a plenty of advanced functionalities that prevent dangerous situations.
Each sub-system use a proper wired or wireless net- work to connect the control panel to the sensors.
It is well known that wired network offers, generally, a higher degree of security due to the fact that the trans- mitted information is sent in a confined way through copper or optical fibre cable while wireless transmission spread through the space and can be easily intercepted.
In historical buildings, where a plenty of pictures are present on the wall and on the ceiling, it is not so easy to find passages for cables and this represents a consider- able problem from the preservation of cultural heritage
point of view.
The purpose of this paper is to illustrate an optimal de- sign procedure for safety/security communication net- works that, thanks to Genetic Algorithms (GAs) [4-9], is capable of reaching the desired goal of preserving the architecture of building characterized by installation con- strains, such as the historical one, and of reducing the cost of installation, ensuring a high level of benefit/cost ratio.
2. The Safety/Security Installations
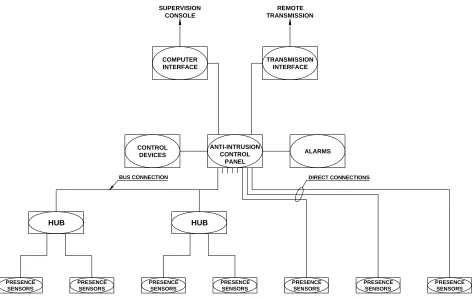
All the control panels related to the safety/security in- stallations (fire signalling, anti-intrusion, video surveil- lance) use, generally, a loop communication bus with hubs. Each control panel communicates with the supervi- sion consoles. The field sensors are connected to the control panel through the hubs and the loop bus while the elements that are located closer to the control panel are directly connected to it by means of a cable.
The block diagrams of the used safety/security instal- lations are shown in Figures 1-3.
The choice of the loop bus with hubs is generally made after a proper cost/benefit analysis. In fact the mentioned system ensures to transmit all the information from the sensors to the control panel and vice versa using only a wired bus composed by two or four thin copper wires or by a thin optical fibre.
In this kind of configuration the single sensors are not connected directly with the related control panels, in- creasing the amount of wire used for the installation with
FIRE SIGNALING
CONTROL PANEL
FIRE SENSORS
DIRECT CONNECTIONS
CONTROL DEVICES
COMPUTER INTERFACE SUPERVISION
CONSOLE
ALARMS REMOTE TRANSMISSION
TRANSMISSION INTERFACE
FIRE SENSORS
FIRE SENSORS
FIRE SENSORS
FIRE SENSORS FIRE
SENSORS
[image:2.595.89.510.83.341.2]FIRE SENSORS
Figure 1. Block diagram of the fire signalling installation.
BUS CONNECTION DIRECT CONNECTIONS
SUPERVISION CONSOLE
REMOTE TRANSMISSION
PRESENCE SENSORS
PRESENCE SENSORS
PRESENCE SENSORS
PRESENCE SENSORS
PRESENCE SENSORS
PRESENCE SENSORS
ANTI-INTRUSION CONTROL
PANEL
ALARMS CONTROL
DEVICES COMPUTER INTERFACE
TRANSMISSION INTERFACE
PRESENCE SENSORS
HUB HUB
Figure 2. Block diagram of the intrusion detection installation.
a consequent increase of the cost of the materials and of the human work, and reducing the reliability of the whole installation due to the high number of connections. The sensors are therefore connected directly with the hubs,
that are local devices which transmit the safety/security information received from the sensors to the control panel and vice versa, using a 2 - 4 copper wires or optical
[image:2.595.61.536.363.662.2]VIDEO SURVEILLANCE
TV COMPUTER
INTERFACE SUPERVISION
CONSOLE
REMOTE TRANSMISSION
TRANSMISSION INTERFACE
CAMERA CONTROL
KEYBOARD
MONITORS
CAMERA CAMERA
CAMERA CAMERA
CAMERA CAMERA
VIDEORECORDER
INPUT ALARMS
HUB HUB
BUS CONNECTION
[image:3.595.64.533.81.407.2]DIRECT CONNECTIONS
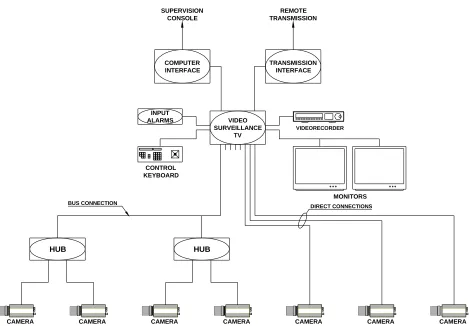
Figure 3. Block diagram of the video surveillance installation.
3. The Communication Bus of the
Installations
The use of a loop bus increases the reliability level of each single installation since, in the event of voluntary interruption (due, for example, to sabotage) or not vol- untary interruption of it, the data exchanged with the hubs towards a given direction can be exchanged using the other direction.
The fire signalling installation uses sensors that are directly connected to the bus while the intrusion detec- tion installation uses sensors that are connected to the bus using the hubs.
The hubs exchange continuously data with the field sensors, using a proper security protocol, verifying their functionality, and sending proper signalling messages to the control panel in the case of malfunctioning. The used installation architecture ensures high performance of the sensors efficiency.
In the event of alarm the system is capable of activat- ing the safety/security procedures in a short time.
4. Genetic Optimisation of the Sensors
Interconnections
The number of hubs, their position and the number of
sensors connected to each of them represents a typical optimisation problem where it is necessary to reduce as more as possible the installation costs, reducing as more as possible the number of hubs and positioning correctly them so that the amount of wire necessary to connect all the sensors to them is the shorter one.
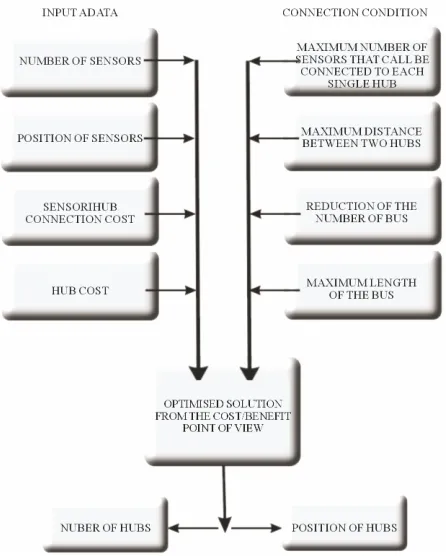
The input data are represented by: 1) position of the sensors; 2) position of the hubs; 3) sensor/hub connection cost; 4) hub cost.
The connection conditions are represented by: 1) maximum number of sensors that can be connected to each single hub;
2) maximum distance between two hubs;
3) reduction as more as possible of the number of hubs; 4) maximum length of the bus.
The scheme of the design optimization problem is shown in Figure 4.
Figure 4. Scheme of the design optimisation problem.
This problem can be solved using evolutionary strate- gies such as the one offered by the Genetic Algorithms (GAs) and evolutionary computation [4-9].
Genetic algorithms offer the great advantage of evolv-ing their behaviour to match with the behaviour of the final users, using a mechanism that is very similar to the one used by nature. Different genetic algorithm can be used to achieve the desired purpose, each characterised by peculiar features.
Genetic algorithms are considered wide range nu- merical optimisation methods, which use the natural pro- cesses of evolution and genetic recombination. Thanks to their versatility, they can be used in different application fields.
GAs are particularly useful when the goal is to find an approximate global minimum in a high-dimension, multi- modal function domain, in a near-optimal manner. Un- like the most optimization methods, they can easily han- dle discontinuous and non-differentiable functions.
The algorithms encode each parameters of the problem to be optimised into a proper sequence (where the alpha- bet used is generally binary) called a gene, and combine the different genes to constitute a chromosome. A proper set of chromosomes, called population, undergoes the Darwinian processes of natural selection, mating and mutation, creating new generations, until it reaches the final optimal solution under the selective pressure of the desired fitness function.
GA optimisers, therefore, operate according to the
following nine points:
1) encoding the solution parameters as genes; 2) creation of chromosomes as strings of genes; 3) initialisation of a starting population;
4) evaluation and assignment of fitness values to the individuals of the population;
5) reproduction by means of fitness-weighted selection of individuals belonging to the population;
6) recombination to produce recombined members; 7) mutation on the recombined members to produce the members of the next generation;
8) evaluation and assignment of fitness values to the individuals of the next generation;
9) convergence check.
The coding is a mapping from the parameters space to the chromosomes space and it transforms the set of pa- rameters, which is generally composed by real numbers, in a string characterized by a finite length. The parame- ters are coded into genes of the chromosome that allows the GA to evolve independently of the parameters them- selves and therefore of the solution space.
Once created the chromosomes it is necessary to choose the number of them which composes the initial population. This number strongly influences the effi- ciency of the algorithm in finding the optimal solution: a high number provides a better sampling of the solution space but slows the convergence. A good compromise consists in choosing a number of chromosomes varying between 5 and 10 times the number of bits in a chromo- somes, even if in the most of situations, it is sufficient to use a population of 80 - 100 chromosomes and that does not depend of the length of the chromosome itself. The initial population can be chosen at random or it can be properly biased according to specific features of the con- sidered problem.
Fitness function, or cost function, or object function provides a measure of the goodness of a given chromo- some and therefore the goodness of an individual within a population. Since the fitness function acts on the pa- rameters themselves, it is necessary to decode the genes composing a given chromosome to calculate the fitness function of a certain individual of the population.
The reproduction takes place utilising a proper selec- tion strategy which uses the fitness function to choose a certain number of good candidates. The individuals are assigned a space of a roulette wheel that is proportional to their fitness: the higher the fitness, the larger is the space assigned on the wheel and the higher is the prob- ability to be selected at every wheel tournament. The tournament process is repeated until a reproduced popu- lation of N individuals is formed.
(a)
(b)
[image:5.595.68.529.81.466.2](c)
Figure 5. Example of sensors distribution (a) and two examples (b, c) of possible connections to the hubs. Sensors are indi- cated with “S” while hubs are indicated with “H”.
The mutation is used to survey parts of the solution space that are not represented by the current population. If the mutation probability overcomes a fixed threshold, an element in the string composing the chromosome is chosen at random and it is changed from 1 to 0 or vice versa, depending of its initial value. To obtain good re- sults, it has been shown that mutations must occur with a low probability varying between 0.01 and 0.1.
children. The simplest technique is represented by the single-point crossover, where, if the crossover probabil- ity overcome a fixed threshold, a random location in the parent’s chromosome is selected and the portion of the chromosome preceding the selected point is copied from parent A to child A, and from parent B to child B, while the portion of chromosome of parent A following the random selected point is placed in the corresponding positions in child B, and vice versa for the remaining portion of parent B chromosome.
The converge check can use different criteria such as the absence of further improvements, the reaching of the desired goal or the reaching of a fixed maximum number of generations.
If the crossover probability is below a fixed threshold, the whole chromosome of parent A is copied into child A, and the same happens for parent B and child B. The crossover is useful to rearrange genes to produce better combinations of them and therefore more fitting indi- viduals. The recombination process has shown to be very important and it has been found that it should be applied with a probability varying between 0.6 and 0.8 to obtain the best results.
In our case it has been studied a very interesting ge- netic design solution that ensures cost reduction up to 70%.
It is now necessary to codify our design problem in a simple and efficient genetic problem.
First of all, once positioned the sensors on the plant, respecting all the safety/security goals, it is necessary to position the hubs and to decide at which hub must be connected each sensor. The number of hubs that must be used depends on the number of inputs of the hub them- selves. A good choice consist in choosing a number of hubs so that the total of available inputs is almost 200% greater than the number of sensors, to allow the genetic algorithm to operate a better optimisation of the connec- tions.
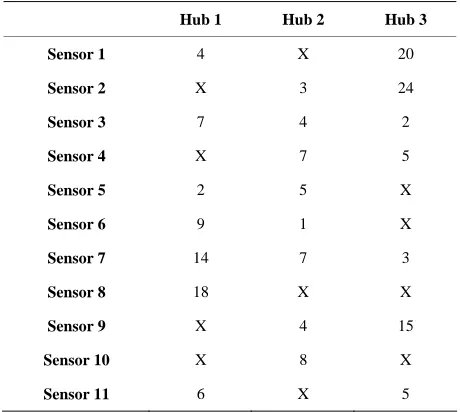
Once individuated the positions where it is possible to install the hub (this does not means that it is necessary to install an hub in that position, since it’s installation need depends on the optimisation process), it is necessary to calculate the distance between each sensors and each hub and generate the so called design connection table where all the sensor-hub distances are properly reported. Since some connections are not possible, due to architectural restrictions that are particularly felt in historical buildings, the related situation is indicated with a X in the related position of the table. In Table 1 an example of a 11 sen- sors-3 hubs design table is shown (a 6 inputs hub is sup- posed to be used so that the availability of 18 inputs is guaranteed).
Once derived the design connection table it is neces- sary to proceed with the codification of the design prob- lem in a simple and efficient genetic problem.
[image:6.595.57.287.528.734.2]The easier way to do this is to use a chromosome composed by a number of genes that is equal to the number of sensors: this means that the chromosome is
Table 1. Example of a design connection table. A X means a not allowed connection between the sensor and the hub, while a number indicates the distance between the sensor and the hub expressed in meters.
Hub 1 Hub 2 Hub 3
Sensor 1 4 X 20
Sensor 2 X 3 24
Sensor 3 7 4 2
Sensor 4 X 7 5
Sensor 5 2 5 X
Sensor 6 9 1 X
Sensor 7 14 7 3
Sensor 8 18 X X
Sensor 9 X 4 15
Sensor 10 X 8 X
Sensor 11 6 X 5
composed by homogeneous genes. Each gene, related to a specific sensor, codifies the number of the hub where the sensor is connected: for this reason the value of this gene varies between 1 and the maximum number of hubs
H . The number of the effective used hubs can ob-
viously be lesser than the maximum number of hubs since it depends on the found optimisation solution. The number of hubs depends on the number NI of their inputs and the number NS of sensor to be connected. The mini- mum number of hubs necessary is equal to:
MAX
N
MIN
H
N
S I
1
Int N N
MAX N MIN H N MAX N MAX H N (1)
where Int() is the integer operator, that is an operator which rounds the argument () to the nearest integer to- wards infinity.
Due to the design vincula, it is not possible to reach this number and it is necessary to consider a proper multiplicative coefficient c so that the maximum H
of hubs is equal to c . Good results are obtained if c is equal to 2.
To allow the maximum efficiency of the genetic proc- ess, the sensor/hub connections, represented as a number into the genes, are coded with a binary alphabet so that in the presence of the crossing and the mutation operation, the data can be exchanged at the inter-gene level more that at the intra-gene level. If H is the number of
hubs that ought to be used (according to the criteria ex- pressed above) the minimum number of bits necessary to codify can be demonstrated to be:
MAX
2
In log NH 1 (2)
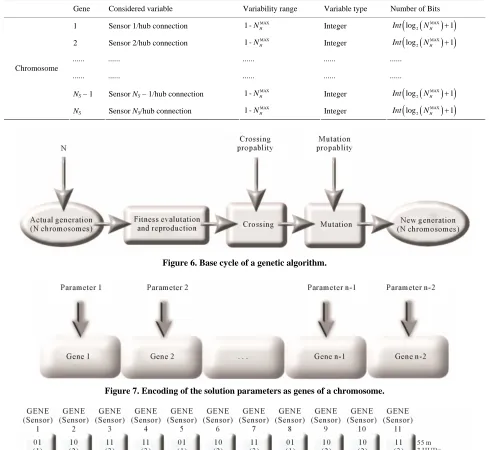
In Table 2 the codification of the gene is shown. The fitness function F(C) (where C is the generic chromosome) represents the cost of the installation and it is composed by the cost of wire installation and by the cost of hubs:
cosm C cosH HCF C t L t N (3) being costm the cost per meter of installation, LC the total length of the installation of the solution represented by the chromosome C, costH the cost of each hub, NHC the number of hubs of the solution represented by the chro- mosome C. Therefore the system evolves to reduce, as more as possibile, the fitness function, or cost function, represented by Equation (3).
Once defined the chromosome as shown in Table 2, an initial population of 80 - 100 chromosomes is ran-domly generated and let evolve according to the genetic scheme shown in Figure 6.
In Figure 7 the general scheme of encoding of the so-lution parameters as genes of a chromosome is shown.
In Figure 8 three significant examples of chromo- somes obtained during the evolution process are shown.
Table 2. Details of the scheme of codification of the gene.
Gene Considered variable Variability range Variable type Number of Bits
1 Sensor 1/hub connection MAX
1 - NH
MAX 2
log NH 1
Integer Int
2 Sensor 2/hub connection MAX
1 - NH
MAX 2
log NH 1
Integer Int
NS – 1 Sensor NS – 1/hub connection
MAX
1 - NH
MAX 2
log NH 1
Integer Int
Chromosome
NS Sensor NS/hub connection
MAX
1 - NH
MAX 2
log NH 1
Integer Int
[image:7.595.53.542.103.553.2]Figure 6. Base cycle of a genetic algorithm.
[image:7.595.75.525.507.686.2]Figure 7. Encoding of the solution parameters as genes of a chromosome.
Figure 8. Three significant examples of chromosomes obtained during the genetic evolution process.
The second chromosome represents the most efficient solution in term of both number of hubs (2) and shorter sensors and hubs (55 meters), as it is possible to verify
sum of connections between sensors and hubs (67 me- ters): if the cost of the hub is higher than the cost of the difference of length of the connections (67 - 55 = 12 me- ters), this chromosome tends to extinct during the evolu- tion while the first chromosome tends to dominate and to become the most numerous of the final population. If the mentioned cost is lower an opposite situation takes place.
The third chromosome represents a good solution in term of reduction of the sum of the length of connections with the only exception of genes 4 and 8 where the con- nections sensor 4—hub 1 and sensor 8—hub 2 are re- spectively attempted. Since these connections are not allowed, as it is possible to deduce from Table 1, this chromosome immediately extinct at the first fitness evaluation process, because of its inadequacy to repre- sent a valid solution for our problem.
The used GA ensures to obtain the most optimised so- lution as a function of the input parameters. The opti- mised solution is generally found after a certain number of cycles, called generations: this number has demon- strated to vary with the number of sensors, as shown in
Figure9.
The important result of this genetic design method is represented by the cost reduction. Different simulations related to different cost of wire installation and hub and to different real situations were made. In Figure 10, the cost reduction of the installation (in percentage) as a function of the number of sensors is shown. The cost used as a base to calculate the cost reduction is repre- sented by the more expensive solution, that is an initial number of hubs that is double with respect to the value expressed by Equation (1) and a connection scheme that is optimized, by means of another GA, to reach the maximum cost.
[image:8.595.309.536.86.267.2]It is interesting to note that the cost reduces with the number of sensors, that is the more complex is the in-
Figure 9. Number of generations necessary to obtain the optimised solution as a function of the input sensors.
Figure 10. Cost reduction of the installation (in percentage) as a function of the number of sensors.
stallation and the greater is the cost reduction, since the GA optimisation is capable of showing all its efficiency on large scale.
The full cost solution is represented by the initial use of a number of hubs that is the double of the minimal number, as explained before.
5. Conclusions
The realization of security fixed network is very critical when it must be installed in an environment full of re- strictions such as historical palaces, characterized by unique architectural features.
In this paper it has been shown a system which was designed using a very advanced technique based on ge- netic algorithm optimisation.
The proposed system has demonstrated to be able of ensuring high performances in term of high reduction of the installation cost, in particular way when the number of sensors is greater than 100, that is a normal condition in historical buildings.
The same algorithm can be used in other kind of building where connection restrictions are present.
REFERENCES
[1] F. Garzia and R. Cusani, “The Integrated Safety/Security/ Communication System of the Gran Sasso Mountain in Italy,” International Journal of Safety & Security Engi-neering, WIT Press, Southampton and Boston.
[2] F. Garzia, E. Sammarco and R. Cusani, “The Integrated Security System of the Vatican City State,” International Journal of Safety & Security Engineering, Vol. 1, No. 1, 2011, pp. 1-17. doi:10.2495/SAFE-V1-N1-1-17
[3] G. Contardi, F. Garzia and R. Cusani, “The Integrated Security System of the Senate of the Italian Republic,”
[image:8.595.58.283.529.708.2]Vol. 1, No. 3, 2011, pp. 219-246.
[4] L. Davis, “Genetic Algorithms and Simulated Anneal- ing,” Morgan Kaufmann Publishers, Inc., Los Altos, 1987.
[5] L. Davis, “Handbook of Genetic Algorithm,” Van Nos- trand Reinhold, New York, 1991.
[6] A. H. F. Dias and J. A. de Vasconcelos, “Multiobjective Genetic Algorithms Applied to Solve Optimization Prob-lems,” IEEE Transactions on Magnetics, Vol. 38, No. 2, 2002, pp. 1133-1136. doi:10.1109/20.996290
[7] D. E. Goldberg, “Genetic Algorithms in Search, Opti- misation and Machine Learning,” Addison-Wesley, New York, 1989.
[8] D. E. Goldberg and K. Deb, “Foundations of Genetic Algorithms,” Morgan Kaufmann, New York, 1991.
[9] J. H. Holland, “Genetic algorithms,” Scientific American, Vol. 267, 1992, pp. 66-72.
doi:10.1038/scientificamerican0792-66
[10] M. Crosbie and G. Spafford, “Applying Genetic Pro-gramming to Intrusion Detection,” Proceedings of AAAI Fall Symposium on Genetic Programming, Cambridge, 1995, pp. 1-8.
[11] A. Munoz, S. Martorell and V. Serradell, “Genetic Algo-rithms in Optimizing Surveillance and Maintenance of Components,” Reliability Engineering and Systems Safety, Vol. 57, No. 2, 1997, pp. 107-120.
doi:10.1016/S0951-8320(97)00031-8
[12] S. M. Bridges and R. B. Vaughn, “Fuzzy Data Mining and Genetic Algorithms Applied to Intrusion Detection,”
Proceedings of NISSC—National Information Systems
Security Conference, Baltimore, 2000, pp. 230-244. [13] S. M. Bridges and R. B. Vaughn, “Intrusion Detection via
Fuzzy Data Mining,” Proceedings of Canadian Infor- mation Technology Security Symposium, Ottawa, 2000, pp. 347-358.
[14] J. Luo and S. Bridges, “Mining Fuzzy Association Rules and Fuzzy Frequency Episodes,” International Journal of Intelligent Systems, Vol. 15, No. 1, 2000, pp. 156-161. [15] A. Siraj, R. B. Vaughn and S. M. Bridges, “Decision
Making for Network Health Assessment in an Intelligent Intrusion Detection System Architecture,” Journal of In-formation and Decision Making, Vol. 3, 2004, pp. 458- 463.
[16] N. Basha, I. Bharanindharan and A. M. Ahmed, “Hybrid Intelligent Intrusion Detection System,” Proceedings of World Academy of Science, Engineering and Technology, Vol. 6, 2005, pp. 291-294.
[17] C. M. Lin and M. Gen, “An Effective Decision-Based Genetic Algorithm Approach to Multiobjective Portfo- lio,” Applied Mathematical Sciences, Vol. 1, 2007, pp. 201-210.
[18] H. Huang, R. Ooka, H. Chen and S. Kato, “Optimum Design for Smoke-Control System in Buildings Consid-ering Robustness Using CFD and Genetic Algorithms,”
Building and Environment, Vol. 44, 2009, pp. 2218-2227. doi:10.1016/j.buildenv.2009.02.002
[19] M. Saniee, J. Habibi and C. Lucas, “Intrusion Detection Using a Fuzzy Genetics-Based Learning Algorithm,”