Maximum Entropy Models for FrameNet Classification
Michael Fleischman, Namhee Kwon and Eduard Hovy
USC Information Sciences Institute
4676 Admiralty Way
Marina del Rey, CA 90292-6695
{fleisch, nkwon, hovy }@ISI.edu
Abstract
The development of FrameNet, a large database of semantically annotated sen-tences, has primed research into statistical methods for semantic tagging. We ad-vance previous work by adopting a Maximum Entropy approach and by using previous tag information to find the high-est probability tag sequence for a given sentence. Further we examine the use of sentence level syntactic pattern features to increase performance. We analyze our strategy on both human annotated and automatically identified frame elements, and compare performance to previous work on identical test data. Experiments indicate a statistically significant im-provement (p<0.01) of over 6%.
1
Introduction
Recent work in the development of FrameNet, a large database of semantically annotated sentences, has laid the foundation for statistical approaches to the task of automatic semantic classification.
The FrameNet project seeks to annotate a large subset of the British National Corpus with seman-tic information. Annotations are based on Frame Semantics (Fillmore, 1976), in which frames are defined as schematic representations of situations involving various frame elements such as partici-pants, props, and other conceptual roles.
In each FrameNet sentence, a single target predicate is identified and all of its relevant frame elements are tagged with their semantic role (e.g., Agent, Judge), their syntactic phrase type (e.g.,
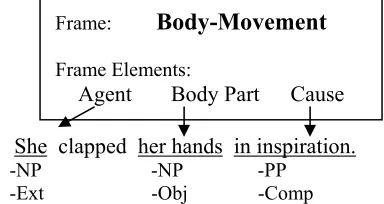
NP, PP), and their grammatical function (e.g., ex-ternal argument, object argument). Figure 1 shows an example of an annotated sentence and its appro-priate semantic frame.
She clapped her hands in inspiration.
Frame:
Body-Movement
Frame Elements:
Agent Body Part Cause
[image:1.612.326.518.277.379.2]-NP -NP -PP -Ext -Obj -Comp
Figure 1. Frame for lemma “clap” shown with three core frame elements and a sentence annotated with ele-ment type, phrase type, and grammatical function.
As of its first release in June 2002, FrameNet has made available 49,000 annotated sentences. The release contains 99,000 annotated frame ele-ments for 1462 distinct lexical predicates (927 verbs, 339 nouns, and 175 adjectives).
While considerable in scale, the FrameNet da-tabase does not yet approach the magnitude of re-sources available for other NLP tasks. Each target predicate, for example, has on average only 30 sen-tences tagged. This data sparsity makes the task of learning a semantic classifier formidable, and in-creases the importance of the modeling framework that is employed.
2
Related Work
of the frame elements in a sentence. In the classi-fication phase, similar syntactic information is used to classify those elements into their semantic roles.
In both phases Gildea and Jurafsky (2002) build a model of the conditional probabilities of the classification given a vector of syntactic features. The full conditional probability is decomposed into simpler conditional probabilities that are then in-terpolated to make the classification. Their best performance on held out test data is achieved using a linear interpolation model:
where r is the class to be predicted, x is the vector of syntactic features, xi is a subset of those fea-tures, αi is the weight given to that subset
condi-tional probability (as determined using the EM algorithm), and m is the total number of subsets used. Using this method, they report a test set ac-curacy of 78.5% on classifying semantic roles and precision/recall scores of .726/.631 on frame ele-ment identification.
We extend Gildea and Jurafsky (2002)’s initial effort in three ways. First, we adopt a maximum entropy (ME) framework in order to learn a more accurate classification model. Second, we include features that look at previous tags and use previous tag information to find the highest probability se-mantic role sequence for a given sentence. Finally, we examine sentence-level patterns that exploit more global information in order to classify frame elements. We compare the results of our classifier to that of Gildea and Jurafsky (2002) on matched test sets of both human annotated and automati-cally identified frame elements.
3
Semantic Role Classification
Training (36,993 sentences / 75,548 frame ele-ments), development (4,000 sentences / 8,167 frame elements), and held out test sets (3,865 sen-tences / 7,899 frame elements) were obtained in order to exactly match those used in Gildea and Jurafsky (2002)1. In the experiments presented below, features are extracted for each frame ment in a sentence and used to classify that
ele-ment into one of 120 semantic role categories. The boundaries of each frame element are given based on the human annotations in FrameNet. In Section 4, experiments are performed using automatically identified frame elements.
3.1
1 Data sets (including parse trees) were obtained from Dan
Gildea via personal communication.
Features
For each frame element, features are extracted from the surface text of the sentence and from an automatically generated syntactic parse tree (Collins, 1997). The features used are described below:
) | ( )
| (
0
i m
i
ip r x
x r
p
∑
=
= α • Target predicate (tar): Although there may
be many predicates in a sentence with associ-ated frame elements, classification operates on only one target predicate at a time. The target predicate is the only feature that is not ex-tracted from the sentence itself and must be given by the user. Note that the frame which the target predicate instantiates is not given, leaving any word sense ambiguities to be han-dled implicitly by the classifier.2
• Phrase type (pt): The syntactic phrase type of
the frame element (e.g. NP, PP) is extracted from the parse tree of the sentence by finding the constituent in the tree whose boundaries match the human annotated boundaries of the element. In cases where there exists no con-stituent that perfectly matches the element, the constituent is chosen which matches the largest text span of the element and has the same left-most boundary.
• Syntactic head (head): The syntactic heads of
the frame elements are extracted from the frame element’s matching constituent (as scribed above) using a heuristic method de-scribed by Michael Collins.3 This method extracts the syntactic heads of constituents; thus, for example, the second frame element in Figure 1 has head “hands,” while the third frame element has head “in.”
• Logical Function (lf): A simplification of the
grammatical function annotation (see section 1) is extracted from the parse tree. Unlike the
2 Because of the interaction of head word features with the
target predicate, we suspect that ambiguous lexical items do not account for much error. This question, however, will be addressed explicitly in future work.
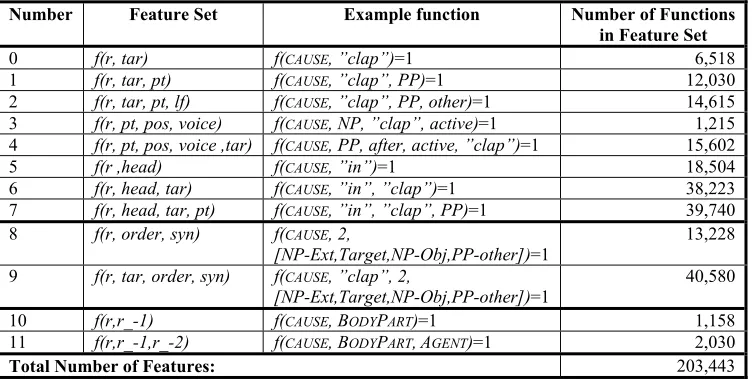
Table 1. Feature sets used in ME frame element classifier. Shows individual feature sets, example feature function from that set, and total number of feature functions in the set. Examples taken from frame element “in inspiration,” shown in Figure 1.
Number Feature Set Example function Number of Functions in Feature Set
0 f(r, tar) f(CAUSE, ”clap”)=1 6,518
1 f(r, tar, pt) f(CAUSE, ”clap”, PP)=1 12,030
2 f(r, tar, pt, lf) f(CAUSE, ”clap”, PP, other)=1 14,615
3 f(r, pt, pos, voice) f(CAUSE, NP, ”clap”, active)=1 1,215
4 f(r, pt, pos, voice ,tar) f(CAUSE, PP, after, active, ”clap”)=1 15,602
5 f(r ,head) f(CAUSE, ”in”)=1 18,504
6 f(r, head, tar) f(CAUSE, ”in”, ”clap”)=1 38,223
7 f(r, head, tar, pt) f(CAUSE, ”in”, ”clap”, PP)=1 39,740
8 f(r, order, syn) f(CAUSE, 2,
[NP-Ext,Target,NP-Obj,PP-other])=1 13,228
9 f(r, tar, order, syn) f(CAUSE, ”clap”, 2,
[NP-Ext,Target,NP-Obj,PP-other])=1
40,580
10 f(r,r_-1) f(CAUSE, BODYPART)=1 1,158
11 f(r,r_-1,r_-2) f(CAUSE, BODYPART,AGENT)=1 2,030
Total Number of Features: 203,443
full grammatical function, the lf can have only one of three values: external argument, object argument, other. A node is considered an e x-ternal argument if it is an ancestor of an S node, an object argument if it is an ancestor of a VP node, and other for all other cases. This feature is only applied to frame elements whose phrase type is NP.
• Position (pos): The position of the frame
ele-ment relative to the target (before, after) is ex-tracted based on the surface text of the sentence.
• Voice (voice): The voice of the sentence (
ac-tive, passive) is determined using a simple regular expression passed over the surface text of the sentence.
• Order (order): The position of the frame
ele-ment relative to the other frame eleele-ments in the sentence. For example, in the sentence from Figure 1, the element “She” has order=0, while “in inspiration” has order=2.
• Syntactic pattern (pat): The sentence level
syntactic pattern of the sentence is generated by looking at the phrase types and logical functions of each frame element in the sen-tence. For example, in the sentence: “Alexan-dra bent her head;” “Alexan“Alexan-dra” is an external argument Noun Phrase, “bent” is a target predicate, and “her head” is an object argu-ment Noun Phrase. Thus, the syntactic pattern associated with the sentence is [NP-ext, target, NP-obj].
These syntactic patterns can be highly in-formative for classification. For example, in the training data, a syntactic pattern of [NP-ext, target, NP-obj] given the predicate bend
was associated 100% of the time with the Frame Element pattern: “AGENT TARGET
BODYPART.“
• Previous role (r_n): Frame elements do not
occur in isolation, but rather, depend very much on the other elements in a sentence. This dependency can be exploited in classifica-tion by using the semantic roles of previously classified frame elements as features in the classification of a current element. This strat-egy takes advantage of the fact that, for exam-ple, if a frame element is tagged as an AGENT
it is highly unlikely that the next element will also be an AGENT.
The previous role feature indicates the classification that the n-previous frame ele-ment received. During training, this informa-tion is provided by simply looking at the true classes of the frame element occurring n posi-tions before the target element. During testing, hypothesized classes of the n elements are used and Viterbi search is performed to find the most probable tag sequence for a sentence.
3.2
Maximum Entropyother-wise is as uniform as possible (Berger et al., 1996).
We model the probability of a semantic role r
given a vector of features x according to the ME formulation below:
3.3
3.4
Experiments
We present three experiments in which different feature sets are used to train the ME classifier. The first experiment uses only those feature combina-tions described in Gildea and Jurafsky (2002) (fea-ture sets 0-7 from Table 1). The second experiment uses a super set of the first and incor-porates the syntactic pattern features described above (feature sets 0-9). The final experiment uses the previous tags and implements Viterbi search to find the best tag sequence (feature sets 0-11).
∑
==
ni i
x
f
r
x
Z
x
r
p
0
i
(
,
)]
exp[
1
)
|
(
λ
Here Zx is a normalization constant, fi(r,x) is a
fea-ture function which maps each role and vector element (or combination of elements) to a binary value, n is the total number of feature functions, and λi is the weight for a given feature function.
The final classification is just the role with highest probability given its feature vector and the model.
We further investigate the effect of varying two aspects of classifier training: the standard deviation of the Gaussian priors used for smoothing, and the number of sentences used for training. To examine the effect of optimizing the standard deviation, a range of values was chosen and a classifier was trained using each value until performance on a development set ceased to improve.
The feature functions that we employ can be divided into feature sets based upon the types and combinations of features on which they operate. Table 1 lists the feature sets that we use, as well as the number of individual feature functions they contain. The feature combinations were chosen based both on previous work and trial and error. In future work we will examine more principled fea-ture selection techniques.
To examine the effect of training set size on performance, five data sets were generated from the original set with 36, 367, 3674, 7349, and 24496 sentences, respectively. These data sets were created by going through the original set and selecting every thousandth, hundredth, tenth, fifth, and every second and third sentence, respectively. It is important to note that the feature functions
described here are not equivalent to the subset conditional distributions that are used in the Gildea and Jurafsky model. ME models are log-linear models in which feature functions map specific instances of syntactic features and classes to binary values (e.g., if a training element has head=”in” and role=CAUSE,then, for that element, the feature function f(CAUSE, ”in”) will equal 1). Thus, ME is not here being used as another way to find weights for an interpolated model. Rather, the ME ap-proach provides an overarching framework in which the full distribution of semantic roles given syntactic features can be modeled.
We train the ME models using the GIS algo-rithm (Darroch and Ratcliff, 1972) as implemented in the YASMET ME package (Och, 2002). We use the YASMET MEtagger (Bender et al., 2003) to perform the Viterbi search. The classifier was trained until performance on the development set ceased to improve. Feature weights were smoothed using Gaussian priors with mean 0 (Chen and Rosenfeld, 1999). The standard devia-tion of this distribudevia-tion was optimized on the de-velopment set for each experiment.
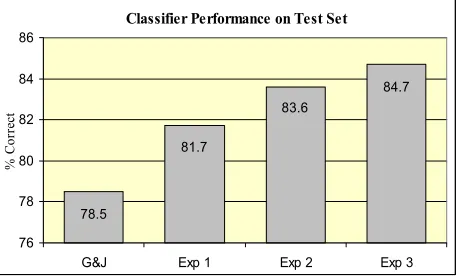
Classifier Performance on Test Set
81.7
83.6
84.7
78.5
76 78 80 82 84 86
G&J Exp 1 Exp 2 Exp 3
%
C
orre
[image:4.612.313.541.417.555.2]ct
Figure 2. Performance of models on test data using hand annotated frame element boundaries. G&J refers to the results of Gildea and Jurafsky (2002). Exp 1 in-corporates feature sets 0-7 from Table 1; Exp 2 feature sets 0-9; Exp 3 features 0-11.
Results
exception of Exp 2 and Exp 3, whose difference is statistically significant at (p<0.05).
Table 2. Effect of different smoothing parameter (std. dev.) values on classification performance.
Std. Dev. % Correct
1 79.9 2 82.1 4 81.9
Table 2 shows the effect of varying the stan-dard deviation of the Gaussian priors used for smoothing in Experiment 1. The difference in per-formance between the classifiers trained using standard deviation 1 and 2 is statistically signifi-cant at (p<0.01).
10% 20% 30% 40% 50% 60% 70% 80% 90%
10 100 1000 10000 100000
# Sentences in Training
% Co
rr
ec
[image:5.612.311.536.267.382.2]t
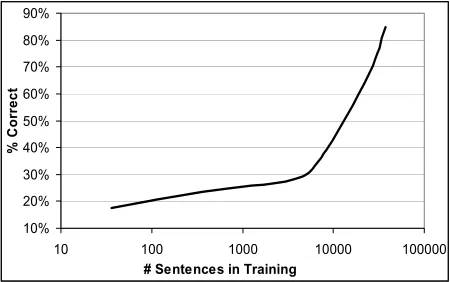
Figure 3. Effect of training set size on semantic role classification.
Figure 3 shows the change in performance as a function of training set size. Classifiers were trained using the full set of features described for Experiment 3.
Table 3 shows the confusion matrix for a subset of semantic roles. Five roles were chosen for pres-entation based upon their high contribution to clas-sifier error. Confusion between these five account for 27% of all errors made amongst the 120 possi-ble roles. The tenth role, other, represents the sum of the remaining 115 roles. Table 4 presents ex-ample errors for five of the most confused roles.
3.5
DiscussionIt is clear that the ME models improve perform-ance on frame element classification. There are a number of reasons for this improvement.
First, for this task the log-linear model employed in the ME framework is better than the linear interpolation model used by Gildea and Jurafsky. One possible reason for this is that semantic role
classification benefits from the ME model’s bias for more uniform probability distributions that sat-isfy the constraints placed on the model by the training data.
[image:5.612.74.299.274.415.2]Another reason for improved performance comes from ME’s simpler design. Instead of having to worry about finding proper backoff strategies amongst distributions of features subsets, ME al-lows one to include many features in a single model and automatically adjusts the weights of these features appropriately.
Table 3. Confusion matrix for five roles which contrib-ute most to overall system error. Columns refer to ac-tual role. Rows refer to the model’s hypothesis. Other
refers to combination of all other roles.
Area Spkr Goal Msg Path Other Prec.
Area 98 6 18 16 0.710
Spkr 373 23 41 0.853
Goal 11 431 28 50 0.828
Msg 18 1 315 33 0.858
Path 32 36 415 41 0.791
Other 15 21 26 24 33 5784 0.979
Recall 0.628 0.905 0.862 0.87 0.84 0.969
Also, because the ME models find weights for many thousands of features, they have many more degrees of freedom than the linear interpolated models of Gildea and Jurafsky. Although many degrees of freedom can lead to overfitting of the training data, the smoothing procedure employed in our experiments helps to counteract this prob-lem. As evidenced in Table 2, by optimizing the standard deviation used in smoothing the ME models are able to show significant increases in performance on held out test data.
Finally, by including in our model sentence-level pattern features and information about previ-ous classes, global information can be exploited for improved classification. The accuracy gained by including such global information confirms the intuition that the semantic role of an element is much related to the entire sentence of which it is a part.
roles.4 Table 4 offers some insight into why these errors occur. For example, the confusions exem-plified in 1 and 2 are both due to the fact that the particular phrases employed can be used in multi-ple roles (including the roles hypothesized by the system). Thus, while “across the counter” may be considered a goal when one is talking about a per-son and their head, the same phrase would be con-sidered a path if one were talking about a mouse who is running.
Table 4. Example errors for five of the most often con-fused semantic roles
Actual Proposed Example Sentence
1 Goal Path The barman craned his head
across the counter.
2 Area Path Mr. Glass began hallucinating,
throwing books around the classroom.
3 Message Speaker Debate lasted until 20 Septem-ber, opposition being voiced
by a number of Italian and Spanish prelates.
4 Addressee Speaker Furious staff claim they were even called in from holiday to be grilled by a specialist secu-rity firm
5 Reason Evaluee We cannot but admire the efficiency with which she took control of her own life.
Examples 3 and 4, while showing phrases with similar confusions, stand out as being errors caused by an inability to deal with passive sentences. Such errors are not unexpected; for, even though the voice of the sentence is an explicit feature, the system suffers from the paucity of passive sen-tences in the data (approximately 5%).
Finally, example 5 shows an error that is based on the difficult nature of the decision itself (i.e., it is unclear whether “the efficiency” is the reason for admiration, or what is being admired). Often times, phrases are assigned semantic roles that are not obvious even to human evaluators. In such cases it is difficult to determine what information might be useful for the system.
Having looked at the types of errors that are common for the system, it becomes interesting to examine what strategy may be best to overcome such errors. Aside from new features, one solution is obvious: more data. The curve in Figure 2 shows that there is still a great deal of performance to be gained by training the current ME models on
more data. The slope of the curve indicates that we are far from a plateau, and that even constant increases in the amount of available training data may push classifier performance above 90% accu-racy.
Having demonstrated the effectiveness of the ME approach on frame element classification given hand annotated frame element boundaries, we next examine the value of the approach given automatically identified boundaries.
4
4.1
Frame Element Identification
Gildea and Jurafsky equate the task of locating frame element boundaries to one of identifying frame elements amongst the parse tree constituents of a given sentence. Because not all frame element boundaries exactly match constituent boundaries, this approach can perform no better than 86.9% (i.e. the number of elements that match constitu-ents (6864) divided by the total number of ele-ments (7899)) on the test set.
Features
Frame element identification is a binary classifica-tion problem in which each constituent in a parse tree is described by a feature vector and, based on that vector, tagged as either a frame element or not. In generating feature vectors we use a subset of the features described for role tagging as well as an additional path feature.
Figure 4. Generation of path features used in frame element tagging. The path from the constituent “in in-spiration” to the target predicate “clapped” is repre-sented as the string PP↑VP↓VBD.
[image:6.612.320.546.472.622.2]Table 5. Results of frame element identification. G&J represents results reported in (Gildea and Jurafsky, 2002), ME results for the experiments reported here. The second column shows precision, recall, and F-scores for the task of frame element identification, the third column for the combined task of identification and classification.
FE ID only FE ID + FE Classification Method
Precision Recall F-Score Precision Recall F-Score
G&J Boundary id + baseline role labeler .726 .631 .675 .67 .468 .551 ME Boundary id + ME role labeler .736 .679 .706 .6 .554 .576
path of a constituent is represented by the nodes through which one passes while traveling up the tree from the constituent and then down through the governing category to the target. Figure 4 shows an example of this feature for a frame ele-ment from the sentence presented in Figure 1.
4.2
4.3
Experiments
We use the ME formulation described in Section 3.2 to build a binary classifier. The classifier fea-tures follow closely those used in Gildea and Juraf-sky. We model the data using the feature sets: f(fe, path), f(fe, path, tar), and f(fe, head, tar), where fe
represents the binary classification of the constitu-ent. While this experiment only uses three feature sets, the heterogeneity of the path feature is so great that the classifier itself uses 1,119,331 unique binary features.
With the constituents having been labeled, we apply the ME frame element classifier described above. Results are presented using the classifier of Experiment 1, described in section 3.3. We then investigate the effect of varying the number of constituents used for training on identification per-formance. Five data sets of approximately 100,000 10,000, 1,000, and 100 constituents were generated from the original set by random selection and used to train ME models as described above.
Results
Table 5 compares the results of Gildea and Juraf-sky (2002) and the ME frame element identifier on both the task of frame element identification alone, and the combined task of frame element identifica-tion and classificaidentifica-tion. In order to be counted cor-rect on the combined task, the constituent must have been correctly identified as a frame element, and then must have been correctly classified into one of the 120 semantic categories.
Recall is calculated based on the total number of frame elements in the test set, not on the total number of elements that have matching parse con-stituents. Thus, the upper limit is 86.9%, not
100%. Precision is calculated as the number of correct positive classifications divided by the num-ber of total positive classifications.
The difference in the F-scores on the identifica-tion task alone and on the combined task are statis-tically significant at the (p<0.01) level5. The accuracy of the ME semantic classifier on the automatically identified frame elements is 81.5%, not a statistically significant difference from its performance on hand labeled elements, but a statis-tically significant difference from the classifier of Gildea and Jurafsky (2002) (p<0.01).
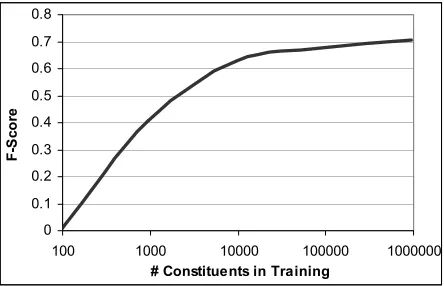
0 0.1 0.2 0.3 0.4 0.5 0.6 0.7 0.8
100 1000 10000 100000 1000000
# Constituents in Training
F-S
cor
[image:7.612.317.539.331.474.2]e
Figure 5. Effect of training set size on frame element boundary identification.
Figure 5 shows the results of varying the train-ing set size on identification performance. For each data set, thresholds were chosen to maximize F-Score.
4.4
Discussion
It is clear from the results above that the perform-ance of the ME model for frame element classifica-tion is robust to the use of automatically identified frame element boundaries. Further, the ME
5 G&J’s results for the combined task were generated with a
framework yields better results on the frame ele-ment identification task than the simple linear in-terpolation model of Gildea and Jurafsky. This result is not surprising given the discussion in Sec-tion 3.
What is striking, however, is the drastic overall reduction in performance on the combined identification and classification task. The bottleneck here is the identification of frame element boundaries. Unlike with classification though, Figure 5 indicates that a plateau in the learning curve has been reached, and thus, more data will not yield as dramatic an improvement for the given feature set and model.
5
Conclusion
The results reported here show that ME models provide higher performance on frame element clas-sification tasks, given both human and automati-cally identified frame element boundaries, than the linear interpolation models examined in previous work. We attribute this increase to the benefits of the ME framework itself, the incorporation of sen-tence-level syntactic patterns into our feature set, and the use of previous tag information to find the most probable sequence of roles for a sentence.
But perhaps most striking in our results are the effects of varying training set size on the perform-ance of the classification and identification models. While for classification, the learning curve appears to be still increasing with training set size, the learning curve for identification appears to have already begun to plateau. This suggests that while classification will continue to improve as the Fra-meNet database gets larger, increased performance on identification will rely on the development of more sophisticated models.
In future work, we intend to apply the lessons learned here to the problem of frame element iden-tification. Gildea and Jurafsky have shown that improvements in identification can be had by more closely integrating the task with classification (they report an F-Score of .719 using an integrated model). We are currently exploring a ME ap-proach which integrates these two tasks under a tagging framework. Initial results show that sig-nificant improvements can be had using techniques similar to those described above.
Acknowledgments
The authors would like to thank Dan Gildea who generously allowed us access to his data files and Oliver Bender for making the MEtagger software available. Finally, we thank Franz Och whose help and expertise was invaluable.
References
O. Bender, K. Macherey, F. J. Och, and H. Ney. 2003. Comparison of Alignment Templates and Maximum Entropy Models for Natural Lan-guage Processing. Proc. of EACL-2003. Buda-pest, Hungary.
A. Berger, S. Della Pietra and V. Della Pietra, 1996. A Maximum Entropy Approach to Natu-ral Language Processing. Computational Lin-guistics, vol. 22, no. 1.
S. F. Chen and R. Rosenfeld. 1999. A Gaussian prior for smoothing maximum entropy models.
Technical Report CMUCS -99-108, Carnegie Mellon University
M. Collins. 1997. Three generative, lexicalized models for statistical parsing. Proc. of the 35th Annual Meeting of the ACL. pages 16-23, Ma-drid, Spain.
J. N. Darroch and D. Ratcliff. 1972. Generalized iterative scaling for log-linear models. Annals of Mathematical Statistics, 43:1470-1480. C. Fillmore 1976. Frame semantics and the nature
of language. Annals of the New York Academy of Sciences: Conference on the Origin and De-velopment of Language and Speech, Volume 280 (pp. 20-32).
D. Gildea and D. Jurafsky. 2002. Automatic La-beling of Semantic Roles, Computational Lin-guistics, 28(3) 245-288 14.
T. Mitchell. 1997. Machine Learning. McGraw-Hill International Editions, New York, NY. Pages 143-145.