Abstract—The active particulate processes in the precipitation of nickel powder by hydrogen reduction were investigated on an industrial scale by analyzing the evolution of the particle size distribution (PSD) and its derived moments. Based on this information, an appropriate model based on the moment form of the population balance equation (PBE) was tested. Nickel powder samples were collected from the industrial autoclave after each successive batch reduction (densification) and the PSD analysed using an image analysis technique. The PSD data was then transformed into moments and the experimental values were compared with those simulated using a model based on the moment form of the PBE. The process was characterized by significant aggregation in the first ten densifications followed by a dominance of either aggregation and/or breakage in the later stages of the cycle.
Index Terms— nickel powder, particulate processes, population balance, precipitation
I. INTRODUCTION
The precipitation of nickel powder by high-pressure hydrogen reduction has been practised on an industrial scale for the last five decades. Nickel powder is normally precipitated from ammoniacal leach solutions by hydrogen reduction in pressurised mechanically agitated autoclaves. The process is initiated by seeding or heterogeneous nucleation. Successive batch reductions, called densifications, are conducted by discharging the depleted nickel solution leaving behind the nickel powder to act as seed for the next batch reduction. With each batch reduction the nickel powder increases in size, apparent density and becomes more compact, hence the term densification. When the powder reaches a size which can not be adequately suspended by the agitators, the powder and the depleted solution is discharged and a new cycle is started. Each cycle is normally composed of 50-60 densifications. A comprehensive review of the technology and process chemistry has been done by Saarinen et al. and Agrawal et al.
[1], [2].
In order to effectively control the quality of the powder produced, one needs to understand the particulate processes responsible for powder formation. The major quality
Manuscript received July 7, 2009. This work was supported in part by the National Research Foundation (NRF) of South Africa and Impala Platinum Refineries.
F. Ntuli is with the Chemical Engineering Department, University of Johannesburg, P.O. Box 17011, Doornfontein 2028, Johannesburg, RSA (corresponding author phone: +27-11-559 6003; fax: +27-11-559 6430; e-mail: [email protected]).
A. E. Lewis is with the Chemical Engineering Department, University of Cape Town, P Bag Rondebosch 7701, Cape Town, RSA (e-mail: [email protected]).
specifications for nickel powders are powder purity, particle size distribution (PSD), shape and microstructure. All these specifications are dependent on the active particulate processes. Particulate processes active during precipitation involve the kinetic processes of nucleation, growth, aggregation and breakage. The dominant kinetic processes determines the final characteristics of the powder. In the precipitation of nickel powder on an industrial scale the dominant kinetic processes involved were studied by Lewis and Hounslow [3] using the discretised population balance as described by Hounslow et al. [4]. Their studies revealed that
the process is complex and different kinetic processes were active at different stages of each production cycle. However, they demonstrated that the process was largely dominated by aggregation and breakage. Studies done on a laboratory and pilot plant scale identified secondary aggregation as a dominant mechanism in the initial stages of a cycle followed by spherulitic growth and breakage when larger particles have been formed (i.e. ~100 μm) [5]. The objective of this paper is to identify the particulate processes by studying the evolution of the number density and volume distribution. The findings are then validated by means of a model based on the moment transformation of the PBE coupled with the kinetics of the particular particulate process.
Previous modelling studies using a similar approach has been done on data generated from the laboratory and pilot plant scale [5]. Results from this work showed that the process is best modelled by an aggregation, growth and breakage model.
II. EXPERIMENTAL
A. Apparatus and reagents
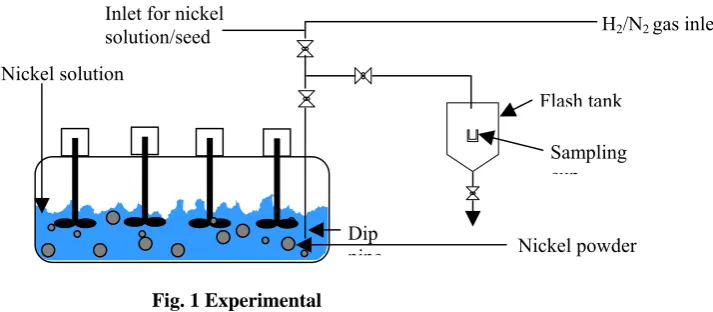
Experiments were conducted on a plant scale using a 13,000 L stainless steel autoclave fitted with four agitators. A schematic representation of the set-up is shown in Fig. 1. Feed solutions were obtained from the leach section of a base metal refinery and contained between 55-65 g/L of total metals and 350-400 g/L of (NH4)2SO4. Analytical grade
ammonia solution was used to adjust the free NH3: Ni2+ molar
ratio of the feed solution to 2.2. High purity hydrogen gas (minimum assay 98.8 % H2) was used for reduction and
nitrogen gas (minimum assay 99 %) was used for purging. Reduction was initiated by performing a nucleation step using a nucleation solution containing: an unbuffered feed solution (not containing (NH4)2SO4), aerosol C61, acrysol
A3 and aluminium sulphate. Modifier N9300 supplied by Chemserve Technical Products was used as an additive. An image analysis technique (Camsizer®) was used to measure
the PSD of the nickel powder. Electron micrographs of the
An Investigation into the Particulate Processes
Active during the Precipitation of Nickel Powder
powder were captured using a Leica electron optics (Leo) scanning electron microscope (Model SS 440).
[image:2.595.102.459.128.284.2]The nickel concentration in the reduction solution was measured by inductively coupled plasma optical emission spectroscopy (ICP-OES).
Fig. 1 Experimental set-up
B. Experimental Procedure
The autoclave containing the nucleation solution was first purged with nitrogen and hydrogen to expel oxygen. Reduction was then started when the temperature of the solution reached 180 oC by introducing hydrogen gas under
agitation until a pressure of 2800 kPa was obtained. Since reduction involves the consumption of hydrogen, the pressure was maintained at 2800 kPa by automatically introducing hydrogen. Reduction was deemed to be complete when the autoclave pressure remained constant at 2800 kPa for more than 30 s indicating that hydrogen consumption due to reduction had stopped.
Samples of the mixed depleted nucleation solution and nickel powder were then collected from the sampling flash tank by opening the sampling discharge outlet valve. The samples were collected with the agitators running in order to prevent powder settling during sampling so that a representative sample was obtained. The sample overflow was directed into the discharge flash tank where it was quantified by measuring the level of the powder in the tank. The samples were then decanted from the 220 ml steel sampling cup into 250 ml plastic bottles. In order to avoid melting the plastic container, 20 ml of water was added into the sampling container to cool the hot powder. The sample was then allowed to cool, before the liquor was decanted and the volume measured using a measuring cylinder, taking into account the volume of water added.
After sampling was complete the powder precipitated in the autoclave was allowed to settle for 30 min by switching off the agitators. Thereafter the depleted solution was discharged, leaving behind the seed particles to catalyse subsequent reductions. The autoclave was then charged with the feed solution from the leach section and a procedure similar to that conducted during nucleation was followed. Settling times were reduced to 10 min after the first five densifications.
The powder samples were dried on an aluminum pan using a magnetic hot plate set at 100°C. Drying was stopped when
the powder particles began to swirl under the influence of the magnetic field, indicating that the powder was dry. The powder was allowed to cool and weighed on an analytical balance after which the PSD and scanning electron
micrograph of the powder was analysed and captured respectively. The decanted liquor (depleted nickel solution) was then analysed for the residual nickel concentration.
III. RESULTS AND DISCUSSIONS
A. Evolution of the PSD with successive densifications
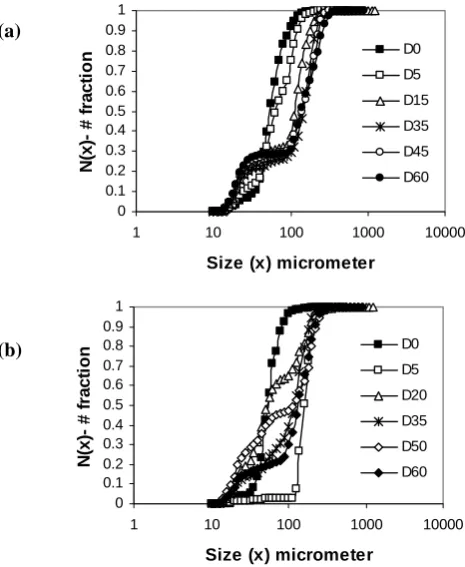
The normalized number and volume distribution for two representative plant cycles are shown in Fig. 2. The evolution of the number distribution shows that there is a larger fraction of smaller sized particles, which are smaller than the modal size of the initial seed particles (D0) towards the end of each cycle. This is evidence for either nucleation or breakage. The volume distribution shows a gradual decrease in the proportion of smaller sized particles and a shift to larger sizes as the cycle progresses. This is evidence of particle size enlargement which is a result of molecular growth and/or aggregation.
The cumulative undersize number and volume distribution for both cycles are shown in Fig. 3. For cycle A, there was a gradually shift to larger sizes both in the cumulative undersize number and volume distribution as the cycle progressed. This was evidence of size enlargement. For cycle B there was significant shift in the cumulative undesize number distribution at D5 followed by a backward shift to D20. Considering the mass deposition rates this significant shift could mainly be attributed to rapid aggregation in the early stages of the cycle. There was a slight change in the cumulative undersize volume distribution for the second cycle as from D5 until the end of the cycle.
H2/N2 gas inlet
Flash tank Sampling cup Dip
pipe Nickel solution
Nickel powder Inlet for nickel
(a)
(b)
Fig. 2 Evolution of the PSD of plant cycles (left) -number distribution and (right) -volume distribution for cycles A (a) and B (b)
(a)
[image:3.595.48.281.461.745.2](b)
Fig. 3 Evolution of the cumulative undersize number (-left) and volume (-right) distribution for cycles A (a) and B (b)
0 0.05 0.1 0.15 0.2 0.25 0.3
1 10 100 1000 10000
Size (x) in micrometer (log scale)
dV /d logx D0 D5 D15 D35 D45 D60 0 0.1 0.2 0.3 0.4 0.5 0.6 0.7
1 10 100 1000 10000
Size (x) in micrometer (log scale)
dN /d logx D0 D5 D15 D35 D45 D60 0 0.05 0.1 0.15 0.2 0.25 0.3
1 10 100 1000 10000
Size (x) micrometer (log scale)
d V /d lo g x D0 D5 D20 D35 D50 D60 0 0.1 0.2 0.3 0.4 0.5 0.6 0.7
1 10 100 1000 10000
Size (x) micrometer (log scale)
d N /d lo g x D0 D5 D20 D35 D50 D60 0 0.1 0.2 0.3 0.4 0.5 0.6 0.7 0.8 0.9 1
1 10 100 1000 10000
Size (x) micrometer
N
(x)
- # f
ract io n D0 D5 D15 D35 D45 D60 0 0.1 0.2 0.3 0.4 0.5 0.6 0.7 0.8 0.9 1
1 10 100 1000 10000
Size (x) micrometer
V
(x)- # fr
a c ti o n D0 D5 D15 D35 D45 D60 0 0.1 0.2 0.3 0.4 0.5 0.6 0.7 0.8 0.9 1
1 10 100 1000 10000
Size (x) micrometer
N
(x)
- # f
ract io n D0 D5 D20 D35 D50 D60 0 0.1 0.2 0.3 0.4 0.5 0.6 0.7 0.8 0.9 1
1 10 100 1000 10000
Size (x) micrometer
0 1 2 3 4 5 6 7 8 9
0 10 20 30 40 50 60
Densification
m
3
-(m
3 .m -3 )
A
B
0 20 40 60 80 100 120 140
0 10 20 30 40 50 60
Densification
S
p
ec
if
ic su
rf
ace
x10
3 (m -1 )
A
B B. Evolution of the moments of the PSD with successive
densifications
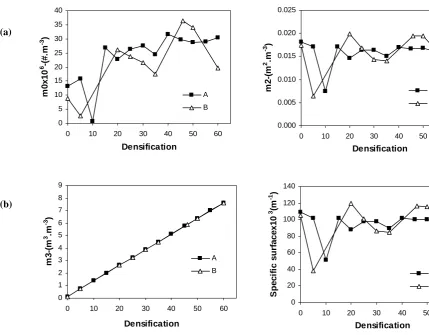
The evolution of the normalised 0th, 2nd and 3rd moments
and the volume specific surface is shown in Fig. 4. The 0th,
2nd and 3rd moments are related to the total number, area and
volume of the particles respectively.
The 0th moment showed an overall decrease in particle
number during the first ten densifications followed by a sharp rise thereafter. Overall, there was an approximately two-fold increase in the number of particles at the end of the cycles as compared to the beginning. The 2nd moment and the specific
surface showed an initial sharp drop over the first ten densifications followed by a sharp increase thereafter, a trend similar to that noted in the 0th moment. After the first 10
densification the 0th, 2nd and specific surface were
characterized by cyclic increases and decreases as shown in Fig. 4. The 3rd moment was calculated from theliquor mass
balance and shows a linear increase in particle volume with each successive densification.
From the evolution of the moments it can be concluded that the process is largely dominated by aggregation in the first ten densifications as evidenced by a sharp decrease in the particle number and area.
(a)
[image:4.595.57.487.371.706.2](b)
Fig. 4 Evolution of the 0th (a-left), 2nd (a-right) and 3rd (b-left) moments; and the volume specific surface (b-right)
Thereafter, a combination of aggregation, nucleation and/or breakage seems to be dominant. However, previous studies have demonstrated that nucleation does not occur in buffered reduction solutions ((NH4)2SO4: Ni2+ molar ratio of 1.8-4.5)
with Fe concentrations of <3mg/L as is normally the case during the densification stage [6], [7]. Unbuffered solutions are only employed at the start of the cycle to induce nucleation and provide seed for subsequent batch reductions. Scanning electron micrographs of the powder does reveal significant fragmentation of the particles towards the end of the cycle indicating the presence of breakage (Fig. 5). Therefore, it is highly unlikely that nucleation was responsible for increases in the particle number and area. The overall two-fold increase in particle number reveals that significant aggregation occurs during the nucleation step and most of these aggregates are fragmented into their primary particles as the cycle progresses. These primary particles further aggregateback into the main population as the cycle progresses. This explains the cyclic behavior noted in the 0th
and 2nd moments. Thus, after the first tendensifications the
process is largely dominated by aggregation andbreakage.
0 5 10 15 20 25 30 35 40
0 10 20 30 40 50 60
Densification
m0
x
1
0
6 -(#
.m
-3 )
A
B
0.000 0.005 0.010 0.015 0.020 0.025
0 10 20 30 40 50 60
Densification
m
2
-(m
2 .m -3 )
A
Fig. 5 SEM micrographs of fragmented nickel powder particles
The linear increase in the 3rd moment indicates that molecular
growth is also an active particulate process. Since, reduction can only occur on a catalytically active particle surface the nickel depletion rates will be largely determined by the specific surface available for reduction. Thus, while extensive aggregation in the initial stages of the cycle is desirable from a size enlargement point of view, it significantly reduces the specific surface greatly lowering the depletion rate. The decrease in depletion rate towards the end of the cycle and the increase in autoclave powder mass (making suspension difficult) limits the number of densifications that can be economically conducted to between 50-60.
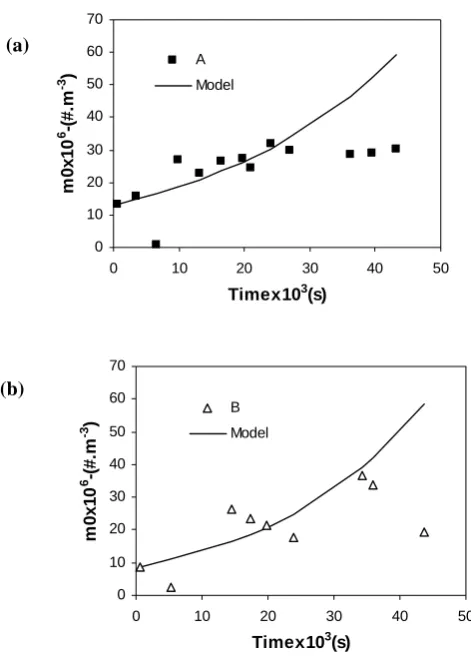
An aggregation and breakage model based on the moment transformation of PBE as described in Ntuli and Lewis [5], equation 1, was used to simulate the 0th moment (Fig. 6).
( )
(
)
bo bo tk
k
C C m k e m
bo − +
= 0 0
0 ; where C=21βom0
( )
0 2 (1)The adjustable model parameters for the aggregation kernel (β0(t)) and the size-independent factor of the breakage
frequency (kbo(t)) for cycle A were 3.59x10⁻¹⁰ m3.#-1.s-1 and
3.47x10⁻⁵ s-1 respectively and for cycle B 1.03 x10⁻¹⁰
m3.#-1.s-1 and 4.34x10⁻⁵ s-1 respectively. The sum of square
error (SSE) was 2.05x10¹⁵ m-6 and 1.82x10¹⁵ m-6 for cycle A
and B respectively. The model only gave a satisfactory fit for cycle A for the first 45 densifications (t = 27x103s) and
overestimated the 0th moments for the last 15 densifications.
This indicates that the rate of aggregation decreases significantly towards the end of the cycle and is not constant as assumed in the model. Since larger sized particles are less likely to aggregate, this reduces the aggregation rates towards the end of the cycle where a large proportion of these particles exist.
However, results for cycle B could not be satisfactorily simulated. These findings are similar to those of Lewis and Hounslow [3] who used a differential technique based on the discretised PBE and found that the process is largely dominated by aggregation and breakage. They also noted that the process is complex with different particulate processes active to varying degrees in each cycle and that none of the models generates satisfactory matches for all the experimental data.
The size-independent growth rate (G0(t)) was calculated
from the experimental rate of change of moments using equation 2 [4].
dt dm
m t
G 3
2
0()= 31ˆ (2)
The growth rate for cycle A and B were 1.36±0.81x10⁻¹¹
m.s-1 and 1.02±0.65x10⁻¹¹ m.s-1 respectively. The magnitude
of the growth rate shows that molecular growth is a slow process requiring several densifications in order to increase particle size. Thus, particle size enlargement is largely attributed to aggregation, a finding that has been confirmed by calculating the maximum particle size that can be achieved by molecular growth alone [5]. However, the final morphology of the powder has been found to be influenced by the mechanism of molecular growth [5].
(a)
(b)
Fig. 6 Normalised experimental and simulated 0th
moment for batch aggregation and breakage: (a) -cycles A and (b)-cycle B
C. Control of the precipitation process
The evolution of the PSD and its derived moments in the nickel powder precipitation process is mainly influenced by the nucleation step and the subsequent aggregation rates during the first five densifications. Excessive aggregation during the nucleation step and the initial densifications as noted in cycle B (Fig. 3(b) and 4) results in an unstable cycle. The nucleation step is more difficult to control and reproduce
100 µm 20 µm
0 10 20 30 40 50 60 70
0 10 20 30 40 50
Timex103(s)
m0
x
1
0
6 -(#
.m
-3 )
A
Model
0 10 20 30 40 50 60 70
0 10 20 30 40 50
Timex103(s)
m
0x1
0
6 -(
#
.m
-3 )
B
[image:5.595.312.548.274.605.2]and the mechanisms involved are not well understood. It is however, thought to be initiated by the homogenous nucleation of a mixed Ni-Al hydroxide on which further reduction of nickel ions occurs through an autocatalytic process. Thus, for effective control of the process seeding is more preferable than nucleation. The ideal nickel powder precipitation process should involve seeding, followed by controlled aggregation in the first ten densifications (to enhance size enlargement) and then molecular growth. Since aggregation is size dependant and it has been shown that above a certain critical size (D(4.3)=66 μm) aggregation
ceases, thus in the absence of breakage this ideal situation can be achieved [7]. With the current technology where high shear rates are employed to enable effective particle suspension, it is very difficult to eliminate particle breakage. However, with good control of the initial stages of the as in cycle A, a situation approaching the ideal can be achieved even in the presence of breakage. Particle breakage can be reduced by increasing the compactness of the nickel particles through the controlled use of growth promoters. The use of Fe, which is an inherent impurity, has been suggested as a cost effective way of achieving this without compromising powder purity [5], [7].
IV. CONCLUSION
The nickel precipitation process has been found to be characterized by significant aggregation in the first ten densifications followed by a dominance of either aggregation and/or breakage in the later stages of the cycle. It was also noted that the particles undergo significant fragmentation towards the end of the cycle producing a large of proportion of smaller sized particles. The differences in the evolution of the PSD and its derived moments between different cycles were attributed to the difficult in reproducing the nucleation step which influenced the aggregation rates during the initial stages of the cycle. The aggregation and breakage model tested only gave a reasonable fit in one of the cycles for the initial 45 densifications. The growth rate was found to be of the order of 10-11 m.s-1, indicating that growth is a slow
process requiring several densifications in order to increase particle size. For effective control an ideal precipitation process should be initiated by seeding, followed by controlled aggregation in the fist ten densifications and then molecular growth. With good control of the initial stages of the cycle, a situation approaching the ideal can be achieved even in the presence of breakage.
ACKNOWLEDGMENT
The authors gratefully acknowledge the support of the University of Johannesburg and the University of Cape Town.
REFERENCES
[1] T. Saarinen, L. E. Lindfors, and S. Fugleberg, “A review of the precipitation of nickel from salt solutions by hydrogen reduction,”
Hydrometallurgy, vol. 47, 1988, pp. 309-324.
[2] A. Agrawal, V. Kumar, B. D. Pandey, and K. K. Sahu, “A comprehensive review on the hydro metallurgical process for the production of nickel and copper powders by hydrogen reduction,”
Materials Research Bulletin, vol. 41, 2006, pp. 879-892.
[3] A. E. Lewis, and M. J. Hounslow, “Identifying mechanisms of nickel precipitation in a hydrogen reduction process,” in 16th Industrial
Crystallisation Conference,J. Ulrich, Ed. Dresden, Germany, 2005,
pp. 391-398.
[4] M. J. Hounslow, R. L. Ryall, and V. R. Marshall, “A discretized population balance for nucleation, growth, and aggregation,” AIChE
Journal, vol. 34(11), 1988, pp. 1821-1832.
[5] F. Ntuli, and A. E. Lewis, “Kinetic modelling of nickel powder precipitation by high-pressure hydrogen reduction,” Chemical
Engineering Science,vol. 64, 2009, pp. 2202-2215.
[6] Sherritt Gordon Mines, “The manufacture and properties of metal powders produced by the gaseous reduction of aqueous solutions,”
Powder Metallurgy, vol. 12, 1958, pp. 40-52.