Abstract— The concepts of size and scale are of fundamental importance in science, engineering and technology, and occupy a central place in human experience and thought. Size and shape are crucial properties of physical and abstract objects, while scale and dimension are basic descriptive tools that we employ to compare them. Understanding the dependence of physical phenomena on size and scale allows us to develop predictive tools that form the core of design and enable the creation of artefacts and technological systems. Of particular interest to us are situations when the size dependence turns out to be complex, characterized by changes and transitions in behaviour between different scales, e.g. laboratory and full scale prototypes, nano-scale objects as opposed to macroscopic, etc.
Scaling transitions and size effects in the fracture and strength of materials and structures have particular significance in modern science and engineering. The boundaries of scale of the mechanical phenomena studied and devices exploited are expanding, on the one hand, towards global scale phenomena, and on the other towards the nanometre scale processes. These circumstances challenge the conventional wisdom acquired over many decades, according to which laboratory experiments performed at the engineering scale (sub-mm to a few meters) provide the source of material property data then used as input for modelling at the scale of the real object. When deviations from accepted scaling laws are found, new physical deformation mechanisms need to be proposed or identified, and new modelling approaches to be developed and validated.
In this paper I review some examples of non-trivial size dependence, and address a fundamental question of the efficient description of size effects and scale transitions. The functional description of multi-scaling power law regimes is considered, and the functional form suitable for the task is identified. This form is then applied to a variety of experimental data manifesting size effects, including dual failure strength criteria (stress and toughness), fatigue crack growth thresholds (Kitagawa-Takahashi diagram) and applications in the context of fretting fatigue, Paris fatigue crack growth law, hardness of coated systems, etc.
Index Terms— Size effects, scaling, multi-scale description and modeling, eigenstrain, diffraction, residual stress.
Manuscript received 22 March, 2008, and presented as Keynote opening lecture at WCE2008.
The work reviewed was supported in part by the UK Department of Trade and Industry (DTI) and Rolls-Royce plc; and by the UK research councils (EPSRC, STFC) through the provision of research funding and access to large scale research facilities (ESRF, ILL, SRS Daresbury, Diamond Light Source, ISIS).
Alexander M. Korsunsky is Professor of Engineering Science in the Department of Engineering Science, University of Oxford, Parks Road, Oxford OX1 3PJ, UK (phone: +44-1865-273043; fax: +44-1865-273010; e-mail: [email protected]).
I. INTRODUCTION
In most situations in life, size matters. A good quality scaled model serves the purpose of representing faithfully the real object, by being proportionate, i.e. geometrically similar, but differing in size. Though it is easy to assume that the difference in size is plainly evident, in fact it can only be discovered through comparison with some reference: e.g. the original, or a standard, an object of known length.
Philosophers like to amuse themselves with hypothetical questions, and here is one that is relevant to our theme: what would happen if overnight, while we were asleep, everything around us were to double in size? How would we know when we woke up the next morning?
Of course, we must assume that the same fate befalls all of our standards and reference tools: rulers, tape measures, etc. Clearly therefore, were we to confine our interest to geometric dimensions, nothing would reveal this drastic change to us. Every attempt to discover the changed dimensions will be foiled, because there isn’t an object remaining unaltered. What comes to our rescue is the fact that physical properties of objects are not limited to geometric dimensions. Quantum physics furnishes us with several length dimensions entirely expressible in terms of universal constants. So, unless all of universal constants change at the same time, a comparison with a quantum standard should reveal what has happened. However, even in the macroscopic world we are able to find some properties of solids that do not scale in the same way as their size.
The property that interests us most is strength. A solid body that is twice the size of another body will not have the same breaking strength. It is for this reason that larger animals have a bigger proportion of the body weight taken up by the skeleton. The scaling of structural and material strength is our main interest in this study.
Renaissance engineers like da Vinci were aware of the dependence of strength on size. Their studies of design and structural strength started an inexorable process of evolutionary development in science and technology. The products and consequences of this evolution today have permeated the lives of most people to the extent unseen in history. Work efficiency, comfort, health, and the very lives of people now depend directly on the reliable performance of technological devices, and this reliance continues to increase in countless ways. However, both technological and natural systems are fragile: they break. An inalienable function of engineering and technology is to predict and control this fragility.
Several efficient methods of dealing with fragility of systems are known. The first is to increase the strength and
A Review of Size and Scale Effects in
Strength and Failure of Materials and Structures
durability of systems so much that the time it takes for them to fail (lifetime) greatly exceeds the time they are kept in service. Although this solution might be preferred in all cases, it is unfortunate that sometimes it is not realistic, and often it leads to impracticably large, heavy or expensive designs.
An alternative approach, known as defect tolerant design, is to learn to predict the conditions and the moment of failure, and to withdraw, refurbish or replace systems safely prior to failure. The defect tolerant approach underpins much of the modern advanced mechanical design found in the automotive manufacture, aerospace, power generation and numerous other industries.
Reliable determination or prediction of strength of man-made objects and structures is a central task for much of the ongoing research. The vast area of science and engineering encompasses mechanical engineering, materials science, physics and chemistry. In these connected, but disparate fields, failure may be defined in different terms and at different structural scales. Methods of experimental study and theoretical description of physical phenomena differ significantly, as do the ways of expressing results. However, in all cases key aspects of strength determination are retained. These key aspects are associated with concepts of stage and scale.
Stages of behaviour of physical systems are important for several reasons. Firstly, the behaviour of the system within each stage may possess certain strong regularities which don’t apply outside that stage, but allow the system description to be drastically simplified within the stage. Secondly, the transition between different stages often represents the critical element of information required for the prediction of failure. Finally, stages of deformation or damage accumulation can often be successfully identified with diminishing strength, or be used to evaluate the remaining strength. The ability to assess the strength of a structure or an object at any point during its lifetime is critical for determining its serviceability. The judgment about the remaining strength (or its complement, extent of damage) has to rely on the analysis of the structural state, and in particular, the stage of defect accumulation. It is the general regularities of defect accumulation, identifiable stages of this process and the conditions for the transition between them that particularly concern us here.
The analysis of defects and strength has to be carried out for a specific structure and at a specific scale. The scale of analysis is often different from the actual scale. The knowledge of the scaling behaviour is important because experimental techniques often require tests to be conducted on miniature specimens. Scaling of strength is a crucial issue whenever these laboratory experiments conducted on a model system are used to predict the strength of the full scale prototype.
It has become a convention to identify ranges of scale with decades of characteristic length dimension. We speak of macroscopic scale when referring to structures and objects that are millimetres to metres in size. The size scale between 1 to 1000 micrometres is referred to as microscopic, while that between smaller than a fraction of a micrometre has become to be called nanoscale. Moving in the other direction, one might call the scale from about 1 metre to a kilometre the large
structural scale, and that from a kilometre to thousands kilometres the global scale.
In trying to identify the governing rules for the development of damage and the reduction of strength during and between stages, and at different scales, we are looking for the most general fundamental aspects, with the widest range of applicability. We therefore use for this task the most general analysis methods available: the principles of dimensional analysis, and the considerations of mechanical energy storage and transformation.
Strength of a solid is often measured by the maximum load it can carry, having the units of force, [F], or moment, [F] [L]. Once the force or moment reach a critical value, the object breaks.
An alternative, and more successfully transferable measure of strength of a solid is the breaking stress, which has units [F]/[L]2. At a critical value of stress that we associate with failure a solid might break or deform permanently.
With the development of engineered objects subjected to large constant or varying tensile stresses it was quickly discovered that stress as a measure of strength is not always sufficient or appropriate. Stress intensity factor was introduced: a parameter that depends on the loading, but also the geometry of the specimen and of the defects it contains. Stress intensity factor has fractional dimension of [F]/[L]3/2. When a critical value of stress intensity factor is attained, defects present in the object might initiate or propagate, either in a stable or in a catastrophically fast manner.
Instead of asking the philosophical question about all
objects doubling in size overnight, engineers and materials scientists are usually much more interested to know what happens when certain specific objects or components are scaled up or down in size, and how to predict their strength.
II. ANALYSIS FRAMEWORK
Material properties and system parameters are often introduced in physical laws as proportionality coefficients between measurable quantities, e.g. between (some power of) the crack length and the critical failure load, etc. It is important to note the logical reason for introducing such parameters: they are useful because they remain constant over a certain range of system sizes. However, outside this range the parameters show a dependence on system size that requires the form of descriptive equations to be reviewed and modified, or, alternatively, require a description of the scale dependence of physical parameters to be introduced.
If a physical system possesses no inherent length scale, functional analysis can be used [1, 2] to demonstrate that the dependence of an arbitrary physical parameter of a system on its size must obey a power law. If two physical quantities are related by a power law, y=Cxα , then the parameter
C=yx−α can be thought of as invariant in x. If x represents a measure of the system dimension, then C is said to be size independent, or scale invariant. This parameter is often thought of as a property of the system that has a dimension obtained by the appropriate combination of the units of quantities x and y.
from simple power law descriptions. The terms 'size effect' or 'scale dependence' are indeed used when a particular power law no longer applies, in the sense that parameter C that describes the system property is no longer constant, and has to be thought to be a function of x.
Of particular interest is the size dependence of material strength. Depending on the context, the precise nature of the physical parameter y (here thought to represent strength) may vary. It could denote the critical value of stress or stress rate, the stress intensity factor or toughness, hardness, etc. Several instances of power multi-scaling can be considered in which transitions are observed between distinct power laws, each persisting within certain limited range of system sizes. To describe these transitions, the ‘knee’ function can be introduced as an efficient tool for the description of this type of multi-scaling.
A general result of wide applicability can be established [2] according to which in the absence of a characteristic length, the strength (or, indeed, any other physical parameter) of a structure scales with the size according to a power law,
Y=Y D D0
(
/ 0)
m=CDm, (1) where D D, 0and Y Y, 0denote the dimension and strength ofthe prototype and the model respectively. Note that introduction of the system parameter
C
that becomes a compound system property describing the scaling behaviour of its strength with size. [image:3.595.308.543.110.321.2]Power law scaling of strength and deformation parameters is omnipresent in phenomenological laws describing mechanical behaviour of materials – a few are listed in Table 1.
Table 1. Power law scaling in the context of material strength Ramberg-Osgood
elasto-plastic constitutive law /
(
/)
mE k
ε σ
= +σ
Power law creep / n
d
ε
dt=Aσ
Paris law of fatigue crack growth
/ n
da dN = ΔA K
Kachanov’s law of damage accumulation
/
d
ω
dt=Cω
Each of the instances of power law behaviour suggests a situation when a characteristic length scale parameter is absent, i.e. size independence. In many situations in the science of strength of materials simple power law dependencies between parameters apply only if certain inequalities between problem parameters are satisfied. Regimes of simple power law scaling may appear at extremes of parameter values, large or small, or may correspond to intermediate asymptotic behaviour.
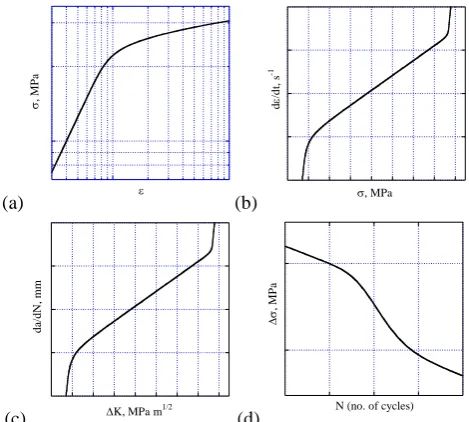
If, on the other hand, a characteristic length of some kind is present, all structures can no longer be thought of as indistinguishable, and strength scaling obeys a more complex function. It is convenient to represent the phenomena of the type described here in bilogarithmic coordinates, since power law functions appear as straight lines, and line slopes indicate power exponents. Figure 1 shows, in bi-logarithmic
coordinates, cartoons of some well-known laws of deformation and strength which display the multi-scaling character.
(a) ε
σ
, MP
a
(b) σ, MPa
d
ε
/d
t,
s
-1
(c) ΔK, MPa m1/2
da/dN
, mm
(d)
Δσ
, M
P
a
N (no. of cycles)
Figure 1. (a) Ramberg-Osgood elasto-plastic deformation law, (b) creep strain rate dependence on stress,
(c) Paris’ kinetic fatigue crack growth diagram, (d) high cycle fatigue failure under alternating stress.
Co-existence and competition between several power laws leads to transitions from regions of dominance of one power law to another as some length, size or loading parameter is increased. In order to identify a suitable form for the description of these transitions the ‘knee’ function approach is proposed [3].
Consider the following formulation of the general multi-scaling transition problem:
Let the behaviour of a physical system be described by the relationship between two parameters x and Δ = −y y y1:
Small x regime (x<<x0): Δy y/ 0=( /x x0)α. Large
x
regime (x>>x0): Δy y/ 0=( /x x0)β.The exact nature of the transition between the two regimes is unknown. An approximate functional form is sought for the description of system behaviour in the region x≅x0.
Problems of this type are encountered throughout the study of size effects and scales and stages of deformation, and in other branches of science and engineering. In many cases precise description of the transition can be obtained from laborious and detailed modelling of the problem in question. Here the purpose is different: to extract maximum information from the known extremes of behaviour of the physical system, and some limited experimental data obtained in the transition region.
[image:3.595.46.288.477.571.2]dimensionless combination of the system parameters for which the two extreme regimes of behaviour are simply additive. This assumption gives the result:
1/ / /
0 0 0
(
Δ
y y
/
)
γ=
( /
x x
)
α γ+
( /
x x
)
β γ , (2) or, consequently,( ) /
0 0 0
(Δy y/ )=( /x x )α⎡⎣1 ( /+ x x )β α γ− ⎤⎦γ. (3) This is a general functional form for the approximate description of transitions between different power law regimes. Since on the bi-logarithmic coordinates it appears in the form of a kink, or knee, we shall refer to it as the knee function. A particular case often encountered in practice corresponds to
α =
0
, when the power law behaviour in one extreme is given by a constant. Upon introducing the notation b= −β
,c
=
γ
, the following expression is obtained:0
/ 0
1 ( / )
1 ( / )b c c
y y
x x
Δ =
⎡ + ⎤
⎣ ⎦
. (4)
or, in terms of parameter
y
itself:0 1
/ 0
1 ( / )b c c
y
y y
x x
= +
⎡ + ⎤
⎣ ⎦
. (5)
Having established the form of the ‘knee’ function we now consider some examples of its application.
III. LINEAR ELASTIC FRACTURE MECHANICS AND THE LIMIT STRESS CRITERION
Griffith’s LEFM scaling law [4] in the form
2
2 /(1 ) Ic
a E K
σ π
=γ
−ν
= (6)gives rise to a paradox. If cracks of progressively smaller size are considered, specimen strength is predicted to increase without limit. This is in contradiction with observations, since even most carefully prepared and defect-free specimens of any material possess finite strength.
The distinction between the two extremes of behaviour within the framework of LEFM is sometimes referred to as the long crack and the short crack regimes, respectively. In the long crack regime the inverse square root scaling with crack size is expected, while in the short crack regime the specimens must possess a limiting stress value associated with alternative failure phenomenon, e.g. yield. In order to capture the strength scaling behaviour over the entire range of crack length a multi-scaling description of the two criteria is required. The existence of the two regimes of strength behaviour already became apparent in the early experiments of Irwin [5]. Experiments were conducted on thin (0.8mm) large sheet of aluminium 7075 alloy containing central slits normal to the tensile loading direction. Irwin calculated the net section stress at instability, accounting for finite width of the sheet, and plotted this stress as a function of the crack (slit) length
2
a
. Irwin’s results clearly demonstrated the inverse square root behaviour predicted by LEFM, as illustrated by the dropping portion of the curve shown in Figure 2(a).200 250 300 350 400 450 500
0 50 100 150 200 250 300 350 400
σ
(M
P
a
)
2a (mm)
σ = σ
1 / (1+(2a/2a1) n
)0.5/n
σ
1 = 482 ? 25 MPa a
1 = 68 ? 11 mm n = 10
σ ~ 1/(2a)0.5
200 300 400
10 100
σ
(M
P
a
)
2a (mm)
σ = σ
1 / (1+(2a/2a1) n
)0.5/n
σ
1 = 482 ? 25 MPa a
1 = 68 ? 11 mm n = 10
[image:4.595.324.532.87.500.2]-1/2
Figure 2. The Irwin et al [5] data for the net failure stress as a function of the total slit length 2a, plotted (a) in linear coordinates, and (b) bilogarithmic coordinates, with the “knee function” describing the transition between the two regimes. However, it is also apparent from this figure that for shorter cracks there exists a limiting value of stress that is independent of the crack length
2
a
, provided it does not exceed some threshold value, 2a<2a1. Combination of the two failure criteria with different scaling behaviour is required to obtain a description that is valid over the entire range of crack lengths. Using the approach based on the “knee function” described in the previous section, the two-criterion failure criterion must satisfy the following conditions:Long cracks (
a
/
a
1→
∞
):failure stress obeys LEFM scaling, 1/2 1 1 ( / )
/
σ
= a a −σ
.Short cracks (
a
/
a
1→
0
):(
)
(
n)
na
a
1 0.5/1
1
/
1
+
=
σ
σ
. (7) This function displays the required behaviour in the extremes of long and short crack lengths. Parameter n provides control over the transition between the two regimes: the greater the value of n, the sharper the appearance of the “knee” on the diagram. The application of the knee function (7) to Irwin’s data is shown in Figures 2(a) and 2(b) by the continuous curves. The parameters of the knee function have been identified by the least squares procedure.
IV. PARIS FATIGUE CRACK GROWTH DIAGRAM
Paris fatigue crack growth rate (FCGR) diagram relates the crack extension rate d / d
a
N
with the stress intensity factor range, ΔK. In practice it is often observed that FCGR also depends on the maximum stress intensity factor, Kmax, leading to the use compound parameters, such as 1max
m m
K − K
Δ .
Figure 3(a) shows the dependence of fatigue crack growth rate on applied stress intensity factor range ΔK for a titanium alloy [6]. The data has been presented on bi-logarithmic scale with the crack growth rated / d
a
N
chosen as the abscissa, for convenience of analysis. This choice allows the ‘knee’ function to be applied for the description of the dependence in the form(
/)
0
(
)
1 ( ' / ')
Ic th
th b c c
K
K
K
K
a
a
Δ
− Δ
Δ = Δ
+
+
, (8)where ΔKthdenotes the fatigue threshold, ΔKIc corresponds to the critical stress intensity factor for fast fracture,
a
'=d / da
N
is the crack advance per cycle and a'0 is the intermediate value of this parameter in the transition range. Parameters
b
andc
describe the slope of the diagram and the sharpness of the transition. Assuming stress intensity factor threshold of
7.5 th
K
Δ = , the following values of the parameters are found that describe the continuous curve in Figure 3(a):
6 0
85.8 6.7
' (6.1 1.3) 10 Ic
K
a −
Δ = ±
= ± ×
0.4 0.03
0.55 0.15
m
α
= ±= ±
Figure 3(b) shows the dependence of the rate of crack growth under fatigue loading on the applied stress intensity factor rangeΔK for a corrosion resistant titanium alloy tested in air, in distilled water and in 3.5% aqueous solution of NaCl [6]. The use of knee function description allows revealing aspects of behaviour not immediately apparent from experimental data, such as the reduction of the upper stress intensity factor threshold for one of the cases considered.
Figure 3(b) shows the dependence of the rate of crack growth under fatigue loading on the applied stress intensity factor rangeΔK for a corrosion resistant titanium alloy tested in air, in distilled water and in 3.5% aqueous solution of NaCl [6]. The use of knee function reveals aspects not immediately apparent from experimental data, such as the reduction of the upper stress intensity factor threshold for one of the cases considered.
(a)
10 100
10-1110-10 10-9 10-8 10-7 10-6 10-5 10-4 10-3
Δ
K
da/dN, m/cycle
(b)
10-9 10-8 10-7 10-6 10-5 10-4 In air
In distilled water In 3.5% NaCl solution
10 100
Δ
K,
M
P
a
m
1/2
da/dN, m/cycle
Figure 3. (a), (b) Fatigue crack growth diagrams [6].
V. FRETTING FATIGUE THRESHOLDS
Fretting fatigue is a complex phenomenon governed by the process of micro-slip at the edge of partially adhered frictional contact where stress concentration and stress gradients are particularly high, and the process of crack initiation and propagation exhibits strong and complex dependence on size and scale. A variety of approaches have been proposed for the description of threshold conditions that must serve as the basis for rational design criteria [9].
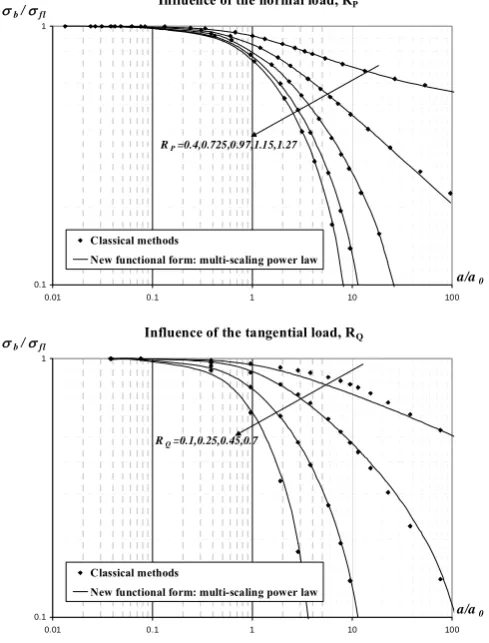
[image:5.595.316.537.86.506.2]trailing edge of the contact) constant and vary aby varying the load and pad radius. Similar reasoning may be applied to contacts of more complex geometries, e.g. flat and rounded in shape. Nowell [10] undertook several series of experiments where the magnitude of p0 was kept constant while the contact size was varied. Within each series, a critical size of contact above which short fatigue lives were observed was found, whereas smaller contacts specimen lasted for more than 107 cycles. Therefore, the fretting strength of the component was found to decreases with increasing contact width. Dini [11] made similar analysis for flat and rounded contact geometries.
Influence of the normal load, RP
0.1 1
0.01 0.1 1 10 100
a/a0
σb/σfl
Classical methods
New functional form: multi-scaling power law
RP=0.4,0.725,0.97,1.15,1.27
Influence of the tangential load, RQ
0.1 1
0.01 0.1 1 10 100
a/a0
σb/σfl
Classical methods
New functional form: multi-scaling power law
[image:6.595.47.292.229.551.2]RQ=0.1,0.25,0.45,0.7
Figure 5. Threshold predictions (markers) and the ‘knee’ function description (continuous curves). The functional form of the multi-scaling power law suitable for the present context describes the dependence of fretting strength of a contact,
σ
b, on its size, a:(
)
(
2 3)
31
0 0 1
( ) ( ) ( ) 0
( )
/ , ( )
1 ( / ) b
C C
fl C
C
a a C
a a
σ
σ
= + + Λ Λ ΛΛ
Λ Λ , (9)
where a0 is the combined size-material parameter defined by El Haddad [8]. Symbol Λ stands here for the set of parameters
(R RP, Q, , )f G , where RP = p0 σfl and RQ =Q/fP are
dimensionless parameters defined respectively for the peak normal pressurep0 and tangential load Q,
σ
fl is the material fatigue limit, f is the coefficient of friction, and G is ageometrical factor that accounts for the shape of the couplings. The application of the derivation of threshold curves for fretting of Hertzian contacts is illustrated in Figure 5. Optimised functional form was found by comparison with data derived from short crack arrest design methodologies. In particular, making use of the thresholds derived by Dini [11] for Al-4%Cu alloys (metal on metal contact was only considered, so that the coefficient of friction was 0.55), a general expression for the dependence of functions C0, C1, C2
and C3 in (12) on loading parameters RP and RQ was found.
Comparison between the prediction curves obtained using the functional form (12) with the results from Dini [11] (markers) are shown in Figure 5. Note the logarithmic scales used for both axes, and the fact that the single formula (12) captures the entire set of predicted threshold curves depending on not less than three different parameters.
VI. CONCLUSIONS
The present paper contains an overview of some instances of non-trivial size dependence and scaling behaviour in the strength of engineering materials and systems. On the basis of the analysis of the fundamental relationships between physical quantities it is concluded that scaling transitions are often associated with the change of power laws, caused by the change of the underlying physical mechanisms.
In order to obtain a quantitative description of these transitions, a generic ‘knee’ function was introduced. This tool provides a means of quantifying the relationship between system dimensions and strength in the intermediate transition regime without the need to perform detailed simulation. To illustrate the utility of this approach, a number of applications were considered in the study of strength. It was shown that the method works well even in such complex situations like the case of fretting fatigue thresholds, when the system strength depends on three independent parameters.
REFERENCES
[1] G.I. Barenblatt (1979) Similarity, self-similarity and intermediate asymptotics. Consultants Bureau, New York.
[2] Z.P. Bazant (2002) Scaling of Structural Strength, Hermes Penton Science.
[3] A.M. Korsunsky (2003) “Multi-Scale Power Laws in the Study of Material Strength”, e-print arXiv cond-mat/0508653.
[4] A.A. Griffith (1921) “The Phenomena of Rupture and Flow in Solids.” Phil. Trans., 221A, 179-180.
[5] G.R. Irwin, J.A. Kies, H.L. Smith (1958) ASTM STP 381.
[6] L.R. Botvina, S.Ya. Yarema, V.V. Grechko, L.V. Limar (1981) Phys-Chem. Mech. of Matls, 6, 41-50.
[7] H. Kitagawa, S. Takahashi (1976) “Applicability of fracture mechanics to very small cracks or the cracks in the early stage”, in Proc. 2nd Int. Conf. Mech. Behav. Mater., Boston, 627-631.
[8] M.N. El Haddad, N.E. Dowling, T.H. Topper, K.N. Smith (1980) “J-integral Applications for Short Fatigue Cracks at Notches”. Int. J. Fract., 16, 15-20.
[9] D. Dini, D. Nowell, A.M. Korsunsky (2005) “On Size Effects in Fretting Fatigue Thresholds”, Int. J. Fracture, 135, L11-18.
[10] D. Nowell (1988) “An analysis of fretting fatigue”, D. Phil. thesis, University of Oxford.
![Figure 2. The Irwin et al [5] data for the net failure stress as a function of the total slit length 2a, plotted (a) in linear coordinates, and (b) bilogarithmic coordinates, with the “knee function” describing the transition between the two regimes](https://thumb-us.123doks.com/thumbv2/123dok_us/1326934.663478/4.595.324.532.87.500/figure-function-coordinates-bilogarithmic-coordinates-function-describing-transition.webp)
![Figure 3. (a), (b) Fatigue crack growth diagrams [6].](https://thumb-us.123doks.com/thumbv2/123dok_us/1326934.663478/5.595.316.537.86.506/figure-b-fatigue-crack-growth-diagrams.webp)