the Lifetime
Stephanie Foana, Andrew Jacksona, Ian Spendlovea, Uwe Aickelinb
a
Academic Unit of Clinical Oncology andbIntelligent Modelling and Analysis Research Group, University of Nottingham
Abstract. It is widely accepted that the immune system undergoes age-related changes correlating with increased disease in the elderly. T cell subsets have been implicated. The aim of this work is firstly to implement and validate a simulation of T regulatory cell (Treg) dynamics throughout the lifetime, based on a model
by Baltcheva. We show that our initial simulation produces an inversion between precursor and mature Tregs at around 20 years of age, though the output differs
significantly from the original laboratory dataset. Secondly, this report discusses development of the model to incorporate new data from a cross-sectional study of healthy blood donors addressing balance between Tregs and Th17 cells with
novel markers for Treg. The potential for simulation to add insight into immune
aging is discussed.
1
Introduction to System Dynamics Modelling of Immunity
Simulation has been defined as methods and applications mimicking the behaviour of a real system [1]. The benefits of simulation to immunology include time- and cost-effectiveness as well as less labour- and resource-intensiveness resulting from removal from the biological environment.In vitroexperimentation is useful for investigating individual interactions but is far removed from the whole picture, andin vivo experi-mentation is useful for the whole picture but is unlikely to answer specific questions [2]. Using simulation, flexibility is available for systematically generating hypotheses and conducting experiments impossible to do practically, yet informed by robust data and literature.
System dynamics simulations are useful for looking at complex systems over time. They are characterised by stocks of an entity and flows between stocks [3]. Immune system examples of stocks include precursor and mature T cell pools and flows might represent transition of cells from precursor to mature. This technique is useful for mod-elling relationships defined by differential equations. An example of a differential equa-tion describing T cell dynamics is the change in number of precursor cells equated to proliferation of precursors minus death and maturation rates. This ongoing work will apply system dynamics simulation technique to complementin vitrostudies of Th17s and Tregs throughout the lifetime.
2
The Need for Balance: T
h17s and T
regs Throughout the Lifetime
prevent damage to self. There is evidence to suggest an age-related tendency to a pro-inflammatory environment [4] contributing to more collateral damage and autoimmune diseases. This work addresses the hypothesis that important contributors to this state of imbalance are Th17 cells (amplifying immune responses) and Tregs (dampening down immune responses). Although some studies have shown an age-related increase in the number of Tregs in human peripheral blood [5][6], it has also been shown that homeostasis is maintained [7]. One study concluded upon the oscillatory nature of Treg numbers through life, with peaks in adolescence and in over 60 year olds [8]. A recent study in Th17 cells with age showed a small decrease in the frequency of Th17 cells in the CD4+memory population in elderly donors relative to young [9]. However, for the balance between Tregs and Th17 cells, there is currently no published literature.
There is evidence that the balance between Tregs and Th17s is altered in age-related diseases such as acute coronary syndrome [10]. Thus it is intuitive that this balance should be examined with a cross sectional study in healthy donors of different ages. Laboratory experimentation will begin by using flow cytometry to enumerate peripheral blood cells expressing CD4, CD25 and signature transcription factors of these subsets: Foxp3 and Helios for Tregs and RORcfor Th17 cells.
3
Method: Simulation of T
regDynamics
Ultimately we wish to build a model of the dynamics of Tregs and Th17 cells through-out life from data currently being collected. Preliminary work for this has involved building a system dynamics simulation in AnyLogic 6.5.0 University Edition, based on a mathematical model by Baltcheva [11]. This model was selected as it compre-hensively incorporates the functional dynamics of Tregs in terms of homeostasis and during an acute immune response. It characterises the changing precursor and mature Treg populations throughout the human lifetime. Key assumptions include that there is no change in function or responsiveness throughout the lifetime, nor a change to other influential factors on their dynamics such as dendritic cell number and function [11]. Also, the immune response considered includes an expansion and contraction phase, and only one response can occur at a given timepoint [11]. The original model was based on numbers of CD4+CD25+CD45RO−(precursor) and CD4+CD25+CD45RO+
(ma-ture) populations in 119 peripheral blood samples of donors aged 19 to 81 [11]. Al-though total numbers of CD4+CD25+cells remained constant, the ratio of precursor to mature was inverted in early adulthood. This represents an important dimension to the observed homeostasis in Treg numbers throughout the lifespan, especially when con-sidering thymic involution from adolescence, reducing the number of new cells entering the system.
subsets [11]. The parameter values used correspond to means of the distributions for scenario 2iiia given in Baltcheva’s work [11]. The simulation is shown below:
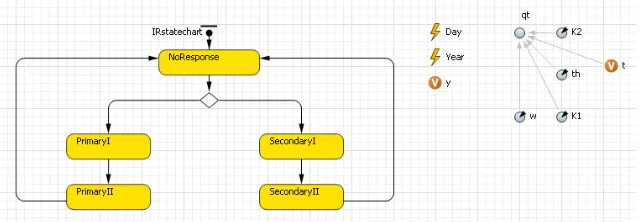
Figure 1: Main View. Events are shown with for time in days (t) and years (y). Flow variables given by involve a rate of conversion multiplied by the number of cells in the stocks namedY cloneP,−Rand−Q.P corresponds to precursors,Rto active matures andQto quiescent matures. These stocks are prefixed byY cloneas they repre-sent total and antigen-specific Tregs determined by an array. Homeostatic parameters apply to the total Tregpopulation, whereas immune response parameters are applied to a proportion given bypiN. For example, flow of specific precursors into the active ma-ture stock is given by specific precursor stock multiplied by the maturation rate. Each time point, AnyLogic recalculates each stock using the flows defined.
An additional class (immuneResponse) controls the immune system functional status usingIRstatechart:
[image:3.612.136.456.471.582.2]parame-tersc,dRanddQare applied. InSecondaryIparametersbandf are applied and in SecondaryIIthese are set to zero andc,dRanddQare applied.
[image:4.612.147.478.154.264.2]Figure 3 (generated using MATLAB R2010a): Output data from AnyLogic over a com-plete run. a) Total precursor and quiescent mature Treg stocks. b) Total active Tregs. Each peak corresponds to antigen-specific clones experiencing either primary or sec-ondary immune responses.
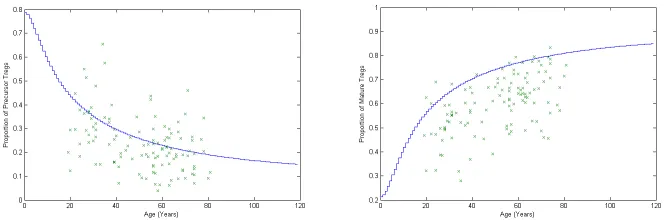
Figure 4 shows simulation output compared to the original dataset. Data has been col-lected for each stock over 3 complete replications. The maximum standard deviation between three runs for the total precursors was 2.753x10⁻⁷. The maximum standard deviation for total quiescent matures was 9411.
Figure 4: Output data compared to Baltcheva’s dataset. a) The proportion of total Tregs in the precursor stock. b) The proportion of total Tregs in the quiescent stock.
[image:4.612.146.478.393.503.2]Age (Years) Median Difference Mann Whitney Test Proportion of
Precursors
Proportion of Matures
Proportion of Precursors
Proportion of Matures
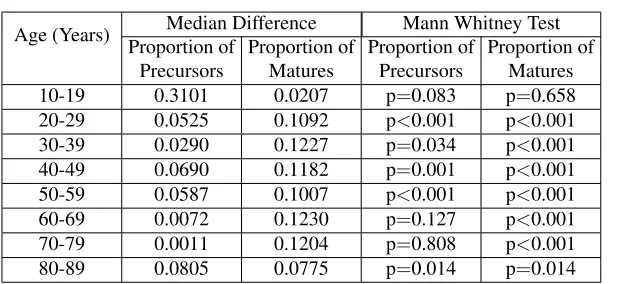
10-19 0.3101 0.0207 p=0.083 p=0.658
20-29 0.0525 0.1092 p<0.001 p<0.001
30-39 0.0290 0.1227 p=0.034 p<0.001
40-49 0.0690 0.1182 p=0.001 p<0.001
50-59 0.0587 0.1007 p<0.001 p<0.001
60-69 0.0072 0.1230 p=0.127 p<0.001
70-79 0.0011 0.1204 p=0.808 p<0.001
[image:5.612.157.466.110.252.2]80-89 0.0805 0.0775 p=0.014 p=0.014
Table 1: Comparison of median output and laboratory data for each 10-year age group.
4
Discussion and Concluding Remarks
The implementation of Baltcheva’s model as a system dynamics simulation has been documented here and compared to experimental evidence. It has been shown that the simulation mimics the key feature of inversion of precursor and memory cells in early adulthood. The lack of statistical similarity between simulation output and laboratory data indicates that further validation of this model is necessary and will involve a com-parison of other scenarios proposed in Baltcheva’s work. Ultimately we will develop and validate a simulation of our novel dataset of Treg and Th17 cells using this sort of approach. CD4+CD25+Foxp3+and CD4+Foxp3+Helios+cell numbers instead of CD4+CD25+s for T
regs will also be collected as they are arguably more specific mark-ers [12][13]. In terms of improving the simulation, alternatives to continually reactivat-ing a sreactivat-ingle Tregclone are required, as is simulation of more than one immune stimulus at a time. Baltcheva discloses various assumptions including no difference in Treg func-tion [11]. It may be possible to improve this model by considering funcfunc-tional as well as numerical changes to Tregsubsets with age.
and system dynamics simulation as exemplified by Baltcheva’s work will be useful to address relationships between T cell subsets over time. The model might also be devel-oped to consider new questions about response to interventions and the length of time the immune system might be able to maintain Tregand Th17 cell homeostasis.
With thanks to Irina Baltcheva for providing her raw data.
References
1. Kelton, W.D., Sadowski, R.P., Swets, N.B.: Simulation with Arena: 5th Edition. McGraw-Hill International Edition (2010)
2. Kim, P.S., Levy, D., Lee, P.P.: Modeling and Simulation of the Immune System as a Self-Regulating Network. Volume 467 of Methods in Enzymology. Academic Press (2009) 79 – 109
3. Figueredo, G.P., Aickelin, U.: Investigating immune system aging: System dynamics and agent-based modelling. In: Proceedings of the Summer Computer Simulation Conference 2010. (2010)
4. Boren, E., Gershwin, M.E.: Inflamm-aging: Autoimmunity, and the Immune-Risk Pheno-type. Autoimmunity Reviews3(2004) 401–406
5. Rosenkranz, D., Weyer, S., Tolosa, E., Gaenslen, A., Berg, D., Leyhe, T., Gasser, T., Stoltze, L.: Higher Frequency of Regulatory T Cells in the Elderly and Increased Suppressive Activ-ity in Neurodegeneration. Journal of Neuroimmunology188(2007) 117–127
6. Gregg, R., Smith, C.M., Clark, F.J., Dunnion, D., Khan, N., Chakraverty, R., Nayak, L., Moss, P.A.: The Number of Human Peripheral Blood CD4+CD25highRegulatory T Cells
Increases with Age. Clinical and Experimental Immunology140(2005) 540–546
7. Hwang, K.A., Kim, H.R., Kang, I.: Aging and Human CD4+Regulatory T Cells. Clinical Immunology130(2009) 509–517
8. Faria, A.M., de Moraes, S.M., de Freitas, L.H., Speziali, E., Soares, T.F., Figueiredo-Neves, S.P., Vitelli-Avelar, D.M., Martins, M.A., Barbosa, K.V., Soares, E.B., Sathler-Avelar, R., Peruhype-Magalhaes, V., Cardoso, G.M., Comin, F., Teixeira, R., Eloi-Santos, S.M., Queiroz, D.M., Correa-Oliveira, R., Bauer, M.E., Teixeira-Carvalho, A., Martins-Filho, O.A.: Variation Rhythms of Lymphocyte Subsets During Healthy Aging. Neuroim-munomodulation15(2008) 365–379
9. Lee, J.S., Lee, W.W., Kim, S.H., Kang, Y., Lee, N., Shin, M.S., Kang, S.W., Kang, I.: Age-associated alteration in naive and memory th17 cell response in humans. Clinical Immunol-ogyIn Press, Corrected Proof(2011) –
10. Li, Q., Wang, Y., Chen, K., Zhou, Q., Wei, W., Wang, Y., Wang, Y.: The Role of Oxidized Low-Density Lipoprotein in Breaking Peripheral Th17/TregBalance in Patients with Acute
Coronary Syndrome. Biochemical and Biophysical Research Communications394(2010) 836–842
11. Baltcheva, I., Codarri, L., Pantaleo, G., Boudec, J.Y.L.: Lifelong Dynamics of Human CD4+CD25+Regulatory T Cells: Insights from
in vivoData and Mathematical Modeling. Journal of Theoretical Biology266(2010) 307–322
12. Thornton, A.M., Korty, P.E., Tran, D.Q., Wohlfert, E.A., Murray, P.E., Belkaid, Y., Shevach, E.M.: Expression of Helios, an Ikaros Transcription Factor Family Member, Differentiates Thymic-Derived from Peripherally Induced Foxp3+ T Regulatory Cells. The Journal of Immunology184(2010) 3433–3441
13. Ziegler, S.F., Buckner, J.H.: Foxp3 and the Regulation of Treg/Th17 Differentiation.