University of Warwick institutional repository: http://go.warwick.ac.uk/wrap
This paper is made available online in accordance with
publisher policies. Please scroll down to view the document
itself. Please refer to the repository record for this item and our
policy information available from the repository home page for
further information.
To see the final version of this paper please visit the publisher’s website.
Access to the published version may require a subscription.
Author(s): P. A. Cameron, M. J. Schull and M. W. Cooke
Article Title: A framework for measuring quality in the emergency
department
Year of publication: 2011
Link to published article:
http://dx.doi.org/10.1136/emj.2011.112250
Publisher statement: Cameron, P. A., Schull, M. J. and Cooke, M. W.
(2011). A framework for measuring quality in the emergency
A Framework for Measuring Quality in the ED
P Cameron1, MJ Schull2, MW Cooke3
1.
2. Senior Scientist, Institute for Clinical Evaluative Sciences, Associate Professor, Department of Medicine, University of Toronto
3. Professor of Emergency Medicine, Warwick Medical School and Heart of England NHS Foundation Trust Background
There is increasing concern that medical care is of variable quality, with variable outcomes, safety, costs and experience for patients (1). Despite substantial efforts to improve patient safety, some studies suggest little evidence of reductions in adverse events (2). Furthermore, there is little agreement about what outcomes are expected and whether increased expenditure results in a real improvement in outcome or experience. In emergency medicine, many countries have developed specific indicators to help drive improvements to patient care (3,4,5). Most of these are time based and there is little consensus regarding which indicators are high priority and what an appropriate framework for measuring quality should look like.
Emergency medicine is different to many specialties in that presentations are symptom based, a confirmed diagnosis may not be made during the clinical encounter, and clinical follow-up in the ED is uncommon, making benchmarking of processes and outcomes related to specific diagnoses difficult. Hard clinical outcomes such as risk-adjusted mortality are usually remote from the specific interventions in the Emergency Department (ED). Additionally, the spectrum of illnesses and injuries presenting to EDs is vast, potentially necessitating a large number of indicators to measure quality across a representative range of presentations. Although indicators for emergency care should focus on the part of the healthcare system that emergency clinicians can influence, it is important that indicators relate to the final outcome of a patient encounter with the health sector and that they promote integration along the emergency care pathway. For example, a patient with an AMI arriving at hospital and swiftly getting to the angiography suite within 30 minutes is not optimal if the system is not set up to manage the next step, of a trained cardiologist performing an angioplasty immediately. All steps being aligned in the clinical process would be reflected by survival rates
There is some imperative for the emergency community to articulate what parameters should be used to measure quality emergency care as governments, healthcare purchasers and administrators continue to define the field.
Considerable work has been undertaken already in countries such as the UK, Canada and the USA (4,6,7) however it is not clear which indicators should be selected and how to integrate these indicators into a comprehensive framework for monitoring and improving quality in the ED.
In this article we aim to present key elements of a framework for ED physicians to develop a quality measurement program that will drive improvements and enable their ED to perform at a high level from the perspective of practicing emergency physicians and leaders in EM administration and research.
Important considerations
The reason for collecting, monitoring and analysing quality measures, varies according to perspective. A patient, clinician, administrator or policy maker will have different perspectives on what should be measured and what measures should be the highest priority, partly because they are using the measures for different purposes. Each of these entities may vary their views over time,
depending on evolving evidence (e.g. use of TPA in stroke), new practice patterns (eg conscious sedation for ED procedures), public pressure (eg dissatisfaction with long ED wait times), or changing health system circumstances (eg reduced in-patient capacity and emphasis on out-patient care delivery). All would agree that they would ideally like to be treated in (or work in, administer or be responsible for) an ED that delivered high quality care consistently to all patients. A purchaser or policy maker may want public accountability or a measurement framework for “pay for performance” whereas clinicians will usually want data to drive improvements in medical care or demonstrate the treatment outcomes and clinical safety of their/their department’s care and a patient may focus on patient centredness (assuming high quality care) .
An organization should not regard measurement and attainment of goals set using quality indicators as the main focus. Indicators should be a vehicle to drive change and improve the performance of the organisation. For example setting a 4 hour target for ED patients could be a good way to speed processes within the ED and push the hospital as a whole to enable emergency patients to get to the wards more quickly, avoiding access block and overcrowding in the ED. If the ED overcrowding problem is fixed by all patients meeting the target, but patients are just shifted to the ward to meet the target without improvements in underlying clinical processes, the outcome as measured by the indicator would be good, but the actual quality delivered would be bad. Indicators are just that, their purpose is to “indicate”, and taken in isolation, often may not represent a patient outcome !
Developing a culture of safety and quality and an agreed goal of becoming a “high performing” organization, go beyond a few simple measurements that sample the characteristics of a complex organisation. Unfortunately, one of the perverse aspects of measuring performance indicators, is that organizations often become fixed on the indicator metrics rather than the primary purpose, which is to improve overall healthcare outcomes, and may result in missed opportunities or complacency with regard to improving care in non-target areas.
EDs and hospitals aspire to a goal of consistent improvement in outcomes of serious illness (such as death and complications) over time – this is a long term goal. However in response to new evidence or specific local issues, an institution may wish to rapidly change a process over weeks and may wish to use a clinical process indicator to do this. The methodology used to collect and analyse data, in both circumstances will vary. Risk adjustment and credibility of data will be essential in the first example and timeliness and immediacy of data will be the priority in the second example. Carefully collected and analysed risk adjusted outcomes take years to determine statistically significant trends, whereas action may be required more urgently when obviously poor practice is occurring.
The feasibility of collecting data is always a limitation of measuring quality outcomes. Many institutions have primitive information systems, that are difficult to link with other data systems, and are often derived from poor quality primary data elements in the first place. The resources required to collect high quality data are often significant and should usually be targeted at high priority areas (8). Unfortunately political and administrative pressures force the collection of data that is most available, rather than data that is most valid. It is common for administrators to confuse the size of data repositories with the quality and usefulness of the data repository. This is most evident with hospital discharge data, where data is usually collected for funding purposes, often poorly audited (from a clinical perspective) and is used without adequate risk
adjustment, to compare outcomes and processes between institutions. Data items and definitions are often not standard across jurisdictions, further complicating comparisons. A common justification for using data that is known to be of poor quality is that coding will improve with increased usage, but this also increases the data burden for institutions, may misdirect resources, may unnecessarily slur the reputation of a high performing unit and will reduce clinician engagement. This situation will improve if systems are developed that accurately record live data rather than cleaning data post hoc .
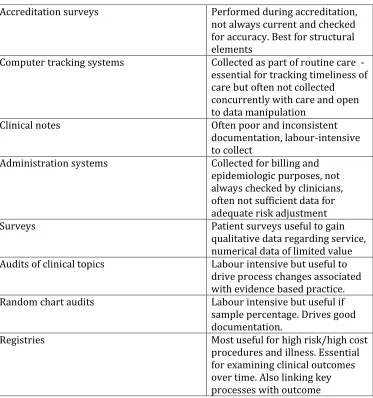
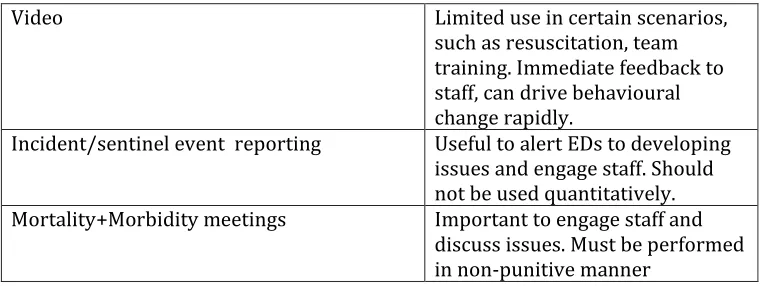
There are many possible data sources, a list of commonly used data sources is shown in Table 1 with major advantages and disadvantages
It is clear that for indicators to drive change at a clinical level, they must be credible, feasible to collect routinely, based on evidence and in general should undergo a validation process. The validation process should involve actually using the indicator over a period of time, checking that it measures what it is supposed to measure, observing the process to check that it reflects reality and that it drives clinical processes in the expected direction without causing negative consequences. Few of the standard indicators used in Emergency medicine have been developed in this way. There are a few areas in emergency care, where there are good measures, based on strong evidence – such as myocardial ischaemia and sepsis.
It is important to differentiate quality indicators from quality “standards”. Indicators are used to drive improvement, standards are in place to ensure a minimum acceptable level of care. In a particular jurisdiction standards might include prescriptions around triage (eg all pts must be triaged within 5 minutes of arrival), length of stay (must never exceed 24 hours) and access to certain services (24 hour on site intensive care service). In contrast to standards, Indicators will not have set levels of performance as the intention is to aim for continuous improvement and should not be limited by a single threshold.
Data without observation and interpretation is dangerous. An extreme example might be the death rate from emergency admissions in a hospital that specializes in palliative care. The death rate mostly reflects the type of work rather than the quality of work – publishing raw data without seeking explanation for
differences through both quantitative statistical methods and qualitative observational methods will result in misleading interpretation. For indicators, this often means the need for adjustment based on case-mix, case severity and/or comorbidities, which can be difficult and time consuming to carry-out. Some indicators may not provide meaningful data unless this can be
accomplished.
Types of Indicators
Structure
To enable high quality care, it is essential to have a good physical facility, qualified staff in appropriate ratios and an organizational structure that encourages good governance. Although arguments exist as to the detail of the structure required, there is general agreement about the elements required for optimal emergency care. Most administrators would prefer to discuss “outputs” rather than “inputs”, however without basic building blocks, it is hard to provide high quality care. In most jurisdictions, assessment of structural indicators is formalized by some form of accreditation body. An important “structure” within each ED is a formally constituted Quality group with clear delegation, roles and reporting.
Process
Measuring process indicators or elements of the patient journey as they happen is appealing to both clinicians and administrators. The immediacy of feedback and direct effect that a clinician can have on these indicators helps engage clinical staff. Unfortunately, most processes do not relate to outcomes and some may even create adverse impacts if enforced. For example, there is strong evidence that receiving aspirin reduces the risk in cardiac ischaemia (9), so measurement of percentage of patients receiving this medication after
where a diagnosis of ischemia was not suspected might suggest much better compliance with recommended care. Alternatively, an indicator using the
percentage of patients receiving steroids after presenting with allergies, does not have good evidence relating to outcome and may distort clinical practice, with excess prescribing. Process indicators are particularly useful in driving new methods for managing certain conditions and when there is clear evidence that they positively influence outcomes. They may be safer if each measure is associated with a counter measure to detect perverse actions e.g. septic patients given antibiotics within one hour balanced by patients only receiving one dose to detect inappropriate early antibiotics.
Outcome
Measuring outcomes over time is essential in any high performing organization. Because outcomes are often distant to direct clinical intervention, especially in the ED, outcomes are often not collected routinely as part of ED indicator suites. Emergency clinicians must see themselves as part of an emergency system that delivers care across a whole patient journey. Whatever impact the ED part of the emergency episode of care may have should be positive and improve over time. Mortality from an inpatient episode of care may not be directly related to a short time spent in the ED. However changes to processes, such as trauma reception teams or bypass of ED to deliver patients with a STEMI (ST elevation myocardial infarct) to the catheter laboratory directly, should result in improved outcomes over time. A key challenge of outcome measurement is attribution: if AMI mortality at a hospital is poor or getting worse over time, who is responsible? Is it due to changing case-mix, things being done/not done in the ED, on the
cardiology ward, medications not being prescribed at discharge or other factors? Process measures are required to “explain” outcome measures, and even then the full answer may not be clear.
Domains of quality
There are many constructs for looking at the dimensions of quality (10,11). The most commonly used domains are listed in Table 2. It is important to try to achieve balance in the indicators chosen so that each dimension is captured and that staff and administration do not focus on one to the exclusion of others. However, some dimensions such as timeliness tend to be over-represented in existing evidence-based indicators, making perfect balance very difficult to achieve. This has been most evident in countries such as the UK, Australia and Canada where the predominant focus has been on time based process
measurements.
A measurement framework
Using the previous discussion and indicators already available, a possible approach would include the following measurements.
Safety Culture surveys – It is useful to assess attitudes of staff to patient safety by survey, this also makes staff question their own role, although evidence is currently limited(12). Attitudes to safety also reflect attitudes to improvement. Surveys are a useful technique to drive attitudes at a local level, particularly by promoting discussion and debate. There is debate about their effectiveness for benchmarking or measuring improvement
Morbidity and Mortality review – There is little evidence that qualitative methodologies such as mortality reviews and use of techniques such as Root Cause Analysis for “sentinel events” make a difference to practice and outcomes. There is also evidence that they can be used poorly to “persecute “individuals and ignore systems factors. However there is good evidence that mortality reviews in particular, engage clinicians in the process (13). Morbidity and mortality reviews can be seen as a structural indicator, in the sense that an organization either undertakes this activity or not and undertakes it in a constructive manner or not.
Incident reports – Reporting of incidents is an important method to engage staff in thinking about safer clinical practice and alerting the unit to issues that require improvement. By the very nature of the reporting process, requiring voluntary identification of problems, there is an inherent bias in the number, source and types of reports. The data should be viewed as qualitative and should not be used quantitatively, especially given under-reporting of events and the fact that such systems tend to be used primarily by nurses and much less frequently by doctors, thus biasing the types of events captured.
Readmissions/Reattendance – can be used qualitatively, to identify why readmissions are happening and quantitatively. This is usually collected from administrative data and commonly is difficult to interpret because of
inconsistent coding of planned versus unplanned, whether the re-attendance was related to the previous attendance, definitions and lack of agreement of what optimal rates are but evidence suggest that misdiagnosis, incorrect
treatment or advice are common causes. This becomes even more difficult when comparisons are made between jurisdictions and internationally. Very high unscheduled readmission rates for emergency patients suggest that ED discharge planning is suboptimal. A zero readmission rate would suggest that patients are being admitted unnecessarily to the ward on first attendance or data coding issues. Reattendance does not measure patients who are sent home and die or those who attend another hospital. Linkage of data is potentially useful, but not well developed in most jurisdictions.
An important aspect of safety for patients who are readmitted is that they have been given correct discharge advice so that they were readmitted safely, and this can be difficult or impossible to determine from administrative data. Improved electronic records should enable more consistent collection of this data.
but also indicates other factors such as staff attitudes and patient confidence in the ED. High rates suggest that there are systemic problems with patient reception and triage, or excessive waiting times to be seen.
Complications of procedures – Generally, serious complications of procedures in the ED are uncommon and it is difficult to benchmark with adequate risk
adjustment over short timeframes (eg intubation/intercostal catheters). Exceptions to this include common procedures like IV cannula insertions and wound repair, but here complications are rare. Central line insertion infection rates are another indicator that can be identified, though rates of line insertion in the ED are relatively low. There is potential to audit some complications through clinical quality registries (eg trauma/cardiac) and also clinical audit through medical record review. Specific issues around an unexpected complication should be managed through morbidity and mortality reviews.
An important issue for the ED is that we may perform the procedure but not see the complication that occurs several days later in another unit or after discharge. One way around this is to develop a “create and detect” map that gets people to describe where the harm was created and feed it back to the relevant unit.
EDs should also perform routine audits of general processes that occur across all patients. These include handwashing, handover, discharge letters, medication prescribing and analgesia. There are many ways of performing these audits, including random checks, selecting a percentage of patients, and identifying certain time points. The important point is that staff know that these important processes are being audited on a routine basis.
Random chart audits – Are very time consuming but can be performed on a percentage of charts or using a focused approach looking for specific issues (during a departmental improvement program) such as documentation of pain score, or randomly to assess quality of chart completion, legibility etc
Global Trigger Tools (15) are being developed in other specialties to provide focused reproducible detection of known risks. They allow quantification of risk and harm that can be monitored over time. The diversity of cases and risks in the Emergency Department may make it difficult to use effectively. More extensive peer review processes can be used to enable more in depth discussion and debate about indicators; they may have an associated set of indicators to enable the reviewers to assess quality and to direct discussions (16).
Clinical audits of specific clinical domains –. It is important that these are explicit reviews with evidence based processes. Generally these should be rotated regularly and targeted at known “problem areas” or new processes to ensure compliance(17).
Effectiveness
adjusted outcomes, for high risk disease or treatment categories should be followed over time. Common registries for these patients include trauma, stroke, intensive care, cardiac arrest and AMI. Using these registries, the processes that relate to ED care can be followed and matched to final outcomes that are often remote from the ED. For example in trauma – an important process measure would be - time to theatre for an extra-axial bleed. Registries also give some insight into appropriateness of procedures (too many or too few) by enabling risk adjusted comparisons between units. Registries also allow tracking of optimal care across phases of care, from prehospital through ED to theatre, ICU and the ward. Tracking of important management issues such as optimal airway management and fluid resuscitation, is difficult without this type of approach.
Use of routinely collected discharge data can be used in isolation but there are inherent difficulties, as data is coded for funding and epidemiological purposes (not necessarily clinical outcomes) and often lacks key elements for risk adjustment. This can be enhanced with linkage to other data sets but in most parts of the world this is still primitive and slow. In Western Australia, for example, it is possible to link ED attendance with 30 day mortality and reattendance to hospital (18).
Patient centredness
Patient satisfaction and experience surveys are frequently performed but difficult to interpret. There is an important qualitative element – that is often ignored. Exploring issues raised by the patients is important. It is difficult to benchmark satisfaction surveys because of differences in patient casemix and culture between regions. However trends within an institution may be important.
An important issue is the differentiation of patient satisfaction versus patient experience. Satisfaction surveys are very open to design bias and answers often reflect the intent of the question rather than actual patient satisfaction or experience. Current commonly used patient satisfaction questions seem poorly suited to the ED setting (19). Experience surveys aim to explore what could be done better rather than how good the experience or interaction with the health service was. This is more labor-intensive as it requires free text and interviews to for analysis (20).
Surveys are an important way to find out what patients want. This can be used to prioritise quality improvement activity. For example, waiting times always come up as important to patients - therefore the ED should aim to keep waits short. Short waiting times may also be a useful indicator for other domains such as safety and efficiency. Other priorities such as staff communication, patient comfort and access to the ED may also be highlighted.
Efficiency
available. It is possible to generate simple measures such as patients seen per provider per hour, adjusted for casemix, however interpretation is needed to account for factors such as availability of support staff such as mid-level providers, teaching and supervision. There is little evidence to support various staffing models for nursing and allied health and given the team based nature of care in the ED, a whole of department staffing model should be developed. Various time measures are collected to assess the overall efficiency and patient flow through the ED. Waiting times (sometimes adjusted for triage category) and total time in the ED are most commonly collected. However if an ED is trying to understand the individual block points for patient flow within the ED then this can be broken up into component parts. It is important to investigate
contributing factors including time to see a nurse/ doctor, reach a cubicle, turn around times for investigations, decision to admit/discharge, and consult times.
More subtle interpretation is required for interpretation of appropriateness of care, which is a big component of efficiency. Unnecessary use of investigations, ward admissions and consults, may result in increased time in the ED and ultimately increased cost for no improvement in outcome. Registry data from trauma and cardiac registries can give some insight into rates of procedures for certain patient groups. Routinely collected admissions data may also be useful for examining admission and procedure rates. However for comparisons to be made between institutions it is important that comparisons are adequately casemix adjusted and outcomes are also compared. Audits using explicit chart reviews may also be helpful.
There is now a considerable amount of work that shows that ED function becomes inefficient (and unsafe) when there is overcrowding or access block and that this can be managed (21). This is often outside the control of the ED and must be factored into any assessment of efficiency related to timeliness.
Equity
In recent years there has been much greater focus on equity of care between racial groups, regions, illness types (such as mental illness), gender, age and so forth. Some general information such as waiting times, admission rates and complication rates may be accessible through routine datasets. However these should only be used as a screening tool as there are often many factors involved in poor access to services, including other patient characteristics that may or may not be measured. Registries may be an important source of data when looking at intervention rates, survival and complications for specific patient groups. As some disadvantaged patient groups may not even access services, it is important to use multiple methods to survey specific groups, being aware of cultural barriers.
Sustainability
and satisfaction. Other important markers include outcomes of education programs and the number of staff with necessary qualifications to fulfill their designated role.
Conclusion
A quality measurement framework will vary according to the priorities of an institution and the feasibility of collecting data using available resource. EDs should be careful to construct a framework that drives quality improvement and not regard the measures as an outcome in themselves. The goal is to embed a culture of improving safety and quality of care within the institution where indicators are used to promote debate and discussion on how to achieve the best quality of care and the best experience of the service for patients and carers. Most indicators are only useful at a local level and do not lend themselves to national benchmarking. However comparison between like institutions can facilitate learning that helps drive quality improvements. Certain national standards of care are essential to ensure equity of access and minimum levels of care and should be incorporated into a quality framework.
In developing this work internationally, we would hope that there may be consensus regarding common indicators, data definitions and a vision of what high quality emergency care looks like.
References
1. The NHS Atlas of Variation in Healthcare Reducing unwarranted variation to increase value and improve quality. 2010.
http://www.rightcare.nhs.uk/atlas/
2. CP. Landrigan, GJ. Parry, CB. Bones, AD. Hackbarth, DA. Goldmann, PJ. Sharek, Temporal Trends in Rates of Patient Harm Resulting from Medical Care. N Engl J Med 2010; 363:2124-2134
3. Australasian College for Emergency medicine. Policy Document Quality Management in Emergency Medicine.
http://www.acem.org.au/media/policies_and_guidelines/quality.pdf
4. Canadian Association of Emergency Physicians - Development of a Consensus on Evidence-Based Quality of Care Indicators for Canadian Emergency Departments.
http://www.caep.ca/template.asp?id=4DCA2D0014A4408FACB06DC 5CC0E81D3#qualityindicator
5. The NHS Plan. Department of Health.
http://www.dh.gov.uk/prod_consum_dh/groups/dh_digitalassets/@ dh/@en/@ps/documents/digitalasset/dh_118522.pdf
6. E Beattie, K Mackway-Jones A Delphi study to identify performance indicators for emergency medicine. Emerg Med J 2004;21:47-50
http://emj.bmj.com/content/21/1/47.full
7. Emergency Department Performance Measures and Benchmarking Summit: The Consensus Statement.
http://www.qualityindicators.ahrq.gov/news/EDPerformanceMeasur es-ConsensusStatement.pdf
8. Evans SM, Scott, IA, Johnson NPCameron PAMcNeil JJ. Development of clinical quality registries in Australia - the way forward. MJA. 2010 (in press)
9. Aspirin in AMIISIS-2 (Second International Study of Infarct Survival) Collaborative Group. Randomised trial of intravenous streptokinase, oral aspirin, both, or neither among 1787 cases of suspected acute myocardial infarction: ISIS-2. Lancet 1988;ii:349-60.
10. Institute of Medicine (IOM). Crossing the Quality Chasm: A New Health System for the 21st Century. Washington, D.C: National Academy Press; 2001
11. Victorian Quality Council. A guide to using data for healthcare quality improvement . 2008
http://www.health.vic.gov.au/qualitycouncil/downloads/vqc_guide_t o_using_data.pdf
12. V F Nieva, J Sorra. Safety culture assessment: a tool for improving patient safety in healthcare organizations. Qual Saf Health Care 2003;12(Suppl II):ii17–ii23
http://www.ncbi.nlm.nih.gov/pmc/articles/PMC1765782/pdf/v012p 0ii17.pdf
13. JB Semmens, R J Aitken, F M Sanfilippo, S AMukhtar, NS Haynes and J A Mountain. The Western Australian Audit of Surgical Mortality:
advancing surgical accountability. MJA 2005; 183 (10): 504-508 14. Baker DW, Stevens CD, Brook RH. Patients who leave
a public hospital emergency department without being seen. JAMA. 1991; 266:1085–90.
15. Institute for Healthcare Improvement. IHI Global Trigger Tools for Measuring Adverse Events.2009.
http://www.ihi.org/NR/rdonlyres/B277159C-60D4-4EFD-BF2A-B9FB62CAAA4A/0/IHIGlobalTriggerToolWhitePaper2009.pdf%20 16. West midlands Quality review Service.2010. NHS. UK.
http://www.wmqi.westmidlands.nhs.uk/wmqrs/review-programmes/view/urgent-care
17. College of Emergency medicine (UK). Current Clinical Audits. 2010.
http://www.collemergencymed.ac.uk/Shop-Floor/Clinical%20Audit/Current%20Audits/
18. The association between hospital overcrowding and mortality among patients admitted via Western Australian emergency departments. Peter C Sprivulis, Julie-Ann Da Silva, Ian G Jacobs, Amanda R L Frazer and George A Jelinek. MJA 2006; 184 (5): 208-212
19. Schull MJ, Guttmann A, Leaver CA, Vermeulen MJ, Hatcher CM, Rowe BH, Zwarenstein M, Anderson GM. Prioritizing Performance
Measurement for Emergency Department Care: Consensus on
Evidence-Based Quality of Care Indicators. Can J Emerg Med. 2010. (in press)
20. C Taylor, J Bengar. Patient Satisfaction in Emergency medicine Emerg Med J 2004;21:528–
532.http://www.ncbi.nlm.nih.gov/pmc/articles/PMC1726409/pdf/v
21. Access block can be managed. P A Cameron, A P Joseph and S M McCarthy. MJA 2009; 190 (7): 364-36
TABLE 1
Methods of data collection
Commonly available data sources. A major impediment to developing a comprehensive framework for measuring quality is the lack of adequate data systems in EDs.
Accreditation surveys Performed during accreditation, not always current and checked for accuracy. Best for structural elements
Computer tracking systems Collected as part of routine care - essential for tracking timeliness of care but often not collected concurrently with care and open to data manipulation
Clinical notes Often poor and inconsistent documentation, labour-intensive to collect
Administration systems Collected for billing and epidemiologic purposes, not always checked by clinicians, often not sufficient data for adequate risk adjustment
Surveys Patient surveys useful to gain
qualitative data regarding service, numerical data of limited value Audits of clinical topics Labour intensive but useful to
drive process changes associated with evidence based practice. Random chart audits Labour intensive but useful if
sample percentage. Drives good documentation.
Video Limited use in certain scenarios, such as resuscitation, team training. Immediate feedback to staff, can drive behavioural change rapidly.
Incident/sentinel event reporting Useful to alert EDs to developing issues and engage staff. Should not be used quantitatively. Mortality+Morbidity meetings Important to engage staff and
[image:14.595.75.455.85.228.2]discuss issues. Must be performed in non-punitive manner
TABLE 2 Domains of Quality (10)
▪
Safe
.
▪
: Avoiding harm to patients from the care that is intended to
help them
▪
Effective
: ▪
Providing services based on scientific knowledge to all who
could benefit and refraining from providing services to
those not likely to benefit (avoiding underuse and misuse,
respectively).
▪
Patient
cente
red
:
▪
Providing care that is respectful of and responsive to individual
patient preferences, needs, and values and ensuring that
patient values guide all clinical decisions.
▪
Timely
:
▪
Reducing waits and sometimes harmful delays for both those
who receive and those who give care.
▪
Efficient
: ▪
Avoiding waste, including waste of equipment, supplies, ideas,
and energy.
Equitable
: Providing care that does not vary in quality because of personal
characteristics such as gender, ethnicity, geographic location,
and socioeconomic status.
Table 4 Commonly Used Terms
Benchmarking - is the process of comparing measures against other organizations or individuals
KPI(Key performance Indicator)-A jargon term that reflects key strategic
goals for any organization to measure success by achieving or sustaining repeated success at meeting particular operational targets.
Target – a desired level of performance
Health Outcome - is a measure of how a patient feels, functions, or survives
Standard - a measure that is used as a basis for judgment