Using the Hypothesis Scratchpad to scaffold
inquiry learning: A scaffold to improve
learning results?
Casper de Jong MSc. Thesis
June 2017
Faculty of Behavioral, Management and Social Sciences Instructional Technology University of Twente
P.O. Box 217 7500 AE Enschede The Netherlands
Supervisors:
Prof. dr. Ton de Jong MSc. Ellen Wassink - Kamp
Table of content
Preface 2
Abstract 3
Introduction 4
Method 11
Participants 11
Materials 12
Procedure 17
Coding and scoring procedure 17
Results 20
Sample characteristics 20
Test results 21
Discussion and conclusion 28
Preface
For starters, I would like to add a few personal lines. Overall, I can state that writing
this master thesis was an interesting but difficult journey. Working almost fulltime, having a
family and trying to complete a master thesis all simultaneously was challenging and
sometimes seemed to be impossible. I truly believe that without all the support I received I
would not have made it.
Therefore, my first words of thanks goes out to both my supervisor MSc. Ellen
Wassink – Kamp and prof. dr. Ton de Jong. Ellen was always prepared to offer a helping
hand and the door to her office was always open. The same goes for Ton, whose honest and
straight forward comments and feedback often put me back on the right track. In addition, I
would like to thank the researchers Tasos Hovardas and Mario Mäeots for the pleasant
cooperation during this study.
Every good study needs appropriate data and my colleagues of Canisius Tubbergen
offered me the opportunity to conduct this study during their classes, in which the appropriate
data could be obtained. Finally, I would like to give a special word of thanks to my family and
friends, especially my wife for all her support she gave me during the process of writing my
master thesis and Erwin van Harmelen for being that special classmate who always knew the
right solutions when I was searching for answers.
Casper de Jong
Abstract
Supporting students with the process of formulating testable hypotheses has been a
challenging task for decades. The hypothesis scratchpad (HS) is a software tool that has been
developed for this purpose. This HS supports students during the conceptualization phase of
an inquiry process by offering them domain related conditions, dependent variables and
independent variables that can be combined to formulate testable hypotheses. The most
effective level of support for the highest learning gains in inquiry learning has been a point of
discussion among researchers. To give an answer, this study compared the knowledge gain,
the gain in inquiry skills, and the testability and domain coverage of formulated hypotheses of
students between three configurations of the HS. The first configuration was a fully supported
HS that offered 15 words consisting of: three relations, two dependent variables, three
independent variables, two conjunctions, and five assisting words. The second configuration
was a partially supported HS that offered 11 words, consisting of: one conjunctions, two
relations, no dependent variables, three independent variables and five assisting words. The
third configuration was an unsupported HS that offered no words. All three configurations
offered the students the same structure to organize their hypotheses.
As a process measure we looked at the testability and the domain coverage of
formulated hypotheses for all students. We also examined if the offered amount of support in
a HS was of more added value for higher or lower achieving students on the testability and the
domain coverage of formulated hypotheses. In the present study, 179 Dutch secondary school
students with a mean age of 12.01 (SD = .37) took part. All participants were randomly
assigned to one of the three conditions.
Results showed a larger gain of conceptual knowledge for students who were
supported by a fully supported HS compared to students who were supported by a partially or
unsupported HS. Students who made use of a fully supported HS also formulated hypotheses
with a bigger domain coverage compared to students who used an unsupported or partially
supported HS. A comparison between higher and lower achieving students gave no
indications for a differential effect on the testability level and domain coverage of formulated
Introduction
In a world, which is in constant motion, where new technological discoveries and
inventions emerge rapidly, education should not be left behind. Schools and teachers are
eagerly bringing in all kinds of new devices to suit the needs of their students, and it is not
uncommon that the scientific foundation on whether to use these devices does not yet exists
when these devices are already in widespread use. Many teachers want to use new
technological developments in their curriculum and work innovatively but they also like to
have the insurance that the technologies they are using are of an added value. A question often
heard among teachers is: “Is this new product really of any added value for me or my students
or is it just a hype we have to follow because of various reasons?” (Ten Brummelhuis et al.,
2016).
For Science, Technology, Engineering, and Mathematics (STEM) teachers,
simulations and virtual laboratories are tools that can be used to enrich their lessons and
curriculum. These laboratories have proven themselves as being of added value for students
(Plass et al. 2012; Pyatt & Sims, 2012; Chang, Chen, Lin & Sung, 2008; Zacharia, Olympiou
& Papaevripidou, 2008; Wiesner & Lan, 2004). All these studies gave results indicating that
students who used a virtual laboratory outperformed students who only used physical
equipment. Additional to these results, three literature reviews by D’Angelo et al. (2014); De
Jong, Linn and Zacharia (2013) and Rutten, van Joolingen and van der Veen (2012) gave
more insights into the added value of virtual laboratories. These reviews concluded that when
simulations were used as an enhancement for traditional lectures they led to better learning
outcomes than traditional or physical methods alone.
The successes of virtual laboratories have been attributed to various factors like:
availability, low costs, low risks, options to record data, reliability of the data students
obtained from these virtual laboratories, and the given that there is less ground for making
errors when interpreting the obtained data (Garc et al. 2015; Nedic, Machotka & Nafalski,
2003). For instance, when students have to learn the meaning of density, their teacher can use
a virtual laboratory about buoyancy to support the learning process. The use of a virtual
buoyancy laboratory has advantages. First, it can reduce the teachers’ preparation time
because there is no need for setting up the physical experiment. Second, the experiment will
always be available when computers are present. Third, it will reduce the room for
measurement errors. For example, when students want to keep an object floating in the middle
than a faulty outcome is not unusual. In a virtual laboratory the settings can be exactly right,
errors are ruled out, and experiments with equal settings will always provide the same
outcome (De Jong et al., 2013; Alexiou, Bouras & Giannaka, 2005).
The positive effects of virtual laboratories cannot be ignored. However, a core
question that remains is: “Why are these virtual laboratories not globally used as a recurrent
element by science teachers to enrich their classes and improve their students learning
outcomes?” Possible answers to the lack of use of virtual laboratories could be: a fear of the
unknown, nescience, being unaware of the advantages, fear of using, and not knowing where
to find them. In order to get more teachers to use online laboratories, it is necessary to remove
these barriers. Offering fast and easy access to virtual laboratories and offering a portal to
share information about laboratories and their use in practice was one of the possible
solutions. For these and many more reasons, in 2013 the Go-Lab project was launched.
Go-Lab is a website that offers an online portal and community for science teachers
from all over the world. On the Go-Lab website, teachers can find a large variety of online
laboratories and supportive scaffolds that can be used during science classes (De Jong et al.
2014). When a teacher selects a laboratory from the Go-Lab website, he or she can create his
or her own lessons, called Inquiry Learning Spaces (ILS). These ILSs are organized in inquiry
phases and can be supported by a variety of apps and educational resources (de Jong, 2013).
To provide students with the best opportunities to learn when working with online
laboratories, inquiry-based learning was chosen (De Jong et al., 2013). Inquiry-based learning
or in short inquiry learning is described as: “An approach to learning that involves a process
of exploring the natural or material world, and that leads to asking questions, making
discoveries, and rigorously testing those discoveries in the search for new understanding”
(National Science Foundation, 2000, p. 2).
The inquiry based learning in Go-Lab is organized in five inquiry phases that form an
inquiry cycle. Many variations of the inquiry cycle can be found in various sources as
described in the literature review by Pedaste et al. (2015). The Go-Lab inquiry cycle consists
of an orientation phase, a conceptualization phase, an investigation phase, a conclusion phase,
and a discussion phase. Previous research on the effectiveness of inquiry learning has shown
that sufficiently scaffolding during the phases of the inquiry-cycle leads to the most effective
learning (D’Angelo et al. 2014; Plass et al. 2012; Eysink, De Jong, Berthold, Kolloffel,
Opfermann & Wouters, 2009; Linn, Lee, Tinker, Husic & Chiu, 2006). Consequentially,
when appropriate scaffolds are not offered during the inquiry learning process, the students
experiments by trial and error without thinking about the experiment in advance), design
ineffective experiments, fail to make predictions, and make mistakes with the interpretation of
data (de Jong, 2006).
All five phases of the inquiry cycle in Go-Lab can be scaffold by a variety of
supportive scaffolds like a concept mapping tool, an experiment design tool, a conclusion tool
and many more. During the second phase of the inquiry cycle, the conceptualization phase,
the formulation of hypotheses is an important process. To create a correct idea of a
phenomenon by performing experiments, it is important that hypotheses formulated prior to
the experiment are testable (Pyatt & Sims, 2012; De Jong & Van Joolingen, 1998; Shute &
Glaser, 1990). When non-testable hypotheses are formulated, the learner will in all probability
not gain any useful data from the experiment and learning will most likely not occur (De Jong
& Van Joolingen, 1998). In short, being able to formulate testable and informative hypotheses
as part of the inquiry skills is an important premise for success further on in the inquiry cycle.
Clearly, only knowing that formulating testable hypotheses is important does not
improve the learning outcomes, students still find it hard to do this (Muukkonen, Lakkala, &
Hakkarainen, 2005; Njoo & De Jong, 1993). A legitimate question has been how students
could be supported during this process of formulating hypotheses. Various scaffolds have
been designed for this purpose. An example of how to support students in the process of
formulating hypotheses is firstly: the organization scaffold as used by Zydney (2005). This
scaffold helped students with organizing information by first, letting students break a problem
into smaller problems and second, by giving the students a research plan template in which
they had the possibility to interpret, connect, and organize information. The use of this
scaffold resulted into an increased understanding of the problem and had a positive effect on
the quality of the formulated hypothesis. A second example is the driving set of questions
offered to students prior to the process of formulating hypotheses as used by Chen and She
(2015). As these authors state: “A possible interpretation for the correctness and testability of
hypothesis is that a set of driving questions was provided for students to make predictions and
generate their arguments before formulating hypotheses in which they would employ both
inductive and deductive reasoning ability to connect their prior knowledge and provide a
possible causal mechanism and, therefore, activate and facilitate them to formulate a more
correct and workable hypothesis.” (Chen & She, 2015, p. 17). These questions made
predictions easier, generated more useful arguments and had a positive effect on the quality of
Joolingen and De Jong (1991). A scaffold that in short offers a framework in which students
can formulate their hypotheses.
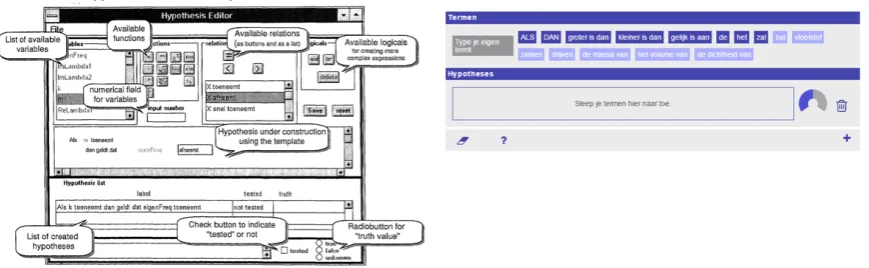
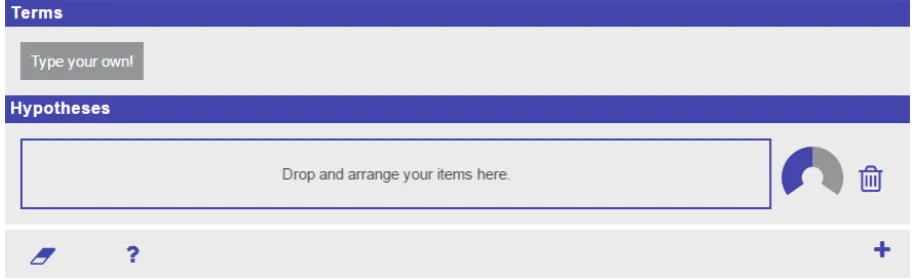
This last called scaffold, the HS, is a digital tool that was developed with the purpose
of supporting students withformulating testable hypotheses. The first version of the HS (Van
Joolingen & De Jong 1991) was described as: “A learner instrument that can support some or
all of the sub processes of forming hypotheses by offering the elements needed for hypotheses
(variables and relations) and by adding some structure to these elements.” (p. 392).
Development of this HS was inspired by three tools that helped students with stating good
hypotheses or predictions as used in earlier studies. First, the hypothesis menu, as used in the
economic simulation program Smithtown (Shute & Glaser, 1990). Second, the hypothesis
menu, as used in The Pathophysiology Tutor (PPT) environment developed by Michael,
Haque, Rovick, and Evens (1989). Third, the graphical hypothesis format, as used in the
VARILAB system developed by Hartley, Byard and Mallen (1991). Various parts of these
three tools were combined to create a tool that offered the users: support, structure, and the
possibility to adjust the formulated hypotheses during the process of formulating them.
In a study by Van Joolingen and De Jong (1991) the effectiveness of their first HS was
measured. During this study, participating students were randomly distributed over three
conditions. The first condition was a fully supported condition in which participants received
three tables with domain related conditions, variables and properties they could use to
formulate their hypotheses. The second condition was the partially supported condition in
which participants only received a table with variables to support them with the formulation
of hypotheses. This provided table with variables was equal to the table with variables as used
in fully supported condition. The third condition was an unsupported condition in which
participants did not receive any support in formulating testable hypotheses. Differences
between conditions were found for the participants in the fully supported condition who used
a larger number of variables and formulated more hypotheses before the actual experiment
was carried out compared to participants in the other two conditions, although in total they
formulated less hypotheses. A difference between condition in favor of less support can be
found in the outcome that students who worked with the fully supported HS chose more often
for very global relations between variables. A finding that was in contrast to participants who
worked with the unstructured or partially structured HS. Among others but mostly because of
the structure the HS offers to students, it has been used as a scaffold in various educational
Jong, Van Joolingen, Scott, De Hoog, Lapied, & Valent, 1994) and SimQuest (De Jong &
Van Joolingen 1998).
Within the past decades, the visual design of the HS went through a variety of bigger
and smaller transformations. This was in most cases done to improve the technical
functionality of the HS, keep it suitable for the latest computer systems and fit the design
demands of more modern times (see Figure 1). The appearance of the HS during the past
decades showed many changes while the underlying principle remained largely unchanged.
The underlying principle of the HS as used in the present study is up to now based on the
same principles and definitions as the 1991 version by Van Joolingen and De Jong. The HS is
still a tool that helps students with the formulation of testable hypotheses based on three sub
processes: First the identification of variables. Second, the selection of variables. Third,
[image:9.595.98.533.336.470.2]defining the hypothesized relation between the selected variables.
Figure 1. Visual comparison of two fully supported Hypothesis Scratchpads: 1995
Hypothesis Scratchpad compared to the 2015 Hypothesis Scratchpad.
Most findings in favor of the HS were made when the HS was part of a series of
scaffolds. For example, the research by Manlove, Lazonder and De Jong (2007) showed
results in favor of students who worked with a package of scaffolds including a HS. However,
it is hard to identify which of the scaffolds had what effect and research on this domain is still
scarce. Although using the HS as part of a series of scaffolds has led to higher learning gains
in the past, still little is known about whether these gains can be accredited solely to the use of
a HS.
Besides the effectiveness of the HS solely, the question about what the most effective
amount of provided support within the HS is, also remains unanswered. There is quite some
disagreement among researchers about what might be the most effective amount of support or
may produce very good performance during practice, but too much guidance may impair later
performance.” (Bernstein, Penner, Clarke-Stewart, Roy & Wickens, 2003, p. 221). When
looking at research by Kirschner, Sweller and Clark, (2006) and Mayer (2004) it can be
suggested that unguided or less guided learning is an ineffective way of learning. Kirschner et
al. (2006) state that unguided and partly guided inquiry approaches lead to lesser learning
gains. When following this theory about learning it could be assumed that students would
most likely benefit the most from a fully supported HS when it comes to adding knowledge.
On the contrary, many of the statements made by Kirschner et al. (2006) are more or less
contradicted by Hmelo-Silver, Duncan and Chinn, (2007) who made as one of their most
important statements that the focus should not lie on the question “Does inquiry learning
work?” but that it should lie on the questions “Under which circumstances does inquiry
learning work?” and “what kinds of support and scaffolding are needed for different
populations and learning goals.” (p. 105). The present study focusses on the three parts of this
last question. First, what amount of support given in the HS leads to the highest learning gain
and/ or gain of inquiry skills? Second, is the HS more effective for gaining knowledge or
gaining inquiry skills? Last, does the use of the HS have a different effect for higher or lower
achieving students? For inquiry learning one of the goals beside gaining knowledge is
improving the students’ inquiry skills, skills that might improve the most when guidance and
support are at a low level. One point where Hmelo-Silver, et al (2007) and Kirschner et al.
(2006) both agree, is that for getting the most learning gains, offering no support is not
preferable.
During a study by Mulder, Bollen, de Jong and Lazonder (2016) students received a
scaffold they could use to create executable computer models in an inquiry based learning
environment. For this study, the participants were divided over three conditions whereby, the
first condition received a partial model that outlined the basic structure. The second condition
received the same model but also received a set of variables they could use to complete the
model. The third condition received no support. Learning gains among conditions were
compared and results showed that the condition with the highest amount of support yields the
best results. The question concerning the most effective level of support when focusing on the
learning gains, seems to be in favor of more support. But the question: what level of support
leads to the highest inquiry skills gain, remains unanswered.
When a teacher wants to have the highest learning gains, it seems advisable to provide
the students with the highest level of support in the HS and thus, provide them with as many
other hand, providing the students with too much information might leave no room for the
them to address their own inquiry skills. During the present study it was therefore, expected
that students who received the most support in their HS would have gained the most
knowledge and the least inquiry skills. Students who received only partial support in their HS
were expected to have had enough support to formulate a testable hypothesis but still needed
to discover some parts on their own. Expectations were that this resulted in an average
knowledge gain and an average inquiry skills gain. For the students who were given no
support during the process of formulating hypotheses it was expected that these students had
the least knowledge gain but had the most inquiry skills gain.
Results of previous studies on the effectiveness of supportive scaffolds in an inquiry
based learning environment, indicated that sometimes the higher achieving students benefit
from the supportive scaffolds as on other times the lower achieving students do. During a
study by Manlove et al. (2007) in which dyads of students worked with a regulative support
tool called the Process Coordinator, higher achieving dyads used the supportive scaffold less
times because they found it conflicting with their own regulative strategies, while on the other
hand lower achieving dyads have been overwhelmed by the comprehensive support the
scaffold supplied. An earlier study about the effectiveness of a heuristic scaffold in a scientific
discovery learning environment showed that offering this scaffold might be especially
beneficial for lower achieving students (Veermans, Joolingen & De Jong, 2006). A literature
review by Manlove et al. (2009) gave no decisive answer on the question if higher or lower
achieving students benefit more from supportive scaffolds. In this last called literature review,
expectations are made that there might be a relation between prior experience and knowledge,
and the effectiveness of supportive scaffolds.
Overall, the present study focuses on giving an answer to which extend the amount of
support provided by the HS leads to more or less knowledge gain as well as the gain of
inquiry skills. Furthermore, the present study examined if the HS in its present form is of
added value as a scaffold during an inquiry based learning process. This resulted in the
following research question: How can we improve learning gains and inquiry skills gain of
students by making use of a HS to help them in the process of formulating testable
hypotheses? Based on this research question, four hypotheses were formulated.
The first hypothesis provided information about the gain in inquiry skills between
students who were supported by the fully supported HS and those who were supported by the
partially or an unsupported HS. The first hypothesis stated: Students who are supported by a
significantly less, compared to students who are supported by a partially supported or an
unsupported HS.
The second hypothesis tried to find an answer on whether the fully supported HS
could contribute to higher learning gains. This second hypothesis stated: Students who are
supported by a fully supported HS will gain significantly more knowledge compared to
students who are supported by a partially supported or an unsupported HS.
The focus of the third hypothesis was on the learning processes and whether the
testability of the formulated hypotheses was significantly higher for students who were
supported by the fully supported HS compared to students who were supported by the
partially supported or unsupported HS. The third hypothesis stated: Students who are
supported by a fully supported HS formulate significantly more testable hypotheses than
students who are supported by a partially or an unsupported HS.
The fourth hypothesis focused on whether the domain coverage of the formulated
hypotheses was significantly higher for students who were supported by the fully supported
HS compared to students who were supported by the partially supported or unsupported HS.
The fourth hypothesis stated: Students who are supported by a fully supported HS formulate
hypotheses with a significantly higher domain coverage compared to students who are
supported by a partially or an unsupported HS.
Method
Participants
One-hundred-seventy-nine first year students from a single school for secondary
education participated in this study. This sample consisted of 100 boys and 79 girls with a
mean age of 12.01 (SD = .37). The study was conducted in seven different classes. The first
three classes consisted of 71 lower vocational (VMBO) students. The fourth class consisted of
30 senior general secondary (HAVO) students. The last three classes consisted of 78
pre-university (VWO) students. In each class, students were randomly assigned to one of the three
conditions. Condition One, the fully supported HS condition, consisted of 60 students, 34
boys and 26 girls with a mean age of 11.97 (SD = .41). Condition Two, the partly supported
HS condition, consisted of 60 students, 34 boys and 26 girls with a mean age of 12.03 (SD =
.32). Condition Three, the unsupported HS condition, consisted of 59 students, 32 boys and 27
Materials
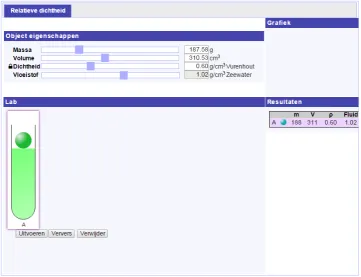
Virtual Laboratory: Splash. The virtual laboratory used in this study is a simplified
version of the Splash laboratory as could be found on the Go-Lab website. In this virtual
laboratory, participants could perform experiments in the domain of buoyancy. The
importance of this subject in secondary school education, and the challenging task of
understanding that both mass and volume denote density (Hardy, Jonen, Möller & Stern,
2006), made buoyancy a suitable domain for testing the effectiveness of the HS. The
buoyancy experiment itself involved a spherical object that could be dropped in a tube filled
with a liquid. For these experiments, the participants could adjust the mass, volume, and
density of the spherical object with a slider or manually by numbers. They could also adjust
the density of the fluid in the tube; this value could only been set with a slider. When the
density of the spherical object and/or the fluid were adjusted, the color of the spherical object
or the fluid changed. The virtual laboratory also showed what solid or liquid was related to
this specific density. When participants for example set the density of the spherical object
exactly to 2.70 gram per cubic centimeter, the virtual laboratory showed that aluminum has
that density. The density of the spherical object could be set to all numbers between .10 and
5.00 gram per cubic centimeter. The density of the fluid could only be set to 6 values with a
name corresponding to a liquid with that density. These liquids were: Acetone with a density
of .79, olive oil with a density of .92, water with a density of 1.00, saltwater with a density of
1.02, glycerin with a density of 1.26, and chlorine with a density of 1.49. The sliders for the
mass and volume of the spherical object as well as the sliders for the mass and density of the
spherical object were linked to each other. For example, when the slider for the mass of the
spherical object was moved, then the slider for volume responded and vice versa. This setting
prevented the possibility of creating impossible configurations. When the participants had set
the sliders, the experiment could be performed. Then the participants observed whether the
spherical object sunk, floated or sunk halfway down and then continue to float in the middle
An overview of this virtual laboratory can be seen in Figure 2. When a student performed
these experiments multiple times, they were able to discover the relationships between the
Figure 2. Virtual Laboratory: Splash.
Hypothesis Scratchpad (HS). Three different configurations of the HS were used, one
for every condition. The first configuration as can be seen in Figure 3 was the fully supported
HS. This HS consisted of 15 predefined blocks with words, containing two conjunctions: “IF”
and “THEN”, three relations: “is bigger than”, “is smaller than” and “is equal to”, two
dependent variables: “sink” and “float”, three independent variables: “the mass off”, “the
volume off” and “the density off”, and five assisting words: “the”, “it”, “will”, “ball” and
“fluid”. All these words were provided to the participants in Dutch. The participants could
drag these blocks into a box called the hypothesis box. They also had the option to add their
own words or sentences and to state the level of trust they had in the hypothesis with a
horseshoe-like confidence meter. The second configuration as can be seen in Figure 4 was the
partially supported HS. This HS consisted of 11 predefined blocks with words the participants
could drag into hypothesis box. In contrast to the fully supported HS, this partially supported
HS did not include the relation “is equal to”, both the dependent variables “sink” and “float”,
and the conjunction “IF”. Similar to the fully supported HS, participants could also add their
own words or sentences and also had access to the confidence meter. The unsupported HS as
the participants the option to come up with their own terms, formulate their own hypotheses,
[image:15.595.92.546.113.265.2]and use the confidence meter to state their level of trust in the formulated hypothesis.
[image:15.595.92.544.317.469.2]Figure 3. Fully supported Hypothesis Scratchpad.
Figure 4. Partially supported Hypothesis Scratchpad.
Figure 5. Unsupported Hypothesis Scratchpad.
Inquiry Learning Spaces (ILS). The ILS used during this study, was a complete online
lesson that was based on the inquiry learning cycle as provided by Pedaste et al. (2015). In the
[image:15.595.90.548.519.659.2]three different conditions all worked with a similar version of the ILS, with only a difference
in the amount of support offered by the HS. The main subject of the used ILS was buoyancy
and it consisted of five phases, starting with the orientation phase. In this first phase, general
information about the subject of buoyancy was given in the form of an instructional video.
The second phase was the conceptualization phase. In this phase, the participants first had to
watch an instructional video. This video gave a short introduction about the virtual laboratory
(Splash) and how the participants could work with this laboratory. During this video, no clues
were given about any outcomes of experiments. The second video instructed the participants
on how they had to use the HS. Each participant only saw the video corresponding to his or
her condition. After watching these instructional videos, participants had to formulate at least
two hypotheses in the domain of buoyancy. The formulated hypotheses were automatically
saved and stored. After the formulation of the hypotheses the participants continued to the
third phase of the ILS which was the investigation phase. In this phase, the participants had to
work with the virtual laboratory (Splash). In this virtual laboratory, the formulated hypotheses
had to be tested. Participant could write down all observations, thoughts and ideas in a digital
tool called the observation tool and these observations were automatically saved. During the
conclusion phase, which was the fourth phase of the ILS, the participants could retrieve their
formulated hypotheses and observations. Based on their observations and the results of their
experiments, participants could write down their conclusions about the hypotheses and they
could change the level of trust they had in their hypotheses by adjusting the confidence meter.
After formulating their conclusions, the participants continued to the last and fifth phase, the
discussion phase. In this phase participants had to reflect on their learning. The first question
they had to answer was: “Did your level of trust in the hypothesis change?”. If the participants
answered “Yes” they had to explain which experiments and or observations changed their
level of trust in the hypothesis. If the participants answered “No” they had to explain why
their level of trust remained the same. The second and final question was an informative
question about what the participants thought was the most difficult phase of the ILS.
Inquiry skills test. To assess the inquiry skills of the participants before and after the
learning session, a multiple-choice test was used. This test was an adapted version of the Test
of Integrated Science Process Skills (TIPS) developed by Dillashaw and Okey (1980) and the
Test of Integrated Science Process Skills II (TIPSII) developed by Burns, Okey and Wise
12 year old, and α = .78 for their version of the test used for students with ages 13 to 14 year
old. The adapted inquiry skills test constructed for the present study consisted of twenty-one
multiple-choice questions measuring a total score and two constructs. Twelve questions
measured the construct “identifying variables” and nine questions measured the construct of
“stating hypotheses”. All twenty-one questions were translated with the greatest accuracy to
Dutch and underlying constructs were kept intact as best as possible. The post-test contained
the same questions as the pre-test. The only difference was that by shuffling the questions, for
the post-test, a second version was created to minimalize cheating. Questions that belong
together, e.g. questions about the same subject, were kept together in the same order. The test
was conducted using a digital testing tool that was familiar to the participants. Despite all
efforts to translate the questions very carefully, while trying to keep the language as simple as possible, the test reliability for the test used in this study was low with α = .38 for the pre-test and α = .49 for the post-test.
Knowledge test. For all participants, a knowledge test in the domain of buoyancy
consisting of 4 questions was administered. This test is an adapted version of the test as used
in the second chapter of the D8.3 first trial report (Tasiopoulou & De Jong, 2015). The first
question of this knowledge test, was an open-ended question to see if the participants knew
the definition of density. The second and third questions were both multiple choice questions.
These questions checked whether or not the participant was able to determine the correct
order of multiple immiscible fluids in a tube with a different density level, e.g. oil floats on
water because the density of oil is smaller than the density of the water. The final question
tested if the participant could determine in which tube or tubes, from a series of four tubes
with different density levels, a ball with a given density would sink.
Transfer test. To test whether or not the skills for formulating testable hypotheses led
to transfer of the skill, participants had to formulate four final hypotheses. A digital learning
space similar in appearance to the ILS as used during the main phase of this study was used.
This digital learning space contained two pages that both offered a short introduction story, a
corresponding research question, and a fully supported HS. The first research question aimed
to measure far transfer, was a question about why children tend to play outside more often
when the sun is shining. The second research question, aimed to measure nearby transfer, was
a question about the reason why submarines can float or sink. For each research question,
participants had to formulate two hypotheses in order to provide data to answer the research
Procedure
This study was performed in three lessons of 50 minutes. During the first lesson the
entry level of the participants was assessed with the knowledge test and the inquiry skills test.
At the end of the first lesson, after all the participants finished their tests, the experiment
leader gave a quick overview of the ILS which would be used during the second lesson.
During the second lesson, all participants started working individually with the ILS. The
participants started with the orientation phase, followed up by the conceptualization phase in
which they had to formulate two hypotheses with their configuration of the HS. After
finishing the conceptualization phase, participants continued to the experimentation phase,
wherein they had to test their hypotheses about buoyancy in the virtual laboratory (Splash).
After working with first three stages the participants had time to fill in their conclusions
during the conclusion phase, and discuss their findings during the discussion phase. While
working with the ILS, participants were only allowed to ask their teacher or experiment leader
technical questions, domain or inquiry skills related questions were therefore not answered.
All participants managed to finished all the assignments in the ILS within the given time of 50
minutes. During the third lesson of this study, participants made the inquiry skills post-test
and knowledge post-test. In addition, they had to formulate four hypotheses during the
transfer test.
Coding and scoring procedure
Inquiry skills test. This test consisted of 21 items, measuring two different constructs
whereby all questions were scored with one point for a true answer and zero points for a false
answer. Despite multiple checkups, question seven that was part of the construct “identifying
variables” had to be removed from the test due to an unexpected error in the digital testing
program. This error resulted in participants only seeing an incomplete question. Therefore, 20
questions remained, 11 questions measuring the construct of “identifying variables” and 9
questions measuring the construct of “stating hypotheses”. The scores for the overall test for
each participant were summed and divided by the total amount of questions. This resulted in a
proportion score between zero and one point for each participant. The same procedure was
carried out for both constructs. To determine if any gain of inquiry skills occurred, the pre-test
scores were subtracted from the post-test scores for each participant. Participants who did not
complete the post-test or the pre-test were excluded from the analysis because any gain could
condition (N = 59), partially supported condition (N = 59), and unsupported condition (N =
55) completed both the inquiry skills post-test and inquiry skills pre-test.
Knowledge test. Items of the knowledge test were scored by means of true or false.
Every correct answer was granted with one point and every false answer with zero points. For
the overall score, all the scored points were summed and divided by the total amount of
questions. This resulted in a proportion score between zero and one point for each participant.
Checking the items on both the pre-test and post-test and the corresponding scoring procedure
for all the participants was done by one rater. Twenty-three answers on open-ended questions
that were on the boundary of wrong or right could not been answered with full conviction by
means of the answering scheme and were also coded by a second rater. The scores given by
the second rater were equal to the first rater. To determine any gain in knowledge, the pre-test
proportion scores were subtracted from the post-test proportion scores for each participant.
This resulted in a new proportion score named: “knowledge gain”. Participants who did not
complete the post-test or the pre-test were excluded from the analysis because any gain could
not be measured (N = 26). A total of 153 participants distributed over the fully supported
condition (N = 55), partially supported condition (N = 53), and unsupported condition (N =
45) completed both the knowledge post-test and pre-test.
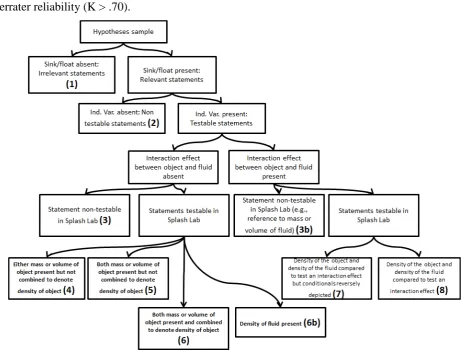
Testability of the formulated hypothesis. To analyze the testability of the hypotheses
about buoyancy, a coding scheme was constructed by several researchers from different
countries who all participated in the international part of this study. Eight categories ranging
from 1-8 and two subcategories, 3b and 6b, were stated. By following a flowchart from top to
bottom and answering the questions, the corresponding category and code for that hypothesis
could be found (see Figure 6). The flowchart was adjusted multiple times because of low
inter-rater reliability (K < .60) in earlier versions. For the final coding scheme, the interrater
reliably was almost perfect (K = .82). Despite the ILS included a clear description to the
participants that they had to formulate at least two hypotheses, many participants only
formulated one hypothesis. To keep further analysis as fair as possible it was chosen to select
for each participant only the hypothesis with the highest hypothesis score. All the formulated
hypotheses, except for the hypotheses formulated during the transfer-test about playing
outdoors, were scored with this coding scheme. After much thought, a decision was made to
exclude the hypotheses formulated during the post-test about playing outdoors from this
study. The most important reason for this decision was that the construction of the coding
a result, there was not enough time for the construction of a new flowchart with a proper
[image:20.595.84.547.92.442.2]interrater reliability (K > .70).
Figure 6. Original international flowchart for coding stated hypotheses.
For further analysis on the testability of the formulated hypotheses, the categories 1, 2, 3
and 4 till 8 were used as four scale variables. Category One was seen as the lowest achievable
score because the formulated hypothesis covered a domain other than floating and sinking or
it did not include a dependent and independent variable or contained an irrelevant statement.
As an example, a participant stated the following sentence: “The mass of a wooden beam”.
This sentence was not a hypothesis because it did not include a dependent and independent
variable and for that reason it was not testable. At category Two, hypotheses were more
testable because they included a dependent variable, but did lack an independent variable. For
example, a participant stated: “I think the ball will float”. This sentence was no hypothesis
because it did not include an independent variable. Despite it would not provide much useful
information, it was more testable in the virtual laboratory than the first example. The third
category contained all testable hypothesis in the domain of buoyancy, but those hypotheses
“If the air matrass is bigger than the same amount of water the air matrass will sink.”.
Although this hypothesis is an example of a testable hypothesis it could not be tested in the
virtual laboratory because the included laboratory did not provide the participants with a
virtual air matrass. Categories 4 till 8 all included a testable hypothesis in the domain of
buoyancy that could be tested in the included laboratory. For example, a participant
hypothesized: “If the density of the ball is smaller than the density of the fluid it will float.”.
For further analysis on the testability of the formulated hypotheses the categories 4 till 8 were
all recoded to category 4.
The original categories 4 till 8 all included hypotheses in the domain of buoyancy that
were testable in the virtual laboratory. The difference between the hypotheses in each
category was the amount of domain coverage. These hypotheses ranged from the least domain
coverage, category 4 to the highest domain coverage, category 8. A category 4 hypothesis
included mass or volume of the ball but did not denote the density of the ball. These category
4 hypotheses only covered a small part of the domain of buoyancy while a category 8
hypothesis compared the density of the object and the density of the fluid to test an interaction
effect and covered almost the entire domain of buoyancy. Because the categories 6 and 6b
both denoted density of the fluid or the density of the object, stated a testable hypothesis, and
the covered area of the domain was equal, these two categories were combined into category
6.
Results
Sample characteristics
For a trustworthy analysis, the assumption of normality is of utmost importance. To
check for normality, the inquiry skills test, the knowledge test and the testability of
formulated hypotheses were tested for normality with a Kolmogorov-Smirnov test and by
analyzing the scatterplots and histograms. Data was normally distributed among all conditions
for the pre-test scores, post-test scores and inquiry skills gain for the overall inquiry skills test.
For the constructs “identifying variables”, and “stating hypotheses” results from the
Kolmogorov-Smirnov test stated that the data was not normally distributed (p < .05). Visual
inspection of the scatterplots and histograms also indicated that a normally distribution could
not be assumed. Parametric tests could therefore, only be performed for the overall scores on
the inquiry skills test. Between-group differences for the constructs “identifying variables”
For the knowledge pre-test and post-test, the testability level of formulated
hypotheses, and domain coverage of the formulated hypotheses, visual inspections of the
scatterplots and histograms and Kolmogorov-Smirnov tests were performed to determine if
there was a normal distribution of data. Results from the Kolmogorov-Smirnov indicated that
for all these performed tests, data was not normally distributed (p < .05). Visual inspection of
the scatterplots and histograms also indicated that a normally distribution could not be
assumed. Between-group differences were therefore analyzed by non-parametric tests.
Test results
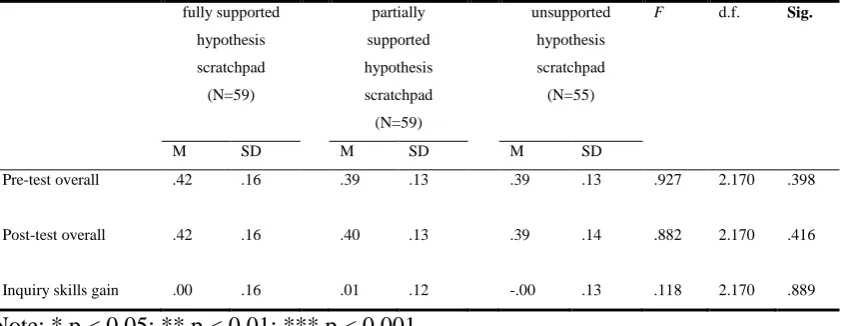
Inquiry skills. One-way univariate ANOVA’s stated that on the pre-test and post-test
scores there were no significant differences between conditions. None of the three conditions
showed any gain of inquiry skills as can be seen in Table 1. The univariate ANOVA for the
gain of inquiry skills also indicated that there were no significant differences in inquiry skills
gains between any of the three conditions. The mean scores and standard deviations for all
[image:22.595.75.497.421.584.2]three conditions gave no indications that anything occurred as a result of the intervention.
Table 1. Mean, standard deviation and F values on the overall score on the inquiry skills test.
fully supported hypothesis scratchpad (N=59)
partially supported hypothesis scratchpad
(N=59)
unsupported hypothesis scratchpad
(N=55)
F d.f. Sig.
M SD M SD M SD
Pre-test overall .42 .16 .39 .13 .39 .13 .927 2.170 .398
Post-test overall .42 .16 .40 .13 .39 .14 .882 2.170 .416
Inquiry skills gain .00 .16 .01 .12 -.00 .13 .118 2.170 .889
Note: * p < 0.05; ** p < 0.01; *** p < 0.001.
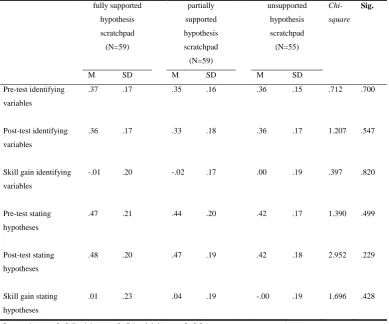
Next to the results on the overall-test, we looked into the results on the identified
constructs. A Kruskal-Wallis H test was performed to determine if any significant differences
were present on the pre-test for the constructs “identifying variables” and “stating
hypotheses”. Results indicated that no between-group differences were present at the pre-test
for neither one of the constructs (p > .05), results indicating that the starting level for the three
constructs was equal. The post-test scores and inquiry skills gain for the constructs
No evidence could be found for between-group differences (p > .05). In summary, it can be
stated there were no differences between conditions for the two constructs of the inquiry skills
[image:23.595.73.463.175.499.2]test (see Table 2).
Table 2. Mean, standard deviation and Chi-square values for scores on the constructs
“identifying variables” and “stating hypotheses”.
fully supported hypothesis scratchpad (N=59) partially supported hypothesis scratchpad (N=59) unsupported hypothesis scratchpad (N=55) Chi-square Sig.
M SD M SD M SD
Pre-test identifying variables
.37 .17 .35 .16 .36 .15 .712 .700
Post-test identifying variables
.36 .17 .33 .18 .36 .17 1.207 .547
Skill gain identifying variables
-.01 .20 -.02 .17 .00 .19 .397 .820
Pre-test stating hypotheses
.47 .21 .44 .20 .42 .17 1.390 .499
Post-test stating hypotheses
.48 .20 .47 .19 .42 .18 2.952 .229
Skill gain stating hypotheses
.01 .23 .04 .19 -.00 .19 1.696 .428
Note: * p < 0.05; ** p < 0.01; *** p < 0.001.
Domain knowledge. For the overall performance score among all condition in the
knowledge test the participants (N = 153) scored a mean proportion score of .21 (SD = .21) on
the pre-test. On the post-test, the participants (N = 153) scored a mean proportion score of .34
(SD = .23). For the knowledge gain scores, the pre-test scores were subtracted from the
post-test scores for all participants. A Wilcoxon signed-rank post-test indicated that there was a
significant gain in knowledge (see Table 3). The difference between the post-test and pre-test
scores for every condition were analyzed by a Wilcoxon signed-rank Z test. For all three
conditions a significant gain in knowledge was found (p < .05). Results indicating that the ILS
Table 3. Wilcoxon signed-rank Z test for pre-test and post-test scores for all conditions
on the knowledge test.
all conditions Z. N Sig.
M SD
Knowledge Pre-test .212 .208
Knowledge Post-test .343 .229
Knowledge gain (Post-test – Pre-test) .131 .281 -5.308 153 <.001***
Note: * p < 0.05; ** p < 0.01; *** p < 0.001.
To determine whether the amount of added support in the HS resulted in a
significantly different amount of learning gain, multiple analyses were performed. A
Kruskal-Wallis H test was performed to determine if any significant differences were present for the
pre-test and post-test scores between conditions. Results indicating between-condition
differences were not present for the pre-test scores (p = .587). This indicated that the entry
knowledge for each condition was almost equal. The Kruskal-Wallis H test also gave no
evidence indicating between-group differences for the post-test scores (p = .054). Although,
the significant score for the post-test comes close to a significant value.
Table 4. Mean, standard deviation and Chi-square values and Wilcoxon signed-rank test
scores on the knowledge test.
fully supported hypothesis scratchpad
(N=55)
partially supported hypothesis scratchpad
(N=53)
unsupported hypothesis scratchpad
(N=45)
Chi-square
Sig.
M SD M SD M SD
Pre-test .19 .20 .22 .22 .23 .20 1.064 .587
Post-test .40 .22 .32 .24 .31 .22 5.829 .054
Wilcoxon signed-rank test z-score.
-4.244 -2.371 -2.137
Sig. <.001*** .018* .033*
Note: * p < 0.05; ** p < 0.01; *** p < 0.001.
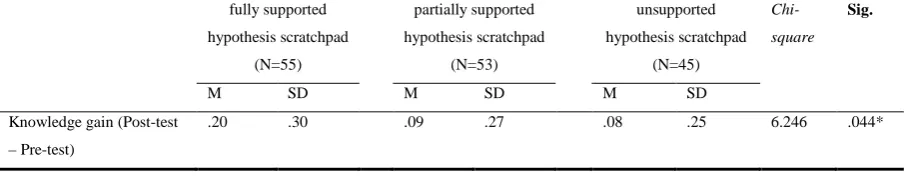
Differences between conditions on the knowledge post-test were also analyzed for the
knowledge gain. For this, the pre-test scores were subtracted from the post-test scores for all
participants, these knowledge gain scores were analyzed by a Kruskal-Wallis H test. These
results showed significant between-group differences (p < .05) (see Table 5). Three paired
comparisons were made by means of a Mann–Whitney U test to determine where the
[image:24.595.71.531.462.617.2]Whitney U test indicated that the learning outcome for the fully supported HS condition was
statistically higher than the learning outcome for the partially supported HS condition Z =
-2.089, p = .037. The second Mann–Whitney U test indicated that the learning outcome for the
fully supported HS condition was statistically higher than the learning outcome for the
unsupported HS condition Z = -2.193, p = .028. The third Mann–Whitney U test indicated
that the learning outcome for the partially supported HS condition did not statistically differ
from the learning outcome for the unsupported HS condition Z = -.004, p = .997. Results
indicated that the participants who were supported by the fully supported HS gained
[image:25.595.72.527.300.388.2]significantly more knowledge in comparison to the partially and unsupported condition.
Table 5. Mean, standard deviation and Chi-square values for learning outcomes on the
knowledge test.
fully supported hypothesis scratchpad
(N=55)
partially supported hypothesis scratchpad
(N=53)
unsupported hypothesis scratchpad
(N=45)
Chi-square
Sig.
M SD M SD M SD
Knowledge gain (Post-test – Pre-test)
.20 .30 .09 .27 .08 .25 6.246 .044*
Note: * p < 0.05; ** p < 0.01; *** p < 0.001.
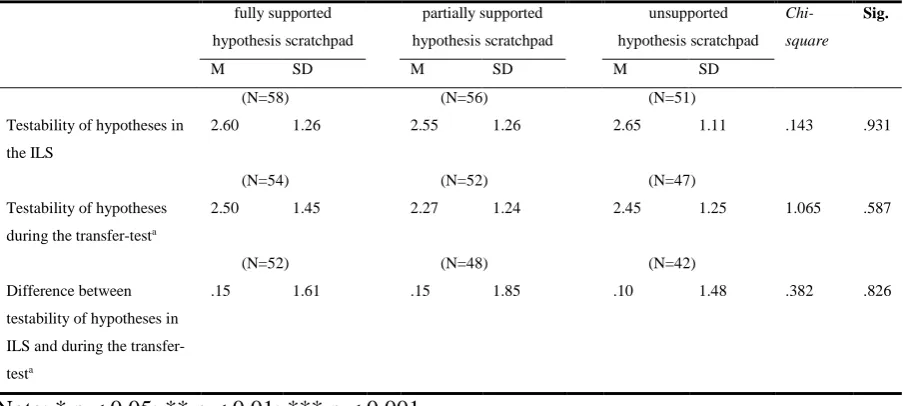
Testability of formulated hypotheses. The hypotheses in the category one up to and
including four that were formulated during the ILS and during the transfer-test were analyzed
by a Kruskal-Wallis H test. No significant between-group differences were found for the
hypotheses formulated during the ILS and hypotheses formulated during the transfer test (p >
.05). The differences between the scores for the in ILS formulated hypotheses and the after
the ILS formulated hypotheses were also analyzed. During the transfer test, all participants
were supported by the fully supported HS. If the fully supported HS had a positive effect on
the quality of the formulated hypotheses, the difference between both scores would be bigger
for the fully supported HS condition compared to the partially supported and unsupported HS
condition. No indications for significant between-group differences were found (p > .05), (See
Table 6. Mean, standard deviation and Chi-square values for scores of the testability of
formulated hypotheses during the ILS and during the transfer test.
fully supported hypothesis scratchpad
partially supported hypothesis scratchpad
unsupported hypothesis scratchpad
Chi-square
Sig.
M SD M SD M SD
(N=58) (N=56) (N=51)
Testability of hypotheses in the ILS
2.60 1.26 2.55 1.26 2.65 1.11 .143 .931
(N=54) (N=52) (N=47)
Testability of hypotheses during the transfer-testa
2.50 1.45 2.27 1.24 2.45 1.25 1.065 .587
(N=52) (N=48) (N=42)
Difference between testability of hypotheses in ILS and during the transfer-testa
.15 1.61 .15 1.85 .10 1.48 .382 .826
Note: * p < 0.05; ** p < 0.01; *** p < 0.001.
aDuring the transfer-test, all participants were supported by the fully supported hypothesis
scratchpad
Domain coverage of formulated hypotheses. Three ordinal regression analyses were
performed to determine whether the odds of getting more domain coverage from a hypothesis
differs significantly for one of the three different conditions. An ordinal scale ranging from
category four up to and including category eight, whereby category eight contained the
hypotheses with the most domain coverage, was used. The odds of getting more domain
coverage when a participant used the fully supported HS was 17.00 times higher than when a
participant used the partially supported HS (p = .001). The odds of getting more domain
coverage when a participant used the fully supported HS was 14.95 times higher than when a
participant used the unsupported HS (p = .001). The ordinal regressions analysis gave no
significant result for the partially supported and unsupported HS (p = .884). During the
transfer-test all participants were supported by the fully supported HS. Therefore an ordinal
regressions analysis for the domain coverage of formulated hypotheses did not yield any
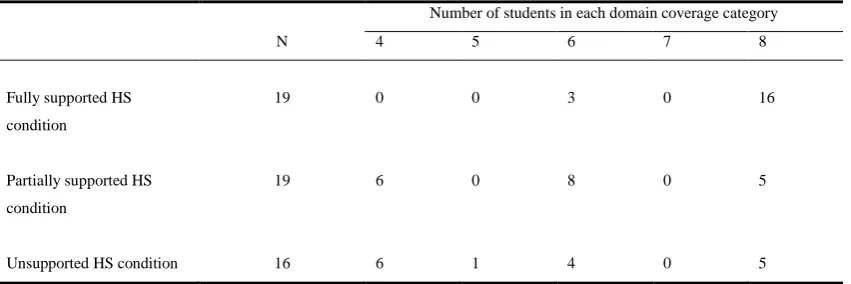
Table 7. Number of students in each domain coverage category of formulated
hypotheses, during the ILS, by condition.
Number of students in each domain coverage category
N 4 5 6 7 8
Fully supported HS condition
19 0 0 3 0 16
Partially supported HS condition
19 6 0 8 0 5
Unsupported HS condition 16 6 1 4 0 5
Testability of the formulated hypotheses for higher and lower achieving students. To
determine if the amount of added support by the HS resulted in different levels of testability
for higher or lower achieving students, two samples of participants were generated. The first
sample consisted of 104 students who scored 6.5 or higher on their final overall science mark.
A result that had, when rounded, led to at least a seven as a final mark. The second sample
consisted of 75 participants who scored 6.4 or lower on their final overall science mark. A
result that had, when rounded, led to a six or lower as a final mark. These science marks were
distributed to the researcher by the school principal on condition that after disclosure this data
could not be redirected to the names of the participants. As expected, the higher achieving
students also scored higher on the inquiry skills pre-test and inquiry skills post-test compared
to the lower achieving students. A paired sample t-tests indicated that there was a significant
difference in the proportion scores for higher achieving (M = .45, SD = .13) and lower
achieving (M = .33, SD = .13) students; t(157) = 5.78, p < .001 on the inquiry skills pretest.
The second paired sample t-tests indicated that there was also a significant difference in the
scores for higher achieving (M = .44, SD = .13) and lower achieving (M = .36, SD = .14)
students; t(157) = 3.82, p < .001 on the inquiry skills posttest.
A Mann–Whitney U test indicated that testability level of formulated hypotheses was
higher for higher achieving students (Mean Rank = 91.46) compared to lower achieving
students (Mean Rank = 69.65), U = 4086.50, p = .003. For both the higher and lower
achieving students, the hypotheses that were formulated during the ILS and during the
transfer-test were analyzed by a Kruskal-Wallis H test. No significant between-group
differences were found for the testability of hypotheses formulated during the ILS (p = .411)
and testability of hypotheses formulated during the transfer-test (p = .255) for higher
differences were found for the testability of hypotheses formulated during the ILS (p = .290)
and testability of hypotheses formulated during the transfer-test (p = .704) (see Table 8 and
[image:28.595.71.529.196.324.2]Table 9).
Table 8. Mean, standard deviation and Chi-square values for scores of the testability of
formulated hypotheses during the ILS and during the transfer-test for higher achieving
participants. fully supported hypothesis scratchpad partially supported hypothesis scratchpad unsupported hypothesis scratchpad Chi-square Sig.
M SD M SD M SD
(N=34) (N=35) (N=32)
Testability of hypotheses in the ILS
3.03 1.19 2.71 1.30 2.72 1.08 1.778 .411
(N=34) (N=32) (N=26)
Testability of hypotheses during the transfer-testa
2.91 1.38 2.53 1.19 2.81 1.13 2.731 .255
Note: * p < 0.05; ** p < 0.01; *** p < 0.001.
aDuring the transfer-test, all participants were supported by the fully supported hypothesis
[image:28.595.72.529.469.599.2]scratchpad.
Table 9. Mean, standard deviation and Chi-square values for scores of the testability of
formulated hypotheses during the ILS and during the transfer-test for lower achieving
participants. fully supported hypothesis scratchpad partially supported hypothesis scratchpad unsupported hypothesis scratchpad Chi-square Sig.
M SD M SD M SD
(N=24) (N=21) (N=19)
Testability of hypotheses in the ILS
2.00 1.10 2.29 1.19 253 1.17 2.473 .290
(N=20) (N=20) (N=21)
Testability of hypotheses during the transfer-testa
1.80 1.32 1.85 1.23 2.00 1.26 .701 .704
Note: * p < 0.05; ** p < 0.01; *** p < 0.001.
aDuring the transfer-test, all participants were supported by the fully supported hypothesis
scratchpad.
An ordinal regression analysis for the domain coverage of formulated hypotheses for
higher or lower achieving students was not performed. After selecting all suitable cases, too
little lower achieving participants met the requirements (N = 13), making a trustworthy
Discussion and conclusion
The purpose of this study was to determine whether the amount of support offered in a
HS was of influence on the gain of inquiry skills, gain of knowledge, and the testability and
domain coverage of formulated hypotheses. In addition, this study also explored if different
amounts of support offered in the HS resulted in different testability levels of the formulated
hypotheses for higher or lower achieving students.
It was expected that students who were supported by a fully supported HS would
outperform students who were supported by a partially supported or an unsupported HS when
it comes to learning gains. The ILS that was used during this study contributed to the learning
gain of students in all three conditions. Furthermore, this study revealed that students who
were supported by the fully supported HS while working with the ILS gained more
knowledge compared to students who were supported by the partially supported or the
unsupported HS. These results are in line with results from the literature review by Prince and
Felder (2006) and findings by Mulder et al. (2016) who showed that more support during
inquiry based learning leads to higher learning gains.
In addition, the expectation was that students who were not supported during the
process of formulating hypotheses would have gained more inquiry skills compared to the
students who were supported by the partially supported or fully supported HS. Opposed to
what was expected, this intervention did not lead to an increase of inquiry skills. Additionally,
no group differences were present concerning inquiry skills gain. These results might be
related to the difficulty level of the test, which has been stated by some participants as
“extremely difficult” or in one occasion even as “impossible”. The used inquiry skills test was
an adapted version of the TIPS (Dillashaw & Okey, 1980) and the TIPSII (Burns, Okey &
Wise, 1985) which were both indicated as a suitable test for 12–18 year old students (De
Jong, Tasiopoulou & Zacharia, 2014). With a mean age of 12.01 for students participating in
this study, this test seemed to be difficult but feasible. Along with others but mostly because
the purpose of the test was to measure if the inquiry skills increased as a result of the
intervention, it seemed more appropriate to use a test that was on the more difficult side then
on the more easy side. An easy test might have led to students scoring an almost perfect score
on the pre-test which makes an improvement of inquiry skills hard or even impossible to
measure. Although, with today's knowledge the test used in the present study might have been
a bit too hard for the students. Another possible explanation for the lack of inquiry skills gain
hypothesis is stated as one of the most difficult processes (Klahr & Dunbar, 1988; Njoo & de
Jong, 1993) and increasing the inquiry skills is more often seen as part of an entire
improvement program (Ergul et al., 2011; Zion, Michalsky & Mevarech, 2005). The 50
minutes this intervention took seemed to be too short for increasing the inquiry skills. During
future studies on improving the inquiry skills of students by supporting them during the
process of formulating hypotheses, it might be more beneficial to have more interventions for
improving inquiry skills.
When looking at the process of formulating hypotheses, it was expected that the fully
supported HS would have given students the desired structure and help which would result in
in a testable hypothesis with a large domain coverage. Unlike the expectations, results from
this study did not give any indication that the help offered by the fully supported and partially
supported HS led to the formulation of more testable hypotheses. Results that might be related
to the low level of prior knowledge students had, on the knowledge pre-test students on
average only answered 21% of the questions correct. Having prior knowledge of mass and
volume might in all probability be essential to formulate a testable hypothesis in the domain
of buoyancy. Although the use of a fully supported HS did not lead to more testable
hypotheses, it did lead to the formulation of hypotheses with a higher domain coverage.
Testing hypotheses with a higher domain coverage will generate more information to create a
correct image of a phenomenon than testing hypotheses with a lower domain coverage. For
the understanding of a problem, creating a correct idea of the phenomenon is of most
importance (Pyatt & Sims, 2012; De Jong & Van Joolingen, 1998; Shute & Glaser, 1990).
During the present study, the learning gain for students in the fully supported HS
condition were higher compared to the partially and unsupported condition, although results
on the knowledge post-test with a 40% correctness for the fully supported condition were still
low. This higher gain of knowledge might have been caused by the higher domain coverage
of the formulated hypotheses which could result in the creation of a better image of the
concept of density. However, this was beyond the scope of this study. Future research could
explore if students who worked with the fully supported HS indeed created a more correct
image of a phenomenon. Whereas a study focusing only on the construction process of the
hypotheses might provide the necessary insights.
Previous studies indicated that the level of support offered to students in an ILS might
lead to different results for higher or lower achieving students (Manlove et al. 2009; Manlove
et al., 2007; Veermans et al., 2006). Despite the results of these previous studies, the present