The Impacts of Multiple 360 Feedback Projects Utilizing Coaching and Follow-Up: A Quantitative Longitudinal Exploratory Descriptive Research Study
______________________________________________________________________________
A Thesis
Presented to the Faculty in Communication and Leadership School of Professional Studies
Gonzaga University
Under the Supervision of Dr. Heather Crandall Under the Mentorship of Dr. Michael Poutiatine
In Partial Fulfillment Of the Requirements for the Degree Master of Arts in Communication and Leadership
By Jeremy Unruh
Abstract
360 degree feedback is a great tool for organizational development, however many organizations don’t include coaching and follow-up to maximize impact for long term results. This quantitative longitudinal exploratory descriptive research study explores the impact of conducting the same 360 feedback survey within the same organization over a 3 year time frame utilizing coaching and follow-up. Data from 6 individuals indicate an improvement of awareness and an increase of set goals and completed goals. Theories of awareness and self-perception are discussed as well as the development of a new communication channel between manager and employee for organizational development purposes.
Table of Contents
CHAPTER 1: INTRODUCTION 5
Importance of the Study and Purpose 5
Definitions of Terms Used 6
Organization of Remaining Chapters 7
CHAPTER 2: LITERATURE REVIEW 8
Philosophical Assumptions 9
Theoretical Basis 10
Critical Theory 10
The Literature 12
Characteristics of a 360-Degree Feedback Process 12
Participant-Stakeholder Democracy 13
Anonymity 14
Self-Awareness 15
Coaching and Goal-Setting 17
Behavior Change 18
Rationale 19
Research Questions 20
CHAPTER 3: SCOPE AND METHODOLOGY 21
Scope 21 Participants 23 Method of Study 24 Facilitators 24 Procedures 25 Data Analysis 26 Reliability 27
Confidentiality and Ethical Consideration 27
CHAPTER 4: EXPLORATORY DESCRIPTIVE RESEARCH STUDY 28
Description of the 360 Feedback Study 28
Results 29
Time One Perception of Self Scores to Rater Group Scores 29 Time Two comparison of Self Scores to Rater Group Scores 30 Comparison of Normative 2010 Data to Participant Data Over 3 Years 32
Blind Spot Progression 33
Discussion 34
Increase in Goals and Goal Completion 35
Measuring Self-Awareness 36
Time Frame of 360 Feedback 37
CHAPTER 5: SUMMARIES AND CONCLUSIONS 39
Limitations of the Study 39
Further Research and Recommendations 41
Conclusion 44
REFERENCES 46
Chapter 1 Introduction Introduction.
Multi-source or 360 degree feedback refers to survey ratings that can come from
subordinates, supervisors, peers, internal or external customers and usually include a self-survey to provide a self-awareness baseline for leadership development (Liviu et al., 2009). Research has indicated that 360-degree feedback can improve behavior, communication and performance (Smither, London & Reilly 2005). It is most often used for leadership in corporate training programs to streamline the leadership development initiatives within an organization. The 360-degree process recognizes that little developmental change can occur without useful feedback to help guide behavior (Beatty & London, 1993). In order to provide participants with useful feedback, it is important to know what factors need to be included in a successful 360-degree feedback program to ensure organizational development and personal change. If the feedback process is thoroughly coached using a qualified facilitator and the tool utilized is aligned with organizational improvement initiatives while preserving anonymity, multiple 360 feedback projects conducted intermittently can provide practical normative data to additionally assist in leadership development.
Importance of the Study and Purpose.
Despite the popularity of 360 feedback in organizational development no research has been conducted surrounding an organization utilizing the same 360 survey tool longer than a 2 year time frame. In addition, previous research had inconclusive results around improvement on organizational goals (Hazucha et al., 1993, Rosti & Shipper, 1998) when conducting the same 360 survey within an organization for 2 years. The research limitations included a lack of specific coaching and follow-up to ensure goal completion with participants. This exploratory
study examines a large IT security organization that conducted the same 360 survey over a 3 year time frame with a regimented coaching and follow-up program. The results of this study, while not definitive, are organized to address previous research limitations and to add to previous research about the impact of 360 feedback within organizations.
Definitions of the terms used.
360 feedback, 360 Degree Feedback, Multi-source feedback or Multi-rater feedback - Performance data collected by an employee (self-survey) as well as managers, peers/others, co-workers and direct reports to assess development needs within an organization.
Anonymity - The state of being anonymous, not identified
Blind Spot - An area in a 360 degree feedback report where an individual rates themselves average, high average or high while a rater group rates the individual low or low average for a competency.
Blind Spot Goal - A coach and manager determined goal based on deficiencies noticed in a 360 report.
Competency - A set of defined behaviors that provide a structured guide for development
Facilitator - Individual who administrates the 360 feedback surveys within an organization. Can also be a coach, or individual in human resources.
Self-Awareness - Awareness of oneself, traits, feelings and behaviors. Self-Perception - Knowledge of how oneself is perceived by others.
Organization of remaining chapters.
Chapter 2 examines theories of Self-Perception (Bem, 1972) and Critical Theory (Deetz, 1985) as they pertain to self-awareness and the ability of a person to understand how they are perceived to co-workers, peers, managers, direct reports and others. Important characteristics of a 360 are outlined and the importance of anonymity, coaching, follow-up and goal setting are discussed. In Chapter 3, the scope of the study is described along with the description of the research and procedures. This study is a quantitative longitudinal exploratory descriptive
research study surrounding data from 6 participants who were administered the same 360 survey over a 3 year time from with the inclusion of a regimented coaching and follow-up schedule. Chapter 4 presents the data from the study. Only Blind Spot scores were used to identify participant goals on a year-to-year basis. Chapter 5 describes the limitations of the study, describes key findings from the collected data and recommends future research.
Chapter 2 Literature Review
In recent years multi-source or 360-degree feedback has become a popular development tool used by an estimated 90% of fortune 1000 companies (Smith & Fortunato, 2008). Research has indicated that 360 degree feedback is a useful organizational tool but careful design and planning needs to be applied surrounding the development process in order for it to be effective (Robertson, 2008; Wood, 2006). Luthans and Peterson’s (2003), research determined that 360 degree feedback surveys have some difficulties relating to (a) an abundance of information in the report making it difficult for an individual to comprehend self-other score comparison; (b) resolving the variations of self-ratings vs. others-ratings; and (c) the explicit need for guidance to not only clarify scores but also to understand any conflicting information to set appropriate goals for development (Crispo & Sysinger, 2012). In order to address the aforementioned difficulties, some important correlations toward a successful 360 degree program will be addressed in this review of literature including characteristics of a 360 program, primarily the preservation of anonymity to avoid inflated scores (Alamo-Metcalfe, 1998; Bass & Yammarino, 1991) the ability of an individual to be self-aware in order to gain a clearer grasp of desired behaviors, (Alamo-Metcalfe, 1998; Robertson, 2008; Wood, 2006) and the importance of coaching backed by educational training to set goals for behavioral change (Hazucha, Hezlett & Schneider, 1993; Wood, 2006). This thesis addresses deficiencies described in previous research (Luthans & Peterson, 2005), and also examines how the administration of the same designed 360 project conducted intermittently can provide practical normative data to assist in the personal and organizational development process.
Philosophical Assumptions
At the root of the 360 process is the perception of self-awareness in the company of others combined with a desire for change/improvement. At the organizational level, the desire for change aims to improve communication, develop and retain employees and identify a benchmark for improvement. At the individual level, the 360 process gives an individual the opportunity to change behavior in order to better align behavior with a company’s long-term vision, and encourage personal development. The organization conducting a 360 feedback project needs to clearly communicate the intentions to avoid ethical egoism by one side or the other. Ethical egoism as described by Greek philosopher, Epicurus, is the idea that self-interest is at the origin of all actions (Griffin, 1994). Organizational communication to describe the intent of a 360 feedback process for developmental purposes is important for employees to provide honest feedback. If it is determined by a participant that scores will be used for compensation or position advancement, score inflation will occur suggesting ethical egoism (Antonioni, 1994; Smith & Fortunato, 2008).
Socrates proposed that;
It is our responsibility to examine our normative beliefs, to become aware of them, to become aware of conflicting and competing normative beliefs that others may hold, and to evaluate as best we can, the grounds or reasons that can be offered in support of these various principles (Beversluis,1987, p. 85).
If organizations determine normative beliefs within an organization, individuals can identify with those beliefs and develop behaviors that coincide with those values. In addition, if individuals see the importance of self-examination for the purpose of development, change can occur.
Theoretical Basis
The 360 degree feedback process is a way for an employee to gain a better understanding of how they perceive themselves compared to how they are perceived by others in order to change behavior and align with organizational values. Self-Perception Theory from Bem (1972) claims that “an individual’s own behavior will be used as a source of evidence for their beliefs and attitudes to the extent that the contingencies of reinforcement for engaging in the behavior are made more subtle”(p. 8). This is the root of the 360 process, as a self-survey is the basis for which all rater scores are compared, in order to discover differences. These differences help determine self-awareness and provide a baseline for setting goals and changing behavior for personal and organizational development.
Critical theory.
Critical theory from Deetz (1985) investigates how “the awareness of organizational members regarding the conditions under which they work and make decisions, critique instances of distortion and interest domination, and educated members toward making necessary changes” (p. 123). In order address set goals, organizations need to align organizational processes with human interests (Deetz, 1985). Deetz further suggests managers should "complicate their perceptions of subordinates by being around them, talking with them, and learning their hopes, dreams, fears, values, and needs” (Griffin, p. 270). Managers and coaches should discuss goal-setting with direct reports after a 360 degree process in order to make sure progress toward agreed-upon goals are taking place. This communication practice should provide a “value-consensus development” to include in organizational development processes (Deetz, 1985).
Bem’s theory (1972) and Deetz’ (1985) theory have not been applied to the relationship of 360 degree feedback and organizational development; however, both are useful due to the
importance of self-perception and the awareness of a person’s behavior within an organization are key components to a successful 360 feedback project.
The Literature
Characteristics of a 360-degree feedback process.
Many studies indicate that 360-degree feedback can be an effective tool to outline the guidelines for behavior change (Bracken & Rose, 2011; Hazucha, Hezlett, & Schneider, 1993; London & Bailey, 1993; Overeem, Wollersheim, Driessen, Lombarts, Van De Ven, Grol, & Arah; 2009, Smither, London, & Reilly, 2005; Sysinger & Crispo, 2012). Bracken and Rose (2011) found that four characteristics of a 360 degree feedback process must be met in order to successfully create organizational change: relevant content, credible data, consensus
participation, accountability/follow-up (not to be confused with accountability relating to identifying participants). The actual survey provided must contain relevant content that aligns with the values and leadership competencies that are unique to the organization including strategy, values and company culture (Bracken & Rose, 2011). Bracken and Rose ( 2011), also investigated the differences of off-the-shelf versus custom solutions to determine if either solution provides more or less value for organizational change. It was found that Off-the-shelf solutions preserve core competencies that have been proven over time, however many
organizations request additional questions or competencies to closely map those competencies with organizational culture (Bracken & Rose, 2011). Custom content can create opportunity to reinforce organizational values and the desire to improve leadership behaviors but must maintain the core competencies originally designed in order to preserve validity (Bracken & Rose, 2011).
Another characteristic of a 360-degree process is credibility surrounding the aspects of the tangible feedback program. Credible data includes a number of factors including: having a sufficient number of raters responding, selecting the appropriate raters, an efficient instrument with clear and concise language, an appropriate rating scale and training and coaching both
before and after the process is completed (Bracken & Rose, 2011; Hensel, Meijers, Leeden & Kessels, 2010). Research has shown that the number of raters significantly affects the reliability of the feedback report (Hensel et al., 2010). Hensel et al., (2010) found that between six to eleven peer raters were necessary to reach a satisfying reliability level. The research indicated that fewer than three raters resulted in low levels of reliability. Results of the study indicate that an increasing number of raters lead to an enhancement of reliability of peer ratings and the levels of agreement between supervisors and peers (Hensel et al., 2010). The research did not go beyond 11 raters however an upward trend was identified1 (Hensel et al., 2010)
Participant-Stakeholder democracy.
Deetz (1985) theory of participant-stakeholder democracy suggests that stakeholder democracy, or the process by which all stakeholders in an organization negotiate power and openly reach collaborative goals. The ratings provided by a 360 feedback survey will stipulate where an individual participant compares to the organization’s performance benchmarks,
providing explicit indication on whether or not further development activity is necessary (Bailey & Fletcher, 2002). Low participation and involvement may result in reducing credibility of the report thus limiting the effectiveness (Kudisch, Fortunato, & Smith, 2006; London & Smither, 1995) In addition, having data or feedback on all leaders is useful for building an internal norm database and data for research providing organizational reliability and validity going forward (Bracken & Rose, 2011).
Another factor associated with the 360-degree feedback process is coaching, and it will be addressed in greater detail in this study. Managers need to meet with direct reports after 360 project completion to help determine two or three developmental goals to work on throughout a given period of time. In addition, having a coach as a moderate predictor helps the magnitude
and consistency of change across the organization. Coaching follow-up demonstrates the value of feedback and the commitment to change within the organization. Coaching provides raters with opportunity to further clarify reports, engages the rater in an action-plan process and helps raters be better observers of behavior moving forward (Bracken & Rose, 2011).
Anonymity.
Anonymity is a vital component to a successful 360-degree feedback process (Antonioni, 1994; Kudisch, Fortunato, & Smith, 2006; Liviu, Emil, Irina, & Delia, 2009; London & Beatty, 1993; Smith & Fortunato, 2008). Without anonymity, a fear of retaliation occurs at the
subordinate to manager level which creates an inflation of responses resulting in skewed results. (Smith & Fortunato, 2008; Kudisch, et al., 2006) Research from Antonioni (1994) found that when anonymity is communicated and at the fore-front of a feedback project, upward feedback or subordinate to manager feedback ratings will be deflated, preserving more accurate and honest feedback scores. In addition, an individual should not fear that their career, financial
compensation or role within an organization is in jeopardy as a result of the feedback they provide (Liviu, et al., 2009; Smith & Fortunato, 2008). Researchers have debated that 360 degree feedback should not be used in retaliation to performance appraisals while others argue that the use of 360 degree feedback works effectively to determine performance and
compensation (Sysinger & Crispo, 2012). Performance appraisals are not focused on behavioral change (London & Beatty, 1993) and while there are pros and cons to both sides, for the purpose of this study, focus will remain on the accuracy of scores in a 360 project to ensure reliability, thus preserving anonymity in a 360 degree program.
Self-Awareness.
A theory devised by Duval and Wicklund (1972) called objective self-awareness (OSA) discussed the ability of an individual to look inward and compare one’s own progress and behavior against a relevant standard (Ashley & Reiter-Palmon, 2012). Bem’s (1972) self-perception theory is also based on how an individual’s behavior is perceived by one’s self and others stating that if an individual’s “internal cues are weak, ambiguous, or interpretable, the individual is functionally in the same position as an outside observer, an observer who must necessarily rely upon those same external cues to infer the individual’s inner states” (p. 2). More recent studies have indicated a more simple standard definition, stating that self-awareness is nothing more than self/other agreement correlating how an individual’s behaviors closely compare with the perception that others view those behaviors (Shipper, 2010; Van Velsor, Taylor, & Leslie, 1993).
Regardless of definition, self-awareness has proven to be extremely difficult to measure because of the complexity around its context, thus researchers have failed to identify an all- inclusive measurement (Ashley & Reiter-Palmon, 2012). Atwater and Yammarino’s (1997) research substantiates that there are several factors that determine influential bias on self-awareness, including individual biodata, individual characteristics, job-relevant experiences, cognitive processes and context/situation of the need for self-evaluation. Some literature has focused on specifics within one of the aforementioned characteristics such as gender influences in a 360-degree assessment (Alimo-Metcalfe, 1998; Manning & Robertson, 2010), however these specifics will not be addressed as the focus will remain on rating comparison of self-other agreement within the 360 degree process.
Atwater and Yammarino (1997) established that the comparison of self-ratings to those of different sources (i.e. surrounding contributors within an organization) helped determine accurate ratings or self-other agreement. London and Beatty (1993) found that self-ratings are useful to focus attention on discrepancies and similarities to identify gaps in perceptions. In an
organizational setting, researchers have determined the necessity for a scale or relevant standard to compare these ratings; to both organizational norms as well as how one’s scores compare to managers, peers, direct reports and others (Ashley & Reiter-Palmon, 2012; Atwater &
Yammarino, 1997; Hensel, Meijers, Leeden, & Kessel, 2010; Shipper, 2010; Van Velsor, Tayler, & Leslie, 1993). Atwater and Yammarino (1997) used a self-other rating agreement process as a relevant standard which compares self-scores with those of others and categorizes the scores into 4 S-O types. These S-O types include; over estimator (self-rating is very high but others ratings are very low) determining that the development needs surrounding this competency are high and should be focused on. In agreement/good (self-rating is high and others ratings are also high) determining that the development needs surrounding this competency are low. In agreement/poor (self-rating is low and others rating low) determining development needs surrounding this
competency are high and should be focused on. Lastly, under estimator (self-ratings are a little lower than the ratings of others) determining development needs are moderate (Atwater & Yammarino, 1997). In relationship to the leadership development process, “the effectiveness of self-awareness outcomes turns on developing or accepting specific standards along with the strong desire for accurate self-evaluation” (Ashley & Reiter-Palmon, 2012, p. 4).
Coaching and goal-setting.
Once self-ratings are put into the context of tangible data comparison categories such as S-O types, the input is useless without the knowledge of how to use it (Addison & Tosti, 2009). In some cases, reports are returned to the individual, leaving interpretation up to the individual, however when there are multiple sources involved, i.e. managers, direct reports, peers and others, a facilitator can help with any interpretation questions as well as point out areas that the individual will want to focus on improvement (Seifert, McDonald, &Yukl, 2003). Training using a facilitator familiar with the 360 degree process is necessary to identify goal-setting (Addison & Tosti, 2009) as well as to “help an individual see themselves as others see them” which in-turn should motivate the individual to improve (Robertson, 2008; Shipper, 2010; Smither, London, Vasiliopoulos, Reilly, Millsap & Salvemini, 1995). Goal setting could be even more effective with follow-up coaching or engagement learning programs to encourage development (Garrison, Johnson, Hernez-Broome, Fleenor, & Steed, 2012). Luthans and Peterson (2003) researched the effect of a systematic coaching process surrounding the 360 process. In the research, it was determined that:
In order for 360 programs to have a positive impact, the target managers may need systematic coaching along with the 360-degree feedback in order to gain self-awareness and have a positive impact on self- and others work satisfaction, organizational
commitment, and intention to turnover. (p. 252)
The guidance of coaching throughout the 360 feedback project can supplement the feedback results which can emphasize the importance for development (i.e. behavior change) within an organization (London & Beatty, 1993).
Behavior change.
Researchers have debated if 360 feedback can create behavior change (Bracken & Rose, 2011; Smither, London & Reilly, 2005; Seifert et al., 2003). Bracken and Rose (2011) agree with Smither et al., (2005), that “it is time for researchers and practitioners to ask ‘Under what conditions and for who is multisource feedback likely to be beneficial?’ (rather than asking, ‘Does multisource feedback work?)”. This study aligns with both Smither (2005) and Bracken and Rose (2011).
Most research on 360-feedback behavioral change comparing 360 research scores to those of the same 360 project at a varied time interval have been inconclusive. Hazucha et al., (1993) research conducted a 360 project that integrated coaching over a 24-month period. The research proved beneficial in determining where participants had deficiencies, but found that the most difficult aspect of the feedback project was maintaining momentum with individual
participant goals. Hazucha et al., (1993) suggest that support from supervisors that provide specific tips toward improvement would be helpful to maintain momentum toward behavioral change. Rosti & Shipper (1998) research conducted a 360 degree project over a 3 month interval with coaching and the results showed inconclusive results around the impact of a training
program but did show improvements in overall profiles of skills did.
It is important to understand if a 360 program with coaching and follow up, has significant results (improved scores) over a longer time interval. If anonymity is preserved, coaching is instilled, and overall organizational goals provide an individual with the confidence that the 360 program is for development, it is hypothesized that honest scores will create a baseline for goals that can be improved upon and behavioral change can occur.
Rationale
A 360 degree feedback program is a complex organizational tool that can be used to help advance development. The complexities include the importance of employer/employee
communication to develop a mutual understanding that the 360 program is for developmental purposes only. Once an individual gains an understanding of the 360 feedback process, he/she can provide honest feedback and provide a more accurate self-assessment. Coaching helps communicate the purpose and can also help to interpret the report to set goals. In addition, coaching can help management to follow-up with goal progression and keep individuals on a path toward goal achievement. In addition, critical theory from Deetz' (1985) suggests that manager/employee communication should be emphasized particularly at the manager level. The 360 process takes Deetz' (1985) theory even further as it is a channel to open communication between managers and employees, and creates norms for participant-stakeholder democracy to take shape.
It is important to understand if a 360 program conducting the same assessment with coaching and follow up, has significant results (improved scores) over a longer time interval. If anonymity is preserved, coaching is present, and overall organizational goals provide an
individual with the confidence that the 360 program is for development, it is hypothesized that honest scores will create a baseline for goals that can be improved upon and behavioral change can occur.
Research Questions
Organizations conduct 360 feedback projects to promote leadership development but little research has determined what longitudinal implementation (past 2 years) of the same assessment can do for an organization after first adoption, as only two known studies have overseen three or more administrations of the same multi-source feedback project (Smither et al., 2005). How can coaching through the same 360-degree assessment over time provide participant confidence and improve both personal and organizational leadership development? In order to answer this question, the following questions must be addressed:
Research Question #1: What are the advantages/disadvantages of repeat administrations
the same 360 feedback project?
Research Question #2: Can feedback from a 360 assessment with the assistance of
coaching, provide action oriented goal-setting information to a participant for leadership development purposes?
Research Question #3: How can self-awareness be measured more efficiently to
Chapter 3 Scope and Methodology Scope
This study is focused on how a repeat administration of the same 360 feedback project with coaching can alleviate participant fear to reduce inflated scores, promote employee development and encourage behavior change. It is important to note that participants that go through a 360 feedback survey for the first time can have a fear of what the information will be used for, often presuming that the scores will be used in appraisals or performance reviews (Smith & Fortunato, 2008; Kudisch, et al., 2006). Coaching is obviously an important aspect to the 360 feedback process in order to alleviate participant fear and initiate behavior change from skill deficiencies identified in a 360 report. To achieve optimal results, the coaching process must include; (a) pre-assessment coaching to outline organizational purpose and preserve anonymity; (b) post-assessment coaching to help interpret reports and identify what areas need improvement, and (c) follow-up in-between reports to keep track of goal progress. The general training used to instruct the coaches about the 360 report will be described, however since each coach has different methods toward coaching, variations in individual coaching techniques will not be described. It will be assumed that the key aspects of the training program will be
followed when coaches instruct their respective participants.
Research from Shipper & Rosti (1998), and Hazucha et al. (1993), has shown inconclusive results surrounding the use of 360 feedback and how it impacts significant organizational development improvement (Seifert et al., 2003). Shipper & Rosti (1998) found deficiencies in the training of participants, finding that each individual needed specific skill development, and group training was not ideal for a 360 program. Hazucha et al., (1993), research indicated that a 360 project was useful to the participants to identify areas to improve
skills; however difficulties in follow-up proved to present a need for continued coaching around set goals. To address these limitations, this study will focus on personal coaching around skill deficiencies with ongoing coaching beyond 3 years.
Only 6 participants are included in this research due limitations by the organization, only having 6 participants take the survey in 2010, 2011, and 2012. However, the organization does plan to include more participants in the same survey in the future, which could add more participants that will have taken the same survey 3 separate years and possibly could add to the participant data in this research, to understand the implications of having 4 years of data.
Additionally, only scores that showed a need for development were identified as a focal point for coaching. Individuals’ scores that were within the organizational norm on a year-to-year basis were excluded from this research.
A quantitative longitudinal exploratory descriptive design was chosen for this study to examine the 360 feedback process with coaching over a three year time frame from 2010 to 2012. The exploratory design was chosen because secondary data analysis data was collected but participation was minimal, as only 6 individuals participated in the same 360 survey for 3 years. This study looks at descriptive statistics to identify any patterns that future research can build upon.
The first 360 project was conducted in 2010 and identified normative data for the
organization, providing a benchmark for participants as they repeated the process each year. As the participants repeated the process each year, coaching workshops and follow-ups were used to guide the process and ensure action plans were set between projects with steps being made to achieve these goals over time.
Participants.
The sample consisted of 6 director or senior director level employees of a fortune 1000 international technology organization. The participants were 66% male and 33% female
dispersed global across 4 different countries. Coaching facilitators at each location provided an introductory workshop to help participants understand the purpose for the survey, described the fundamentals of the 360 process and helped participants read and interpret a sample report. After the 360 reports were processed, coaching facilitators met with each participant to go over the report and set an action plan to identify areas for development for the following year. Quarterly follow-up meetings were conducted by management to ensure the action plan was being followed and commitment toward improvement was being maintained. The same process was followed during the second and third 360 projects.
Method of the Study
Leadership competencies and emotional intelligence were assessed using a structured survey, The Leadership EQ (LEQ) using the Task Cycle, derived from the psychologist Clark Wilson (Wilson & Wilson, 1991). It was chosen for the audience of director level professionals responsible for initiating and leading change. The survey consists of 59 questions of which three are open-ended and measure six Task Cycle phases(See Appendix C). The Task Cycle phases are presented in a logical sequence to predict how others perceive an individual’s impact on the organization. The phases include the individual’s ability relating to: setting direction, strategic planning, implementation, feedback, driving for results and acknowledging contributions. Responses are recorded on a 7-point Likert scale ranging from never to always2. The same LEQ survey was used all three years but norms were derived from 2010 only, and used to compare against 2011 results and 2012 results.
Facilitators.
The facilitators were trained from the third-party client The Booth Company, who
distributes the 360 projects through their Rescore platform which is used to distribute the surveys online. The facilitators in the project met with participants for the first time in 2010 to conduct a workshop and discuss the survey fundamentals, individual action planning as well as how to read and review sample reports. In addition, the facilitators explained the use of 360 feedback for the purpose of gaining valuable knowledge from peers, direct reports, supervisors and others about the perception of leadership within the organization. The LEQ dimensions were explained and a walk through of the TruScore® portal was completed to guide participants through the process with the least amount of friction possible. Once the participants completed their self-survey and all raters completed their surveys, the report was processed. Individuals were given a report on
where their data aligned with other directors as well as what their individual strengths and areas for improvement were in order to find action items to work on moving forward. The first report also served as creation for normative data, to serve as a benchmark for all future reports. After the report was distributed, each participant met with their supervisor to discuss an action plan for development. Each action plan determined S.M.A.R.T. goals or: Specific, Measurable,
Achievable, Realistic and Timely (Wilson & Wilson, 1991). Coaches helped to point out what S.M.A.R.T. goals should be set between participant and supervisor. Once S.M.A.R.T. goals were set between participant and supervisor, quarterly follow-up meetings were set to ensure the action plan commitment was in tack. This process was repeated for 2011 and 2012, however only 2010 data served as the norm for the organization.
Procedures.
In 2010, 6 participants participated in the LEQ feedback survey. The participants were 66% male and 33% female. All participants completed a Feedback Workshop with a facilitator and then completed a self-survey. Each participant had between 8 and 23 raters complete the same LEQ survey on the individual with an average of 14.1 raters per participant per year. Raters were a mix of direct reports, supervisors/managers and peers/others. The dynamics of an organization including promotions, hiring, firing, retirement, etc. of raters meant that a
consistency of the same raters for each participant could not be determined as constant; however reliability was preserved by having an appropriate amount of raters per participant on a year-to-year basis. Once all participants and raters completed the LEQ survey, a report was processed to give the participant a baseline for an action plan for development. In the report, dimension scores showed how an individual’s raw scores compare to the raw scores of the organization. Participant then met with their supervisor to discuss the results and identify their S.M.A.R.T.
goals to work on for the following year. Quarterly update meetings were conducted to ensure the action plan was being followed. The same procedure and follow-up was conducted from 2010 to 2011 and from 2011 to 2012.
Data Analysis.
All data from this exploratory research will be collected and a year-to-year comparison will be conducted. All participant scores will be compared using descriptive stats to determine year-to-year change for participants that have gone through the 360 LEQ project. Only Blind Spot scores where an individual scored themselves average, high average or high, but raters score the individual low average or low will be included in this data analysis, as this is the focus for coaching and identifying S.M.A.R.T. goals. In addition, participant’s Blind Spot competency scores will be compared to the raw scores of the organization to determine if the participant scores are within the organization’s norms for development. Blind Spot raw scores will be compared on a year to year basis; both at an individual level and at the rater level to determine if the scores increased or decreased. If both the individual score and the rater score are within normative range, the S.M.A.R.T. goal will be determined as met. If an individual’s raw scores still disagree with rater scores, it will be determined that the S.M.A.R.T. goal was not met and further development will be needed around the competency. In addition comparisons will be made on occurrences where the S.M.A.R.T. goal is reached by one rater group, but a new rater group determines a Blind Spot (i.e. an individual self-survey competency score is high, and the manager group rates the competency score low. The following year, the self-survey competency score is within range with the manager group score, however the peer group scores the
competency low and a new S.M.A.R.T. goal will be determined for the peer group). Additional frequency statistics will also determine an increase or decrease in the number of blind spots for
an individual on a year to year basis particularly in year 2, when both the employer and
employee have a mutual understanding of organizational intent for conducting a 360 project. Reliability.
The reliability of a single multi-source feedback project depends on the tools “capacity to develop competencies and motivation” (Hensel et al., 2010, p. 2818). Hensel et al., (2010) research found that a key element of a 360 assessment’s reliability is to ensure the appropriate number of raters responded to each individual. This research determined that the number of raters included in a report determines the reliability level and that an ideal level of 0.7 was found when the individual had 7 to 8 raters participating in the study (Hensel et al., 2010). In this study, participants had between 8 and 23 raters.
Confidentiality and Ethical Consideration.
To protect confidentiality within the data set, the participants and organization involved in the study will remain anonymous and have agreed via pre-survey disclaimer that the scores presented in the feedback reports could be used for collection by the organization for normative and research based data, preserving the confidentiality rights of the participants involved. Participants are given the option of having their data removed from any research purposes, however participants do not have the option of removing their data from the normative data established by the organization. As agreed upon, only rater level and generic corporate description will be used to identify those involved with the survey. The data set collected has been stored on protected databases with access only to the organization involved, facilitators appointed and the authorized staff of TBC (The provider of the LEQ). Through the process of data collection, anonymity is preserved to ensure all responses to questions remain confidential and are shared only with the appropriate parties involved.
Chapter 4 Exploratory Descriptive Research Study Description of the 360 Feedback Study
During the months of July through October 2010, a fortune 500 security organization conducted a large development initiative utilizing 360 surveys to provide feedback to director level employees for the purposes of leadership development. All surveys were conducted
utilizing an online portal to preserve anonymity. 249 participants took the Leadership EQ survey designed with leadership competencies (see Appendix A) integrated with emotional intelligence. The Survey was designed utilizing a Task Cycle methodology designed by Dr. Clark L. Wilson, who was one of the original facilitators of 360 degree surveys to organizations looking to improve management and leadership development (Shipper, 1998). In 2010, data was used by the organization to establish normative data for future baseline reports. Coaching and follow-up programs were designed between each project year to ensure goals were being set and
communication channels between managers and participants were open for developmental purposes. The same LEQ was given to participants between September and November of 2011 with coaching and follow-up schedules being followed thereafter, and again between August and October of 2012. Only 6 participants took the survey all 3 years. This exploratory research study is designed to review the results of those 6 participants to see if trends and additional questions can be identified for future research.
Results
Descriptive data statistics were used to show the central tendency of 360 feedback scores for Self-ratings compared to those scores of specific rater groups including Managers,
Peers/Others and Direct Reports. Only Blind Spot scores were used as those were determined areas of focus for both coaching and goal setting. Since the research had a small sample size of 6 participants, focus was placed on Blind Spot competency scores to determine if differences during Time One, Time Two, and Time Three were significant to emphasize future research. Each rater had between 8 and 23 raters during each 360 survey to ensure each report maintained a satisfying reliability level (Hensel et al., 2010). See Appendix B.
Blind Spots are determined when an individual rates themselves average, high average or high while a rater group rates the individual low or low average for a competency. Using a 7-point Likert scale, blind spots are determined when differences of participants scores and rater group scores are greater than .5 in relationship to high self scores to low rater group scores. The 7-Point Likert scale is determined by; 1 = never, 2 = almost never, 3 = sometimes, 4 = average, 5 = often, 6 = almost never, 7 = always. NR is also included as an option for not rated or N/A See Appendix C.
Time one perception of self scores to rater group scores.
The data shown in Table 1 shows the descriptive statistics collected at Time One and Time Two for Blind Spot data from 6 participants. Time One data was used by coaches to determine Blind Spots competency goals for individual participants to improve upon for Time Two. Scores of 6 Self ratings determined Blind Spots during Time One (M = 5.90, SD = .37) correlate to scores of Manager ratings in Time One (M = 4.99, SD = .40); to Peers/Other ratings (M = 4.89, SD = .44); to Direct Reports ratings (M = 5.47, SD = .06). Since all data is collected
specifically on Blind Spot data, Self-Survey scores should remain consistently higher than rater group scores, however it is hypothesized that each time (Time One to Time Two, and Time Two to Time Three) a participant completes a self-survey, the gap between self-scores and rater scores should decrease to indicate improvement over time.
In this exploratory study, rater score comparisons <.5 were deemed significant on the Likert 7-scale survey. During Time One, the participant Self ratings was significantly higher than Manager ratings (.91); significantly higher than Peer/Other ratings (1.01); and in range with Direct Report Ratings (.43). Table 1 also indicates that Self (N1)17 total Blind Spots were indicated across all 6 participants for an average of 2.83 Blind Spot Goals set per participant.
Time two comparison of self scores to rater group scores.
Scores of 6 Self ratings determined Blind Spots during Time Two (M = 5.63, SD = .38) correlate to scores of Manager ratings in Time Two (M = 4.92, SD = .58); to Peers/Other ratings (M = 4.91, SD = .39); to Direct Reports ratings (M = 5.31, SD = .37). During Time Two, the participant Self ratings remained significantly higher than Time Two Manager ratings (.71); remained significantly higher than Time Two Peer/Other ratings (.72); and lower but in range with Direct Report Ratings (.32). Table 1 also indicates that Self (N2)29 total Blind Spots were indicated across all 6 participants for an average of 4.83 Blind Spot Goals set per participant.
In comparing Time One and Time Two rater Groups no significant increases or decreases occurred as Self ratings decreased (.27), Manager ratings decreased (.07), Peer/Other ratings increased (.02), and Direct Reports decreased (.16). Table 1 also indicates that Self (N2)29 total Blind Spots were indicated across all 6 participants for an average of 4.83 Blind Spot Goals set per participant.
Ta ble 1. De s c riptive Da ta : C e ntra l Te nde nc y 360 fe e dba c k ra tings Tim e One a nd Two N1 M e a n S D Kurto s is S ke w N2 M e a n S D Kurto s is S ke w S e lf 17 5.90 0.37 2.6 0.77 29 5.63 0.38 3.07 0.16 M a na ge r 11 4.99 0.4 3.01 -0.98 15 4.92 0.58 6.26 -1.21 P e e rs /Othe rs 5 4.89 0.44 1.86 -0.47 21 4.91 0.39 4.59 -1.34 Dire c t R e po rts 3 5.47 0.06 1.5 -0.57 4 5.31 0.37 2.05 -0.07 N1 = # o f B lind S po t Go a ls S e t by 6 pa rtic ipa nts (Ye a r 1)
N2 = # o f Ne w o r Exis ting B lind S po t Go a ls S e t by 6 pa rtic pa nts (Ye a r 2)
Tim e One Tim e Two
Table 2 shows scores of 6 Self ratings determined Blind Spots during Time Three (M = 5.60, SD = .36) correlate to scores of Manager ratings in Time Three (M = 4.83, SD = .36); to Peers/Other ratings (M = 5.41, SD = .37); to Direct Reports ratings (M = 5.44, SD = NaN). During Time Three, the participant Self ratings remained significantly higher than Time Three Manager ratings (.77); and remained lower but now within range with Time Three Peer/Other ratings (.19); and was lower but remained in range with Direct Report Ratings (.29). Table 1 also indicates that Self (N2)29 total Blind Spots were indicated across all 6 participants for an average of 4.83 Blind Spot Goals set per participant.
In comparing Time Two and Time Three rater Groups, Table 2 indicates only
Peer/Others significantly increased (.50) whereas Self ratings decreased slightly (.03), Manager ratings decreased slightly (.09), and Direct Reports increased slightly(.13). Table 2 also
indicates that Self (N3) 16 total Blind Spots were indicated across all 6 participants for an average of 2.66 Blind Spot Goals set per participant.
Ta ble 2. De s c riptive Da ta : C e ntra l Te nde nc y 360 fe e dba c k ra tings Tim e Two a nd Tim e Thre e N2 M e a n S D Kurto s is S ke w N3 M e a n S D Kurto s is S ke w S e lf 29 5.63 0.38 3.07 0.16 16 5.60 0.36 2.38 0.87 M a na ge r 15 4.92 0.58 6.26 -1.21 7 4.83 0.36 2.05 -0.1 P e e rs / Othe rs 21 4.91 0.39 4.59 -1.34 8 5.41 0.37 2.76 0.93 Dire c t R e po rts 4 5.31 0.37 2.05 -0.07 1 5.44 Na N Na N Na N N2 = # o f Ne w o r Exis ting B lind S po t Go a ls S e t by 6 pa rtic pa nts (Ye a r 2)
N3 = # o f Ne w o r Exis ting B lind S po t Go a ls S e t by 6 pa rtic ipa nts (Ye a r 3)
Tim e Two Tim e Thre e
Comparison of normative 2010 data to participant data over 3 years.
Comparison of participant data to Organizational Norm Data in Table 1.1 shows that participants Self ratings during 2010 were within range (.42) of the organizational norms; Manager ratings were significantly lower (.65); Peers/Others were also significantly lower (.60); and Direct Report ratings were within range (.17). In 2011, Self ratings again within range closing the gap to (.15); Manager ratings remained significantly low (.72); Peers/Others ratings remained in low (.58); and Direct Reports remained in range (.33). In 2012, Self ratings continued to remain in range with the organizational norms (.12); Manager ratings fell even lower (.81), Peers/Others moved within range (.08); and Direct Reports remained in range (.20). This data is important to determine if participant scores are within organizational norm range.
Ta ble 1.1 Orga niza tio na l No rm s 2010
N* M e a n S D
S e lf 249 5.48 0.22
M a na ge r 324 5.64 0.27
P e e rs /Othe rs 1024 5.49 0.19
Dire c t R e po rts 833 5.64 0.16 No te : P a rtic ipa nt s c o re s we re inc lude d in No rm Da ta
Blind spot progression.
In Table 3, Blind Spot Progression can be seen per participant, year over year. One notable difference in year over year comparison is the increase in the number of goals in 2011 (N2) as compared to the number of goals in 2010 (N2) and in 2012 (N3). This increase could suggest an understanding of organizational purpose for development, and indicate more honest scores depicted by all participants. It could also be a result of situational factors, including economic climate or job security. The small sample size indicates that further research will need to be conducted to determine if this data is consistent across a larger participant pool. In
addition, Table 3 shows that participants will not always meet their goals from year to year, and further development will be needed in the competency deficiencies. Also, the coaching goals surrounding this 360 process indicated that only 2 to 3 S.M.A.R.T. goals should be focused on. Reasoning for limiting Blind Spot focus is to reduce overload, as these Blind Spot competency goals are for development and are also in correlation with a participants every day work load (Wilson & Wilson, 1991). Participants may improve in more than 2 - 3 competencies because of a familiarity of the 360 process and the understanding of developmental improvement needs.
2010 B 1 B C 1 B 2(B 1*) B C 2 B 3(B 2*) P 1 4 2 5(2) 7 0 P 2 5 4 0(1) 2 2(1) P 3 2 0 4(2) 3 2(3) P 4 2 1 4(1) 4 2(2) P 5 2 1 9(1) 9 1(1) P 6 2 2 0 0 2 To ta l N1(17) 10 N2(29) 25 N3(16)
B 1 = B lind S po ts 2010, B C 1 = B lind S po t Go a ls C o m ple te d De te rm ine d by 2011 S urve y R a tings B 2 = Ne w B lind S po ts Go a ls 2011, (B 1*)= C o ntinue d B lind S po t Go a ls fro m 2010
B C 2 = B lind S po t Go a ls C o m ple te d De te rm ine d by 2012 S urve y R a tings B 3 = Ne w B lind S po t Go a ls 2012, (B 2*) = C o ntinue d B lind S po t Go a ls 2011 P = P a rtic ipa nt
N = S e e Ta ble 1 a nd Ta ble 2
Ta ble 3. B lind S po t Go a l P ro gre s s io n by P a rtic ipa nt
Discussion
The purpose of this study was to present quantitative longitudinal exploratory research around the impact and facilitation of the same 360 degree feedback survey to participants over a 3 year time frame, utilizing coaching and follow-up. The results of this study, while not
definitive, are organized to add to previous research about the impact of 360 feedback within organizations. Previous to this study, no research could be found on an organization conducting the same 360 feedback survey to participants over a 3 year time period while utilizing systematic coaching and a manager/participant follow-up schedule. As mentioned, Bracken and Rose (2011) found that four characteristics of a 360 degree feedback process must be met in order to successfully create organizational change: relevant content, credible data, consensus
participation, accountability/follow-up (not to be confused with accountability relating to identifying participants). This study aimed to address all criteria, utilizing a relevant 360 survey utilizing credible data created from the validated organizational tool devised by Clark L. Wilson (Wilson & Wilson, 1991). In addition, a consensus of participation was utilized, having a large pool of participants within a large security fortune 500 company. The participant pool of 249 participants created normative data for comparison to ensure participant scores fall in range with organizational norms. Lastly, coaching and follow-up schedules were utilized throughout the three year time frame, and in between each 360 survey, to ensure goal follow-up and
manager/participant communication channels remained open.
The facilitation of coaching and the emphasis on communication between participant and manager create a participant-stakeholder relationship between the participant, the manager and the organization (Deetz, 1985). Deetz' (1985) critical theory on stakeholder democracy can be extended through 360 feedback, as the process creates a communication channel with
Deetz' (1985) research suggests that organizations represent human interests, but organizational interests and human interest representation often become distorted because "not all human interests are represented equally in organizations" (p. 122). Critical Theory suggests that organization wide interest in human development is morally right and should be open to examination for the purpose of increasing "awareness of organizational members regarding the conditions under which they work and make decisions, critique instances or distortion and interest domination, and educate members toward necessary changes" (Deetz, 1985, p 2) 360 feedback provides a communication channel between organization and stakeholder to examine human development and set goals based on self-awareness perception and also addresses distortion between organizational interests and human interest representation by providing a dynamic way to measure a variety of competencies.
Increase in goals and goal completion.
Overall, there was mixed trend evidence due to the small sample size. One key observation in this study was the year-to-year comparison of the number of goals set by
participants as seen in Figure Example 1., in which participant Blind Spot goals increased 41% from 2010 to 2011 and completion of goals increased by 27% in 2011. An increase in Blind Spot goals completed in 2011 and an increase in Goals Set in 2011 by participants suggests a sense of comfort within the 360 degree process resulting from a combination of an introduction of a new communication channel between participant and employer as well as coaching and follow-up evidence to emphasize organizational intent.
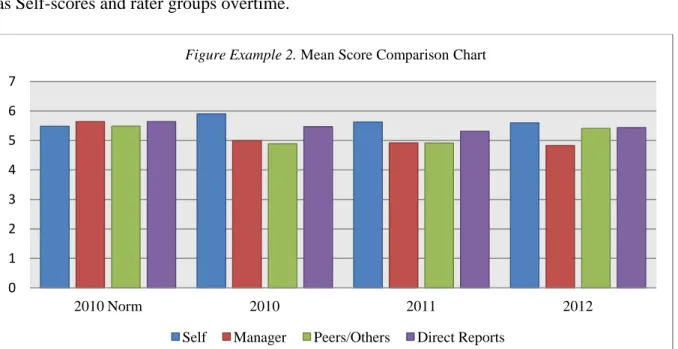
Measuring self-awareness.
Another observation in this research proposes a possible measure of self-awareness, suggesting that during Time One, descriptive research statistics in this study found that Self ratings were high, but not out of range of the normative data established by the organization in 2010. More importantly noted was the decline in Self ratings over the 3 year period as seen in Figure Example 2. Several factors could have led to the decline in self scores including an acknowledgment of organizational purpose resulting in a more honest rating set or possibly a self-realization on the perception of one's own actions compared to how they are seen by their co-workers, managers and direct reports. Another factor that strengthens the hypothesis is the correlation of self-ratings to those of both Peers/Others and Direct Reports in 2012 as seen in Figure B. The gap in mean scores for 2010 to 2012 between Self ratings and Peers/Others ratings (reduced gap to .19) and Direct Reports ratings (reduced gap to .16) could suggest that a participant becomes more self-aware over time of how they are perceived by their Peers/Others and Direct Reports. On the contrast, Self ratings compared to those of their Manager Ratings reduced the gap from .91 in 2010 to .71 in 2011, but the gap increased in 2012 to .77. An emphasis on coaching, particularly with participants and managers to enhance self-awareness "may lead to improved self and employee attitudes and eventually even improve performance"
17 22 9 7 7 10 25 2010 2010 Goals Completed 2011 2011 Goals Completed 2012 Figure Example 1. - Blind Spot Goal Progression
(p. 252), as suggested by Luthans and Peterson (2003). Although this research does not indicate a definitive way to measure self-awareness (Ashley & Reiter-Palmon, 2012), it does add to what more recent studies have found in that correlation does exist between how an individual's behaviors and the way they rate themselves, relates to the perception of rater groups within an organization. (Shipper, 2010; Van Velsor, Taylor, & Leslie, 1993). This research used 3 years and noticed a decrease in gap size, both between Self-ratings and organizational norms, as well as Self-scores and rater groups overtime.
Time frame of 360 feedback.
Longitudinal data collected from the same 360 degree survey over a 3 year time frame may not be ideal for all organizations, however the time frame used of 1 year with coaching and follow-up did provide evidence of goal completion, or otherwise noted as a closer correlation of scores between Self-ratings and rater groups. The completion of goals and the realization of a need for development are the baseline of the 360 process. The trends of 360 degree feedback should be a bell shape over a 3 year time frame. The reasoning is that during Time One, it is hypothesized that Self-ratings will be inflated due to a number of factors including a fear of
0 1 2 3 4 5 6 7 2010 Norm 2010 2011 2012
Figure Example 2. Mean Score Comparison Chart
organizational intent and a deficiency in self-awareness as perceived by others in the organization. In between Time One and Time Two, coaching, participant/manager communication channels, and goal follow-up should lead to an increase in goals set by
participants leading to an increase in goals completed during Time Two. In Time Three, fewer goals should be set, as both Self-raters and group-raters have a greater understanding of the process, and most importantly, the process should encourage communication channels that help develop each participant and how they work with their co-workers within an organization. In this study, it does appear that coaching and follow-up did help maintain momentum, and address a concern in previous research from Hazucha et al., (1993), as goal completion was significant as depicted in Time Two and Time Three Blind Spot Goals set in Figure Example 1.
Chapter 5 Summaries and Conclusions
In summary, the highlights of this study were to develop upon existing research studies, address the deficiencies of coaching and follow-up found in those studies, and outline a guide for future researchers to build upon. The theories outlined by Stanley Deetz including critical theory, stakeholder democracy and the opposition to the theory of self-interest distortion were used in relationship to the communication channels that are created from the 360 process (Deetz, 1985). One area his study did not address is cybernetic theory, as the research was aimed at the results of the 360 process and not the 360 survey technology and its advantages or limitations. In addition, the coaches help to interpret the 360 survey results to the participants to alleviate any noise between the 360 survey technology and its participants.
Limitations of the Study
This exploratory study has some limitations. A small participant pool of 6 individuals from a large IT security organization limits how much of the results can be generalized to the rest of the organization as well as to other organizations. Second, only scores that showed a need for development were identified as a focal point for coaching which excludes any data around soft spots or areas that are not regarded as blind spots but could be approaching a need for development based on score differential between self scores and rater group scores. In addition, as previously noted, individuals’ scores that were within the organizational norm on a year-to-year basis were also excluded from this research.
Another limitation of the study was the control of utilizing the same raters on a year-to-year basis within a participants rater groups. Since organizational factors can lead to individuals leaving an organization, retiring, quitting, being placed in another unrelated department, being promoted to a different position etc, it is inconceivable due to these dynamics to assume that each participant was rated by the same raters and due to preservation of anonymity, this study
was unable to determine any churn rates or participation increase or decrease due to the
aforementioned organizational factors. It is perceived that by maintaining a sufficient number of raters within the rater groups of Peers/Others and Direct Reports, scores would not fluctuate enough to skew Blind Spot goals, however, it is possible to skew manager scores as this rater group tends to have fewer participants ranging from 1 to 2 managers per participant in this study. This limitation can be controlled by comparing self-scores to those of organizational norms in cases where managers fluctuate, however for this study, it was undetermined if any of the participants were under a new manager for any given year.
Lastly, this study measured differences in scores to determine if the same survey provided a gap closure of scores between self and rater groups on a year-to-year basis thus determining if a Blind Spot goal was met. This study did not weigh Blind Spot goals based on rater groups, suggesting that Blind Spot goals from managers may have more impact on an individual's behavior change then that of an individuals' peer or direct report. The 360 process encourages overall development which is to address all deficiencies regardless of rater group, however it is undetermined if participants place more emphasis on manager Blind Spot goals then another group. Future research is needed to determine if individual participants view managerial goals as priority, and focus more on those goals each year.
Further Research and Recommendations
In review of the findings of this exploratory research study, a few observations may guide future research around the impact of 360 degree feedback over a 3-year time frame while
utilizing coaching and follow-up. Between time One and time Two, there was a 41% increase in Blind Spot goals and the completion of goals increased by 27% in 2011. Several factors could have contributed to the increase including a sense of comfort that participants felt about the 360 process, resulting in an understanding that the organizational purpose was for developmental purposes and nothing more. The increase in goals could also be attributed to the visualization of normative data in the participant report, giving the participant an organizational understanding that the 360 process is part of a larger organizational initiative to improve at both the
organizational level and the participant level. Deetz' (1985) argues that normative systems of beliefs and values may preclude understanding and articulation of self-needs and lead to
unwitting support of interests opposed to one's own or perhaps everyone" (p. 122). Deetz' (1985) also argues that implementation of organizational structures or specific technologies can fulfill certain individual interests better than others. The 360 feedback process addresses both
deficiencies in Deetz' organizational construct by developing a normative system that is dynamic enough to focus on specific competency deficiencies at the individual level and organizational level from year-to-year while improving communication channels between manager and employee. The improved communication channel created through 360 feedback is attributed to Deetz' (1985) theory of Stakeholder Democracy, describing that the process improves
employee/manager communication as coaching and follow-up increase to address individual goals. Future research involving a larger participant pool can determine if this hypothesis of increased goals during the second time two is valid and possible rationale behind the trend.
Another observation in the data presented found that self-scores declined year-to-year over the 3 year time frame. The largest decline occurred between Time One and Time Two surveys which could suggest a number of situational factors responsible for the decline.
Researchers have described the phenomenon of defensiveness in self-perception which originally described by Bem (1972) and later as Alimo-Metcalfe (1998) and Bailey and Fletcher (2002) describe as the idea that a person wants to preserve a positive self-image to not only maintain self-esteem, but also to preserve organizational status. The 360 feedback process can alter the individual's need for self-preservation and transfer perception towards self-transformation, giving the participant the feedback required as Bass, Avolio and Atwater (1996) describe as the ability of an individual to "decide what is desired change, plan for it, learn how to do it and then transfer learning to the job" (p. 11). Future research with a larger participant pool is needed to determine if a 360 feedback project can close gaps between a participant’s Self-ratings to those of rater groups over time, most importantly with coaching in follow-up, as they address the participant questions that Bass et al. (1996), describe to help the participant decide what changes (goals) are needed, how to learn and plan to address these goals and how to implement the changes into employee development.
Lastly, gap differences in self-scores closed for the rater groups of peers/others and direct reports, however remained significant when comparing against manager scores. Several factors could have led to the continued gap, as this relationship is tied more closely to both monetary and promotional advancement. The 360 process described by Crispo and Sysinger (2012), has been implemented for both developmental purposes and appraisal purposes. For this study, the intent of the organization was strictly for developmental purposes however the gap difference may suggest that the manager relationship with an employee will continue to maintain higher
standards because the manager is also responsible for the appraisal process. It is unknown if the organization in this study also uses a separate appraisal process but it is implied. Bailey and Fletcher (2002) and London and Smither's (1995) research found that participants will become more aware of the behavior's rewarded within an organization and because of this, more
developmental needs are presented, resulting in more manager/employee engagement. The correlation between a 360 program and an appraisal process in this context could explain the remaining gap from year-to-year. More research is needed to determine what changes (if any) occur as the participant and manager continue the practice of separating the 360 process solely for development.
Conclusion
The results of this study outline a specific procedure of conducting a 360 feedback program within an organization. The method includes addressing deficiencies in previous research from Hazucha et al., (1993) Rosti & Shipper (1998), by focusing on the importance of coaching and follow-up surround the 360 process. This study was largely exploratory as no previous research could be found in which an organization conducted the same 360 feedback survey over a 3 year period. The results of the study found an increase in development goals and an increase in completed goals from Time One to Time Two and the decrease of both during Time Three would suggest that participants needed time to understand the process and organizational intent. The administration of the same 360 survey, utilizing the same coaching and follow-up process provides the participant with a familiarity of the process and an awareness of organizational intent.
The study also revealed as with previous research, that self-awareness is difficult to measure, however the results found that the simple act of measuring self-awareness within the 360 process heightens awareness and leads to an increased self-perception of how an individual is viewed against their managers, peers/others and direct reports. (Ashley & Reiter-Palmon, 2012; Atwater & Yammarino, 1997; Hensel, Meijers, Leeden, & Kessel, 2010; Shipper, 2010; Van Velsor, Tayler, & Leslie, 1993).
Finally, this study revealed that the 360 process is a communication channel that can improve upon Deetz' (1985) theory of Stakeholder Democracy. As managers and employees discuss development goals and talk about organizational interests, the manager/employee relationship strengthens. Deetz (1985) argues that a normative system of organizational values and beliefs can lead to self-interest distortion, however the 360 process involves multiple groups
providing feedback to one individual, thus improving on self-awareness and self-perception within an organization. While normative data can provide a baseline for certain organizational goals, more importantly, it provides information to the participant to develop goals and initiate behavior change.
It is important for organizations to understand that the 360 process is not a one-time organizational tool but rather an ongoing developmental process that needs time to encourage the right circumstances for goal development and personal change. Organizations should pay close attention to (a) implementing coaching and follow-up, (b) utilize the same 360 survey to measure goal setting and completion and improve self-awareness over time, and (c) acknowledge the development process around adding an additional communication channel between participant and manager.