Causes of Tax Evasion and Their Relative Contribution in Malaysia: An Artificial
Neural Network Method Analysis
(Punca Pengelakan Cukai dan Sumbangan Relatifnya di Malaysia: Satu Analisis Kaedah
Artificial Neural Network)
Razieh Tabandeh Mansor Jusoh Nor Ghani Md. Nor Mohd Azlan Shah Zaidi
Faculty of Economics and Management Universiti Kebangsaan Malaysia
ABSTRACT
Tax is one means of financing government expenditures and plays an important role in increasing government revenue. The amount of tax collected actually depends on the effectiveness of the tax system in an economy. When a taxation system is ineffective, many people will exploit the situation to avoid paying tax and tax evasion will become popular. In the presence of tax evasion, the government cannot allocate revenue for programs or provide desirable social services. Realizing the significant impact of tax evasion on the economy, the present study aims to determine the main factors that result in tax evasion and their relative importance. The present study employs an artificial neural network (ANN)
methodology on Malaysian data for the period between 1963 and 2011. The results show that tax burden, size of the government and inflation rate have positive effects on tax evasion. The income of taxpayers and trade openness, however, has negative effects on tax evasion. The results also reveal that the income of the taxpayer has a more significant relationship with levels of tax evasion than the other causes of tax evasion examined in the present study.
Keywords: Tax evasion; Artificial Neural Network method ABSTRAK
Cukai adalah salah satu cara untuk membiayai perbelanjaan kerajaan dan ia memainkan peranan penting dalam meningkatkan hasil kerajaan. Jumlah cukai yang dikutip sebenarnya bergantung kepada kecekapan system cukai sesebuah negara. Apabila sistem cukai tidak berkesan, kebanyakan orang ramai akan mengambil peluang ini untuk mengelak daripada membayar cukai dan aktiviti pengelakan cukai akan terus meluas. Dalam keadaan ini, kerajaan akan menghadapi kesukaran dalam menentukan hasil aktiviti-aktiviti yang dilakukannya dan tidak dapat menyediakan perkhidmatan yang diperlukan oleh masyarakat. Menyedari akan kepentingan kesan aktiviti pengelakan cukai ke atas ekonomi negara, kajian ini cuba menentukan faktor-faktor utama yang menyebabkan berlakunya aktiviti pengelakan cukai dan kepentingan relatifnya. Kajian ini menggunakan kaedah Artificial Neural Network dalam menganalisis data Malaysia dari tahun 1963 hingga 2011. Keputusan kajian menunjukkan bahawa beban cukai, saiz kerajaan dan kadar inflasi member kesan positif ke atas aktiviti pengelakan cukai. Walau bagaimanapun, pendapatan pembayar cukai dan keterbukaan perdagangan memberi kesan negative kepada aktiviti pengelakan cukai. Keputusan kajian juga menunjukkan bahawa pendapatan pembayar cukai adalah secara relatifnya lebih penting daripada faktor-faktor lain yang mempengaruhi aktiviti pengelakan cukai.
Kata kunci: Pengelakan cukai; kaedah Artificial Neural Network
IINTRODUCTION
Tax is one of the means of financing government expenditures and is an important component of government revenue. The share of tax in total revenues and the amount of tax collected differs among countries as both are dependent upon the structure of the economy in each country. In Malaysia, the share of tax revenue in government total revenue is relatively high. For
example, the total government revenue in 1963 was RM1150 million, with the share of tax revenue equaling RM915 million and representing 80% of the total revenue. Total government revenue increased to RM165,825 million in 2011, with the share of tax revenue equaling RM115,501 million and representing 69.6% of the total revenue.
The efficacy of the tax system obviously affects the severity of tax evasion. If tax evasion goes undetected and unpunished, taxpayers have a strong incentive to
conceal their income and wealth to avoid paying tax. Due to the existence of tax evasion, the government cannot allocate further revenue to programs and cannot provide desirable social services. Understanding why tax evasion occurs and understanding the factors that contribute to tax evasion is very important for efforts to decrease levels of tax evasion.
Despite the fact that many studies examine tax evasion in developed countries, limited research exists concerning tax evasion in developing countries, such as Malaysia. Kasipillai et al. (2000), Kasipillai et al. (2003), Jaffar Harun et al. (2011) and Fatt and Ling (2008) investigate the phenomenon of tax evasion in Malaysia. Kasipillai et al. (2003) investigate the influence of education on tax avoidance and tax evasion for Malaysia and conclude a close relationship exists between education and tax compliance. Similarly, Fatt and Ling (2008) investigate the relationship between tax practitioners’ perception, tax audit and tax evasion for Malaysia and find the main problem of Malaysian taxpayers relates to the lack of official and proper tax education at primary, secondary and other levels. Kasipillai et al. (2000) estimate the size of hidden income and the extent of tax evasion and find that the size of the hidden economy decreases from a high of 8.7%
of GNP in 1980 to 3.7% in 1993. Finally, Jaffar Harun et al. (2011) examine ethics in relation to tax evasion in Malaysia. However, none of the aforementioned studies specifically examine the factors affecting tax evasion.
Recognizing the significant effects of tax evasion on an economy and the lack of study in this area in Malaysia, the present study attempts to fill a research gap. Specifically, the purpose of the present study is to identify the main causes of tax evasion and also to determine the relative importance of each variable on tax evasion in Malaysia. For that purpose, an Artificial Neural Network (ANN) method is employed on Malaysian data from the period of 1963 to 2011. The results should prove useful to policy makers in reducing the occurrence of tax evasion.
This paper is organized as follows. The next section discusses the relevant literature and explains the factors that affect tax evasion, among other. The third section proceeds to explain the methodology used before the fourth section provides an overview of the collection of data. The discussion of results occurs in the fifth section, while the final section concludes the present study.
LITERATURE REVIEW
There are many factors that are known to cause tax evasion. This section begins with the definitions of tax evasion as well as tax avoidance. Next, the discussion considers the main causes of tax evasion that are common in most studies.
DEFINITIoNS oF TAx EVASIoN AND TAx AVoIDANCE
Tax evasion is different from tax avoidance. Richardson (2008) defines tax evasion as “intentional illegal behavior or activities involving a direct violation of tax law to evade the payment of tax”. While tax evasion is illegal, tax avoidance is a legal way of decreasing tax burden (Kim 2008). In another study, Sandmo (2004) mentions that tax avoidance is the result of gaps in the law and taxpayers take advantage of these gaps to decrease the amount of tax to be paid. In the present study, tax evasion is considered to be “intentional illegal behavior or activities to evade the payment of tax”, which is similar to the study of Richardson (2008).
FACToRS AFFECTINg TAx EVASIoN
Previous studies on tax evasion typically focus on the relationship between macroeconomic variables and tax evasion; and measuring the size of tax evasion. The present section identifies several factors that play an important role in explaining the magnitude of tax evasion. Additionally, many researchers believe a close relationship exists between the underground economy, the shadow economy and tax evasion. In regards to the close relationship between the underground economy and tax evasion, the present section also considers the main factors associated with the underground economy and the shadow economy.
one of the main causes of tax evasion is tax burden. Bayer and Sutter (2008) investigate the relationship between excess burden and tax evasion and demonstrate that the excess burden of tax leads to higher tax evasion. In another study, which examines the impact of tax rates on tax evasion in the European economy, Bayer (2006) shows that higher tax rates lead to greater levels of tax evasion. Cebula and Saadatmand (2005) find that higher tax rates on income leads to an increase in tax evasion in the U.S. between 1967 and 1997. In a similar study, Lee (2001) examines the effect of tax rate on tax evasion. Using the maximization method for the utility function, the results demonstrate that the effect of tax rate on tax evasion depends on the marginal productivity. If the marginal productivity is not too small, an increase in the tax rates leads to greater tax evasion. To investigate the relationship between tax shocks and tax evasion, Busato et al. (2010), using the maximization of the utility function, find that an increase in the tax rates on corporate, labor and income will push an economy toward tax evasion. Many researchers, such as Brooks (2001), Savasan (2003), Dell’Anno (2007), Dell’Annoet al. (2004), Schneider and Savasan (2007) and Sameti et al. (2009), demonstrate how an increase in tax burden results in a more active shadow economy, which leads to increases in levels of tax evasion.
other important factors associated with tax evasion include inflation rates; the income of the taxpayer; the
unemployment rate; the size of the government and the intensity of regulations; and trade openness. Many researchers (Fishburn 1981; Cranea and Norzad 1986; Fishlow and Friedman 1994; Caballe and Panade 2004) investigate the relationship between inflation rate and tax evasion and conclude that the inflation rate has a positive effect on tax evasion.
In several studies, the income of taxpayers is mentioned as a main cause of tax evasion, but there is considerable debate among researchers about the actual relationship between the income of the taxpayer and tax evasion. Embaye (2007) investigates the relationship between the income of taxpayers and tax evasion in South Africa. Using the currency demand method introduced by Tanzi (1980), Embaye concludes that the relationship between income and tax evasion is positive, but is statistically insignificant. In another study, Fishlow and Friedman (1994) investigate the relationship between tax evasion and income shocks. Using the maximization method, a negative relationship is found to exist between income shocks and tax evasion. Therefore, the relationship between income and tax evasion is an empirical study.
Tax evasion is also caused by the size of the government and intensity of regulations. As the size of the government increases, so do the number of government regulations. The government, however, might have difficulty in effectively controlling and managing each of the sectors, which tends to lead to an increase in tax evasion. on the other hand, an increase in the size of the government and intensity of regulation leads to an increase of activities in informal economies, such as underground markets and shadow markets, and greater levels of tax evasion. Aigner et al. (1988), Schneider and Savasan (2007) and Sameti et al. (2009) investigate the relationship between the size of government and shadow economy, finding that the high intensity of regulation leads to an increase in activities in such informal economies. Sameti et al. (2009) further mentions that increased activity in the underground economy can also lead to high levels of tax evasion.
Sameti et al. (2009) also find that the level of trade openness can affect levels of tax evasion. When the economy is open, the size of trade increases and all trades are conducted legally. As a result, levels of tax evasion will decrease. obviously, implementing further laws and restrictions on trade by governments can lead to a rise in the smuggling of goods and, hence, an increase in the levels of tax evasion.
To investigate other causes of tax evasion, Kasipillai et al. (2003) evaluate the influence of education on tax compliance among undergraduate students in Malaysia and find a close relationship between education and tax compliance. Studies in India by Jain (1987) also find that complicated tax structures; dishonest staff; high tax rates; and high sales tax rates are factors that contribute to the black market in India.
Among the large number of studies related to tax evasion, only a limited number of these studies investigate the effect of several factors on tax evasion for Malaysia. Kasipillai et al. (2003) investigate the influence of education on tax avoidance and tax evasion, concluding that a close relationship exists between education and tax compliance. Similarly, Fatt and Ling (2008) investigate the relationship between tax practitioners’ perception, tax audit and tax evasion and demonstrate that the main problem of Malaysian taxpayers is related to the lack of official and proper tax education at primary, secondary and other levels. To the knowledge of the researchers of the present study, no extant study investigates the main causes of tax evasion and determines the importance of each factor of tax evasion in Malaysia. The ambit of the present study is to fill such gaps in knowledge and determine the relative importance of each variable on tax evasion.
METHoDoLogY
A variety econometric methods are available to estimate the relationships between economic variables, the most popular of which are oLS, 2SLS, 3SLS, VAR, ARMA, ARIMA, gARCH, and ARCH. Many studies utilize these
econometric methods to estimate the relationship between the underground economy; tax evasion; and economic variables,but no extant study determines the importance of each variable on tax evasion. In the present study, a new method, namely the ANN, is applied to determine the factors affecting tax evasion and their relative importance.
Recently, many researchers have opted to utilize
the ANN method to estimate the relationship between economic variables and to forecast of macroeconomic variables. The unparalleled success of the ANN as a powerful method for analyzing data in empirical science contributes to the increase in the number of economists choosing to employ the method. Hill et al. (1994) compare the results of the econometric method and the ANN method in forecasting macroeconomic variables. The results suggest that the ANN method for estimating time series is, in some cases, more precise than other econometric methods. In another study, Kohzadi et al. (1995) evaluate the ANN and the ARIMA model to forecast corn trade and conclude that the error of forecast when utilizing the ANN method is 18-40% lower than the ARIMA model. Similarly, Fu (1998) compares the ANN method and the regression model to forecast out of sample of gross domestic product (GDP). Fu concludes that the ANN method is more precise than the regression model and notes that the error for out of sample in the ANN method is 10-20 % lower than the regression model.
Numerous extant studies apply the ANN method for modeling and forecasting financial markets or forecasting macroeconomic variables, such as GDP, inflation and stock prices. However, no extant study applies the ANN
method to determine the importance of each variable on tax evasion. Therefore, in the present study, the ANN method is applied to estimate the factors that affect tax evasion and determine the importance of each variable on tax evasion, based upon Malaysian data for the period between 1963 and 2011.
ARTIFICIAL NEURAL NETWoRK (ANN) METHoD
ANNs can be viewed as a non-parametric technique and, as a result, ANN models fit quite naturally for non-parametric estimations. Campbell et al. (1997) explain the binary threshold model of McCulloch and Pitts (1943), the simplest example of an ANN model to date. The binary threshold model is calculated as follows:
Y = g
(
Σ
Jj=1βjXj – μ
)
(1)g(c) =
{
1 0 ififu ≥ u < 00where Y is output variable and Xj, j = 1... J is the input
variables, β is the synaptic weight of each input Xj, g(u) is the activation function, and μ is threshold. The simplest network is represented graphically in Figure (1), in which the input layer is connected to the output layer.
Y = g
(
Σ
Kj=1βjXj – μ
)
(3)βk = [βk1, βk2, ..., βkJ)]′
X = [X1, X2, ..., XJ)]′
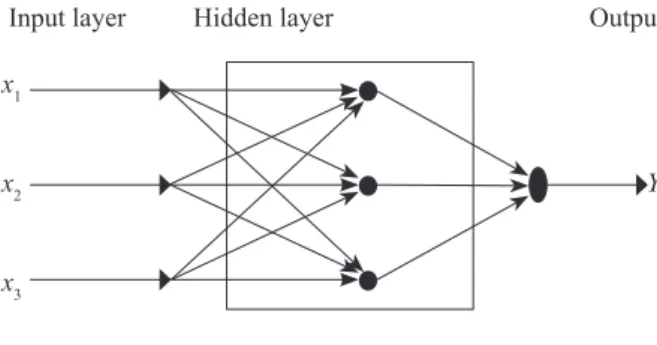
where h(u) is another nonlinear activation function. In this case, the inputs are connected to hidden layer and weighted at each hidden layer transformed by the activation function g. This network is an example of a multilayer perceptron (MLP) with a single hidden layer.
(See Figure 2) Input Output x1 x2 Y x3 x4
FIGURE 1. Binary Threshold Model
Each extension model of the ANN includes the input layer, output layer and hidden layer(s) and all layers are connected to the adjacent layers by nodes. The relationship between the input and output is determined by the weighting (β); therefore, the net value of the output
neurons is as follows: NETt = β0 + β1X1 + β2X2 + β3X3 + β4X4 + β5X5 =β0+ 5
Σ
j=1 βjXj (2)The main role of the neurons in a neural network is data processing. Data processing for output neurons is accomplished by using the activation function. There are many linear and nonlinear activation functions in
the ANN method. The most popular among them are the logistic cumulative distribution function and the hyperbolic tangent.
As mentioned above, most extensions of the binary threshold model include a hidden layer between the input layer and the output layer.
Input layer Hidden layer output x1
x2 Y
x3
FIGURE 2. Multilayer Perceptron (MLP) with a Single Hidden Layer
For a set of inputs and outputs {Xt, Yt}, MLP estimates
the parameters of the MLP network by minimizing the
sum of the squared deviations between the output and
the network:
Σ
t[
Yt –Σ
k αkg(β′kx)]
2 (4)Applying the ANN method involves several steps, including the normalization of data;building the network; determining the ratio of training and testing samples;training function; using performance functions; and training the network.Data normalization is often performed prior to the beginning of the training process to avoid computational problems (further details, refer to Lapedes and Farber (1988)).
Building the network is the second step of using ANN method. There are two types of ANN models: the feed-forward neural network, which is also referred to as the static network; and the feed-back neural network, which is also referred to as the dynamic network. Dynamic networks are similar to the lag variables in the regression model. (The dynamic network is more precise than the feed-forward neural network for time series data.
Furthermore, ANNs are classified into various types of neural networks. The most popular types of ANNs are the multilayer perceptron (MLP) and the radial basis
function (RBF) network. The most popular neural network for analyzing time series data is the MLP, which has
neurons in the hidden layer, as well as linear activation functions in the output layer that are capable of estimating each function with a minimum of error.
Determining a train and a test sample are required for building ANN (further details relating to choosing the training and testing sample of the ANN, refer to the study of Weigend et al. (1992)). Choosing the activation function is another step of applying the ANN method. Data processing for output neurons is performed by using an activation function. There are many linear and nonlinear activation functions in the ANN method. Each activation function is applied in a specific case. Logistic cumulative distribution function and hyperbolic tangent are the most popular nonlinear functions in time series predictions. The value of the logistic cumulative distribution function is between 0 and 1, while the value of the hyperbolic tangent is between –1 and 1 (further details, refer to Campbell et al. (1997) and gademe and Moshiri (2003)).
The last step of the ANN method is to apply performance functions to minimize the errors of the estimated equation. Hoiden et al. (1990) mentions several popular criteria to minimize the predicted errors, the most popular of which are as follows (further explanation and
definitions of each criteria, refer to the study of Hoiden et al. (1990)):
1. Mean Squared Error or Root Mean Squared Error. (MSE, RMSE)
2. Mean Absolute Deviation or Mean Absolute Percentage Error. (MAD, MAPE)
3. Theil U Statistic
DATA CoLLECTIoN
All data are collected from the annual Economic Report for the period of 1963 to 1980 and the World Development Indicators (WDI) for the period of 1980 to
2011. The details of the data are presented in Table (1). Based upon extant theoretical and empirical studies, many factors can potentially contribute to tax evasion, as discussed previously. However, the present study concentrates on the main causes of tax evasion since other factors are not observable and there is considerable difficulty involved in obtaining the relevant data. The main causes of tax evasion selected in the present study are outlined below.
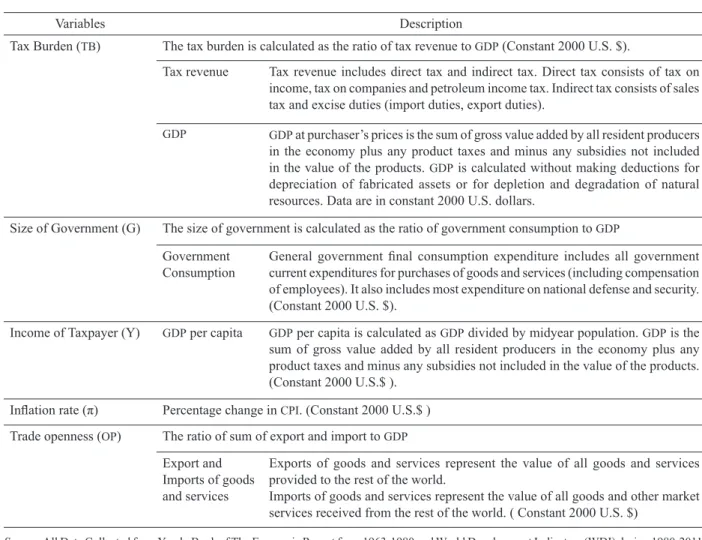
TABLE 1. The Descriptions of Main Causes of Tax Evasion
Variables Description
Tax Burden (TB) The tax burden is calculated as the ratio of tax revenue to GDP (Constant 2000 U.S. $).
Tax revenue Tax revenue includes direct tax and indirect tax. Direct tax consists of tax on income, tax on companies and petroleum income tax. Indirect tax consists of sales tax and excise duties (import duties, export duties).
GDP GDP at purchaser’s prices is the sum of gross value added by all resident producers in the economy plus any product taxes and minus any subsidies not included in the value of the products. GDP is calculated without making deductions for depreciation of fabricated assets or for depletion and degradation of natural resources. Data are in constant 2000 U.S. dollars.
Size of government (g) The size of government is calculated as the ratio of government consumption to GDP government
Consumption general government final consumption expenditure includes all government current expenditures for purchases of goods and services (including compensation of employees). It also includes most expenditure on national defense and security. (Constant 2000 U.S. $).
Income of Taxpayer (Y) GDP per capita GDP per capita is calculated as GDP divided by midyear population. GDP is the
sum of gross value added by all resident producers in the economy plus any product taxes and minus any subsidies not included in the value of the products. (Constant 2000 U.S.$ ).
Inflation rate (π) Percentage change in CPI. (Constant 2000 U.S.$ ) Trade openness (OP) The ratio of sum of export and import to GDP
Export and
Imports of goods and services
Exports of goods and services represent the value of all goods and services provided to the rest of the world.
Imports of goods and services represent the value of all goods and other market services received from the rest of the world. ( Constant 2000 U.S. $)
TAx BURDEN
Tax burden is measured utilizing different proxies, including direct and indirect taxes as a percentage of GDP. Similar to other studies (Schneider (1994), Brooks (2001), Dell’Anno et al. (2004), Savasan (2003), Dell’Anno (2007), Schneider and Savasan (2007)), the ratio of total tax revenue as a percentage of gDP is utilized as a proxy to calculate tax burden in the present study.
THE SIzE oF goVERNMENT
The size of the government and the intensity of regulations are further important factors that have a significant effect on tax evasion. Aigneret al. (1988) and Schneider and Savasan (2007) demonstrate that an increase in the intensity of regulations leads to work in the informal economy. In the present study, the real government final consumption expenditures (constant 2000 US$) to real
GDP (constant 2000 US$) ratio is utilized as a proxy for
the size of the government in a similar manner as the studies by Aigneret al. (1988), Dell’Anno et al. (2004) and Sameti et al. (2009).
INFLATIoN RATE
Many researchers (Crane and Nourzad 1986; Fishlow and Friedman 1994; Caballe and Panade 2004) conclude that the inflation rate is the main factor that causes tax evasion. High inflation causes taxpayers to avoid paying tax in an effort to maintain the purchasing power of their income. Inflation rates are calculated as the percentage change in the consumer price index (CPI).
TRADE oPENNESS
Policy makers may use various trade policies in developing countries, such as prohibiting or encouraging the import or export of certain goods; or products from certain countries of origin. The curbing or cutting of business relationships with a particular country or countries; rationing the amount of import or export of goods; and most other administrative policies lead to the development of the underground economy (Ashraf - zadehand Mehregan 2000). Sameti et al. (2009) find that a negative relationship exists between trade openness; and underground economies and tax evasion in Iran. In the present study, the ratio of the summation export and import to GDP is utilized as a proxy for trade openness, in a similar manner to Sameti et al. (2009).
INCoME oF TAxPAYER
Based on extant theoretical and empirical studies, an increase in income may lead to increases or decreases in tax evasion. Embaye (2007) demonstrates in an empirical study that a close and positive relationship exists between income and tax evasion in South Africa. In the present
study, the income of the taxpayer is calculated as GDP in constant U.S. dollars divided by the population.
MoDEL ESTIMATIoN
Incorporating the factors discussed earlier, tax evasion can be written as the following function:
TE = f(TB, G, π, OP, Y)
TE is tax evasion. Tax evasion is a latent variable and, since data concerning tax evasion is unavailable, the ratio of C to M2 is utilized as a proxy for tax evasion. C/M2 is the ratio of currency to liquidity. When the ratio of currency to liquidity in the economy is high, traders carry out transactions in cash. Since transactions conducted in cash are not reported in economic trades,
the situation provides an opportunity for traders to hide
transactions in order to evade paying taxes. Therefore, the ratio can be utilized as a proxy for tax evasion. A similar proxy has been used by Tanzi (1982) and Embaye (2007). TB is tax burden and is calculated as the ratio of tax
revenue to GDP, g is the size of government and measured as the ratio of government consumption expenditure to GDP, is the inflation rate (percentage change in CPI), OP is trade openness and calculated as the ratio of sum of export and import to GDP and Y is income of taxpayer and calculated as GDP divided by population.
To use the ANN method, the data is first normalized and then the synaptic weights of the network are determined. Afterwards, the network weights are balanced utilizing algorithm iterations (error back propagation being the most common method). Such a step is performed to ensure that the network is trained to minimize the predicted errors that are measured within the model.
The coefficient estimation of an ANN for a nonlinear system is not as easy as linear parameter estimation. Several answers may be found regarding the relative optimum for minimizing the difference between the real value of output variable and the achieved results from the network.
Independent variables are used as the input data for the input layer in the ANN method. The input variables in this model are tax burden; size of government; inflation rate; trade openness; and the income of taxpayers, while the output variable is tax evasion. The network must be run several times, followed by the model with the minimum amount of error being chosen as the fit model
in the ANN model.
In the ANN method, a certain percentage of data should be allocated for training and a further percentage of the data should be allocated for testing. In this study, 70% of the data is allocated for training and 30% of the data is allocated for testing, utilizing a MLP with 5 factors
for the input layer. AMLP consists of 1 hidden layer with
a nonlinear activation function. The activation function utilized in the hidden layer is a hyperbolic tangent;
the number of units in the hidden layer is 16; and the activation function utilized in the output layer is linear. The model with minimum error is chosen as the fit model in the ANN model, based upon an analysis of the different structures in the ANN; the number of different layers; and the different numbers of nodes in each layer. After modeling the network; andcontinuouslytraining and running the network, the percentage of incorrect predictions in the model (after choosing the fit model) is 0% and indicates that the ANN is fit and precise for modeling and estimating the factors that affect tax evasion.
RESULTS
After the normalization of the data; building the network; and determining 70% of the data for training the network and 30% for testing the network, the synaptic weights are determined. The number of units in the hidden layer is 16, indicating that 16 columns of synaptic weights exist for 70% of the data. In total, each variable has 16 columns weight and 33 rows. The mean of each unit layer for the 33 rows is calculated and then the mean of all layers for each variable is calculated. The calculation of the coefficient and estimated model are performed as
follows:
TE = 1.34*TB + 1.03*G + 1.44*π –
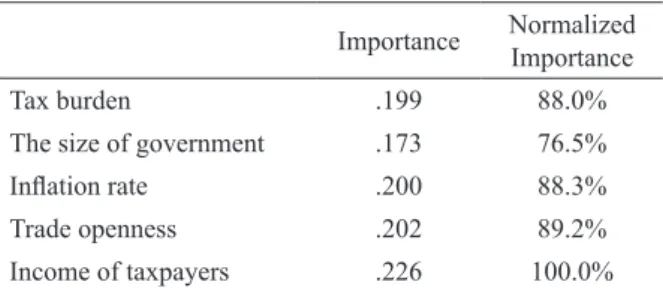
1.725*OP – 2.134Y (5) Table (2) and Figure (3) demonstrate the importance of the input variables on tax evasion in modeling perofrmed utilizing the ANN method. According to Table (2), Figure (3) and Equation (5), theincome of
the taxpayer is concluded to be the main cause of tax evasion. The normalized importance of this variable is 100% and it has the highest value of importance when compared with other factors. The coefficient income of the taxpayer is –2.134 in Equation (5), which indicates that a negative relationship exists between the income of the taxpayer and tax evasion. In empirical studies, the relationship between the income of the taxpayer and tax evasion is not clear. Embaye (2007) finds that the relationship between the income of the taxpayer and tax evasion is positive in the case of South Africa. The positive or negative relationship between the income of the taxpayer and tax evasion is related to the marginal utility of income. When the marginal utility of income is high, taxpayers avoid paying tax and levels of tax evasion increase, but an increase in income and a decline in the marginal utility of income lead to lower levels of tax evasion. Therefore, the high importance of this variable among other causes of tax evasion; and the negative relationship between the income of the taxpayer and tax evasion demonstrate that the income of the taxpayer has a significant effect on tax evasion.
TABLE 2. The Importance of Independent Variables
Importance Normalized Importance
Tax burden .199 88.0%
The size of government .173 76.5%
Inflation rate .200 88.3%
Trade openness .202 89.2%
Income of taxpayers .226 100.0%
Source: Calculated By Author
Note: (VAR1=tax burden, VAR2=the size of government, VAR3= inflation rate, VAR4= trade openness, VAR5= income of taxpayers)
FIGURE 3. The Normalized Importance of Independent Variable
var 5 var 4 var 3 Var 1 Var 2 0.00 0.05 0.10 0.15 0.20 0.25 Importance 0% 20% 40% 60% 80% 100% Normalized Importance
The second factor that has an important effect on tax evasion is trade openness. The normalized importance of this variable is 89.2% and, after the income of the taxpayer, has a high relative importance among the independent variables. The coefficient of this variable indicates that a negative relationship exists between trade openness and tax evasion, similar to the findings of Sameti et al. (2009) concerning the Iranian economy. Trade openness causes a rise in tax revenue and decreases tax evasion. When the economy is open, exports and imports are legal and most trades are lawful. When governments impose stricter restrictions on trade and prohibit the export and import of goods, a greater number of goods are often smuggled. Since there is no tax on illegal trade activities, tax evasion increases. Therefore, greater trade openness leads to a decrease in tax evasion.
Based on the results, another factor that has a high relative importance among the causes of tax evasion examined in the present study is inflation rate. The positive relationship between inflation and tax evasion indicates that an increase in inflation leads to higher levels of tax evasion. Inflation can influence the decision of taxpayers. When the inflation rate is high, taxpayers attempt to maintain the purchasing power of their real income by evading tax, resulting in an increase in levels of tax evasion. Crane and Nourzad (1986) and Caballe and Panade (2004) also find a positive relationship between inflation and tax evasion.
Tax burden is the fourth important cause of tax evasion. Results indicate that a positive relationship exists between tax burden and tax evasion. Taxpayers avoid paying tax and levels of tax evasion increase when tax rates for individual income; corporate income; import and export duties, tariffs and taxes; sales tax; and other kinds of tax are high. The general hypothesis is that an increase of tax burden leads to greater development and involvement in the shadow and underground markets. When people engage in activities in such markets, the levels of tax evasion increase. Brooks (2001), Savasan (2003), Dell’Anno (2007), Dell’Annoet al. (2004) and Schneider and Savasan (2007) find similar positive relationships between tax burden and underground economies.
The size of government and intensity of regulation is the final cause of tax evasion considered in the present study. The coefficient of this variable indicates that a positive relationship exists between the size of government and intensity of regulation; and tax evasion. When the size of the government increases, the control of each sector in the economy becomes increasingly difficult and levels of tax evasion increase. on the other hand, when the size of the government increases, the intensity of regulations also increases. An increase in the intensity of regulations leads to a larger informal economy, in the form of an underground or shadow economy. In such situations, levels of tax evasion will
increase. The findings in the present study support the findings of Aignet et al. (1988), Schneider and Savasan (2007) and Sameti et al. (2009) regarding the existence of a positive relationship between the size of government and intensity of regulation; and underground economies.
CoNCLUSIoN AND SUggESTIoNS
The main objective of the present study is to determine the factors that affect tax evasion and determine the relative importance of each factor based upon data on Malaysia for the period of 1963 to 2011. To achieve this aim, the artificial neural network (ANN) method is applied and multilayer perceptron (MLP) is utilized with 5 factors for
the input layer. After modeling and training the neural network and choosing the best model with minimum error, the following conclusions are made.
The income of the taxpayer is the main factor that affects tax evasion. The highest normalized importance value of this variable and existence of a negative relationship between the income of the taxpayers and tax evasion indicates that an increase in taxpayer income leads to a decline in levels of tax evasion. The second factor that has a significant effect on tax evasion is trade openness. A high normalized importance value, after the income of the taxpayer, is assigned to trade openness in relation to the other independent variables and a negative
relationship is found to exist between trade openness
and tax evasion. The implementation of strict laws and restrictions concerning trade by governments leads to an increase in the smuggling of goods and, hence, an increase in the levels of tax evasion. other important causes of tax evasion are inflation rate; tax burden; and the size of government and intensity of regulation. The results indicate that positive relationships exist between tax evasion, on one hand, and inflation rate; tax burden; and the size of government and intensity of regulation, on the other. To summarize, an increase in any of the latter variables leads to higher levels of tax evasion.
Based on the results of the present study, policy makers must consider the five (5) factors examined in the present study that are found to have significant relationships with tax evasion in order to decrease levels of tax evasion. In particular, decreasing the tax rates on individual income and corporate income, as well as duties, taxes and tariffs on exports and imports will greatly assist in the reduction of the levels of tax evasion. In addition, easing certain restrictions imposed by trade law and the intensity of regulation can also reduce levels of tax evasion. The recent approach of the Malaysian government to decrease the tax rate on income and also the duties, tariffs and taxes exports and imports, particularly as a result of free trade agreements, is in line with the strategy to reduce and eventually eliminate tax evasion.
REFERENCES
Aigner, D. J. &Schenider, F. &ghosh, D. 1988. Me and my Shadow: Estimating the Size of the U.S Hidden Economy from Time Series Data. Dynamic Econometric modeling, Proceedings of the Third International Symposium in Economic Theory and Econometrics, 297-334.
Ashraf - zadeh, H. & Mehregan, N. 2000. Estimating the Size of Underground Economic Activities in Iran, Proceedings of the Third National Conference on Smuggling goods and Ways of Controlling. Tehran: Tarbiat Modarres University, Institute of Economics, 25-44.
Bayer, R. C. 2006.A contest with the taxman – The impact of tax rates on tax evasion and wastefully invested resources.
European Economic Review 50: 1071-1104.
Bayer, R. C. & Sutter, M. 2008.The excess burden of tax evasion an experimental detection–concealment contest. European Economic Review: 1-17.
Brooks, N. 2001. Challenges of Tax Aministration and CoMPLFiance. Asian Development Bank, 1-35.
Busato, F., Chiarini, B. & Marchetti, E.2010. The relationship between tax shocks, sunspots and tax evasion. The open Economics Journa l3:14-24.
Caballe, J. & Panade, J. 2004. Inflation, tax evasion, and the distribution of consumption. Journal of Macroeconomics 26: 567–595.
Campbell, J. Y., Andrew, W. L. & Mackinlay, A. C. 1997. Econometric of Financial Market. Princeton: Princeton University Press.
Cebula, R. J. & Saadatmand, Y. 2005. Income tax evasion determinants: New evidence. Journal of American Academy of Business Cambridge 7(2): 124.
Cranea, S. E. & Nourzad, F. 1986. Inflation and tax evasion: an empirical analysis. The Review of Economics and Statistics
68(2): 217-223.
DellAnno, R. & gomez, M. & Pardo, A. 2004.Shadow Economy in Three Very Different Mediterranean Countries: France, Spain and Greece. A MIMIC Approach. Salerno: University of Salerno.
Dell Anno, R. 2007. The Shadow Economy in Portugal: An
analysis with the MIMIC Approach. Journal of Applied
Economics (2).
Dell Anno, R. & Schneider, F. 2008. The shadow economy
of italy and other OECD countries: What do we know? Journal of Public Finance and Public Choice: 1-31. Embaye, A. B. 2007. Tax evasion and government spending
in developing country and the Underground Economy in South Africa. A dissertation submitted for the degree of doctor of philosophy. Economic report book yearly, from 1963-1980.
Fu, J. 1998. A neural network forecast of economic growth and recession. The Journal Of Economics 24(1): 51-66. Fatt, C. K. & Ling, L. M. 2008. Tax Practitioners Perception on
Tax Audit and Tax Evasion: Survey Evidence in Malaysia, Proceedings of the Eighth International Business Research Conference, Dubai, EAU, 27-28 March 2008, World Business Institute.
Fishlow, A. & Friedman, J. 1994. Tax evasion, Inflation and Stabilization. Journal of Development Economics, 43: 105-123.
Fishburn, g. 1981. Tax evasion and inflation. Australian
Economic Papers 20: 325-332.
gademe, R. & Moshiri, S. 2002. Modeling and forecasting economic growth by using neural network method in Iran.
Iranian Journal of Economic Studies 12.
Hill, T. & Marquez, L. & oconnor, M. & Remus, W. 1994. Artificial neural network models for forecasting and decision making. International Journal of Forecasting
10(1): 5-15.
Hoiden, K. & Peel, D. A. & Thompson, J. L. 1990. Economic
Forecasting: An Introduction. Cambridge: Cambridge University Press.
Jain, A. K. 1987. Tax avoidance and tax evasion: The Indian case, modern Asian studies. Cambridge University Press
21(2): 233-255.
JaffarHarun, R. & Abu Bakar, M. J. & Mohd Tahir, I. 2011. Ethics on tax evasion. International Business and
Management 2(1): 122-128.
Kim, S. 2008. Does political intention affect tax evasion? Journal of Policy Modeling 30: 401-415.
Kasipillai, J. & Baldry, J. & D .S. Prasada Rao. 2000. Estimating the size and determinants of hidden income and tax evasion in Malaysia. Asian Review of Accounting 8(2): 25-42.
Kasipillai, J. & Aripin, N. & Amran, N. F. 2003. The influence of education on tax avoidance and tax evasion. E Journal of Tax Research 1(2):134.
Kohzadi, N. & Boyd, M. S., Kaastra, I. & Kermenshahi, B.S. & Scuse, D. 1995. Neural network for forecasting: An introduction.Canadian Journal of Agricultural Economics 43: 463-474.
Lapedes, A., Farber, R. 1987. Nonlinear signal processing using neural networks: prediction and system modeling. Technical Report LA-UR-87-2662, Los Alamos National Laboratory, Los Alamos, NM.
Richardson, g. 2006. Determinants of tax evasion: a cross-country investigation. J. Int. Accounting Auditing
Taxation15: 150-169.
Richardson, g. 2008. The relationship between culture and tax evasion across countries: Additional evidence and extensions. Journal of International Accounting, Auditing
and Taxation17: 67-78.
Sandmo, A. 2004. The theory of tax evasion: A retrospective view. National Tax Journal 58: 24.
Savaşan, F. 2003. Modeling the underground economy in Turkey: Randomized responseand MIMIC models. The Journal of Economics 29(1): 49-76.
Sameti, M. A. & ameti, M. o. & Dalaeemillan, A. 2009. Underground economy in Iran. International Economics Studies of Iran 35(2): 89-114.
Schneider, F. 1994. Can the shadow economy be reduced through major tax reforms? An empirical investigation for Austria.Supplement to Public Finance 49: 137-152. Schneider, F. & Savasan, F. 2007. Dymimicestimates of the size
of shadow economies of Turkey and of her neighboring countries. International Research Journal of Finance and
Economics 9:126-144.
Tanzi, V. 1980. The underground economy in the United States: Estimates and implications. Banca Nazionaledel Lavoro Quarterly Review 135: 427-53.
Tanzi, V. 1982. The Underground Economy in the United States and Abroad. Lexinton: Lexington Books.
Tanzi, V. 1983. The underground economy. Finance and
Weigend, A.S., Huberman, B. A. &Rumelhart, D. E. 1992. Predicting sunspots and exchange rates with connectionist networks. In Nonlinear Modeling and Forecasting, edited by Casdagli, M., Eubank, S. Santa Fe: Santa Fe Institute Series.
RaziehTabandeh* MansorJusoh**
Nor ghani Bin Md. Nor*** MohdAzlan Shah zaidi**** School of Economics
Faculty of Economics and Management, UniversitiKebangsaan Malaysia 43600 UKM Bangi Selangor
MALAYSIA
*[email protected] ** [email protected] ***[email protected] **** [email protected]