Research Article
Numerical Research on Performance of High-Speed
Partial Emission Pump
Qingjiao Shui ,
1Ting Jiang,
2Binghui Pan,
3Tianxing Yang,
1and Wei Pan
41Department of Mechanical Manufacturing Engineering, Lanzhou City University, Lanzhou, Gansu Province 730070, China
2Innovation Institute of Shaanxi Aerospace Power High Tech Co, Ltd, Xi’an, Shaanxi Province 710075, China
3Ineos Styrene Collar Advanced Materials (Ningbo) Co, Ltd., Ningbo, Zhejiang Province 315000, China
4Power Plant, Petro China Lanzhou Petrochemical Company, Lanzhou, Gansu Province 730060, China
Correspondence should be addressed to Qingjiao Shui; [email protected]
Received 3 November 2020; Revised 30 December 2020; Accepted 7 January 2021; Published 18 January 2021
Academic Editor: Ling Zhou
Copyright © 2021 Qingjiao Shui et al. This is an open access article distributed under the Creative Commons Attribution License, which permits unrestricted use, distribution, and reproduction in any medium, provided the original work is properly cited. The high-speed partial emission pump is a small flow and high-head pump, which has been widely used. To study the main factors affecting the performance of high-speed partial emission pumps, numerical simulation methods were used to calculate the performance parameters of high-speed partial emission pumps with and without inducers, and the external characteristic parameters were verified through comparison test values. The results show that the head of the high-speed partial emission pump with inducer is nearly 15 m higher than that of the high-speed partial emission pump without inducer. Considering the influence of air in the high-speed partial emission pump on the working performance, the two-phase flow with different flow rates, different particle sizes, and different concentrations was calculated, and the different liquid phase distributions, liquid phase velocity vector diagrams, and external characteristic curve were compared. The results show that under the same flow condition, the gas-phase particle diameter has the most severe influence on the external characteristic.
1. Introduction
Low flow rate, high head, and ultra-low specific speed centrifugal pump is always a difficult and hot topic in the field of centrifugal pump research [1, 2]. The partial emission pump, also known as a tangent pump, Sundyne pump, or Barske pump, is a high-speed centrifugal pump with a small flow and high head. Because of its high head, high efficiency, simple and compact structure, flat head curve, and other advantages, it is widely used in aerospace, petrochemical, fire protection, and other fields and has become a strong competitor of the ordinary centrifugal pump [3]. Since the partial emission pumps are often accompanied by cavitation, noise, vibration, and other problems, the research on structural optimization and cavitation performance of partial emission pumps are particularly important.
For the cavitation problem of the pump, adding an inducer is an effective optimization scheme [4, 5]. Many scholars have discussed the influence of inducer on
performance and flow field in the pump through a numerical simulation method [6, 7]. Gonzalez et al. [8] proposed some new inducer design methods to solve the cavitation problem of high-speed partial emission pumps in the study of im-peller-volute interference. Shojaeefard et al. [9] used a multiobjective optimization method to optimize the design of the key parameters of the inducer, which increased the head coefficient, hydraulic efficiency, and cavitation margin by 14.3%, 0.3%, and 30.2%, respectively. Pace et al. [10] believe that under the positive whirl ratio, the behavior of the inducer plays a leading role through the cold water test under design conditions and nondesign conditions. Kim et al. [11] found that the pump head with the largest tip clearance of the inducer was the worst under noncavitation conditions, and the backflow phenomenon appeared near the inducer casing [12, 13]. Moreover, the pump heads with different inducer tip clearances are destroyed under similar cavitation numbers. Cheng et al. [5] discussed the influence of four variable pitch inducer blades on the cavitation Volume 2021, Article ID 6697063, 11 pages
performance of high-speed centrifugal pumps. The results show that appropriately increasing the blade section incli-nation angle suppresses the cavitation of the leading edge of the blade but has almost no effect on the performance of the inducer.
It is not enough to optimize the inducer from the structure. Therefore, the study of two-phase flow can provide a basis for the optimization of the inducer and the influence on the cavitation performance [14, 15]. Karakas et al. [16] studied the effect of inducer tip clearance on the cavitation and noncavitation performance of centrifugal pumps. They found that with the increase of the tip clearance of the inducer, excessive antileakage and larger vortex recirculation appeared at the tip, which would reduce the cavitation performance. Mansour et al. [17] believe that the inducer can be mainly used for partial load and close to optimal con-ditions to improve the pumping performance of two-phase flow through the study of flow characteristics. Jiang et al. [18] used the RNGk-epsilon turbulence model and the cavitation model considering a mass transfer to simulate the cavitation performance of high-speed centrifugal pumps and specially considered the influence of temperature on the cavitation performance. Mansour et al. [19] claimed that the instal-lation of an inducer can significantly reduce the performance lag in the study of two-phase flow, and it can effectively suppress instability and reduce the surge area under over-load conditions.
In this paper, the numerical simulation results of the hydraulic performance of the pump are first verified by experiments, and the influence of the internal flow field and external characteristics of high-speed pumps with and without inducer is discussed. On this basis, the influence of bubble diameter and gas volume fraction on the internal flow field and external characteristics of the high-speed pump is analyzed. Finally, the influence of the inducer on the cavitation performance and hydraulic performance of the partial emission pump is proposed.
2. Numerical Model
The flow parts of the high-speed partial emission pump are composed of the inlet flow passage, impeller, annular flow passage, nozzle, and diffuser. The design parameters and main structural parameters of the high-speed partial emission pump studied in this paper are shown in Table 1. According to the parameters listed in Table 1, the internal flow field model of the high-speed partial emission pump was established, as shown in Figure 1.
ANSYS-ICEM is used for unstructured meshing of flow parts such as impellers, inducers, and volutes. The mesh numbers of impeller, inducer, and volute are 458805, 352123, and 512001, respectively. The SSTk−ωturbulence model was selected as the turbulence model for calculation. The main boundary conditions are as follows: velocity is adopted as the inlet boundary condition, and free flow is set as the outlet; the front and rear walls of the impeller, the wall of the volute, the walls of the inlet and outlet diversion section, and the water body were set as static walls; the wall of the impeller and the water body in the impeller were set to
rotate, and the MRF model was selected; the walls of the calculation area were set as nonslip and adiabatic walls. This paper mainly analyzed the influence of bubble diameter
D�0.01 mm, 0.1 mm, and 0.2 mm and gas volume fraction of Cv�1%, 10%, and 20% on the internal flow field and hydraulic performance of high-speed pumps. Multiple phase flow is solved by the mixture model. Considering the speed slip between phases, the finite volume method is used to transform the continuous control equations in the space domain into discrete equations. It is assumed that the ve-locity of the gas particles is consistent with the veve-locity of the main phase and the outlet flow of the calculation area has been fully developed. The solid wall of the calculation area adopts the antiskid condition. In the mixed model, the particle diameterDis adjusted by changing the particle size parameter. The volume concentration of the particles is obtained by changing the volume concentration of the particles under the inlet conditions.
3. Results and Discussion
3.1. Analysis of Single-Phase Flow. Figure 2 shows the ex-ternal characteristic curve of the high-speed partial emission pump with and without inducer. It shows that the head of the high-speed partial emission pump with inducer is 15 m higher than the head without inducer, and the efficiency is 4% higher. The difference in the head is mainly caused by the inducer. Before reaching the design condition, the curve is relatively straight. Once it exceeds the design condition, the head drops very seriously. On the flow efficiency curve, the efficiency point gradually increases from zero. The efficiency of the high-speed partial emission pump with inducer can reach 49%, which meets the design requirements. The ef-ficiency of the high-speed partial emission pump without
Table1: Geometric parameters of the high-speed partial emission
pump. Flow passage
component Variable Value
Design flow rate Qdes(m3/h) 8
Design head Hdes(m) 420
Rotational speed n(rev/min) 10400
Impeller
DiameterD2(mm) 141
Number of blades 8
Exit widthb2(mm) 13
Exit angle (°) 90
Front cone angle (°) 13.5
Inducer
Outer diameter (mm) 42.2
Number of blades 2
Inlet flow coefficient 0.086
Tip diameterDt(mm) 7.5
Installation angle of bladeβi(°) 8
Inlet wheel ratioRd1(mm) 0.186
Outlet wheel ratioRd2(mm) 0.354
Cascade consistencyτ 2.4
Volute
Inside diameter (mm) 162
Exit spread angle (°) 8
Diffusion section exit diameter
inducer can reach 45%, which still meets the design requirements.
Figures 3 and 4 show the midsection pressure distribu-tions of high-speed partial emission pumps without and with inducers when the flow was set as 0.6Q, 1.0Q, and 1.4Q. The results show that the total pressure in the middle section of the pump without an inducer is lower than that of the pump with an inducer under the three working conditions, and the cavitation area of the pump with an inducer is slightly smaller than that of the pump without inducer. The pressure grad-ually increases from the hub to the rim and the outlet, which indicates that the area of cavitation caused by the pump without the inducer is significantly larger than that with the inducer. Moreover, as the flow rate increases, the pressure on the volute wall also increases, but it is not symmetrical. Under design conditions, the symmetrical part occupies 3/4 of the area in the whole process. Under other conditions, the pressure distribution is extremely asymmetric, which can easily cause the pump body to vibrate. When the flow reaches 0.6Qand 1.4Q, the working condition of the pump body is very unsatisfactory, and the noise is very loud. The total pressure of the high-speed partial emission pump with the inducer is significantly higher than the total pressure of the pump without the inducer, and the symmetry of the fluid flow with the inducer is enhanced. This shows that the inducer not only improves the cavitation performance but also improves the internal flow of the pump. As the flow rate increases, the pressure at the end of the impeller does not change much, indicates that the flow rate has an effect on the total pressure distribution at the end of the impeller. Due to the energy release of the impeller in this area and most of the medium flows out through the nozzle as the impeller rotates, the high-pressure area near the volute nozzle area is higher than other parts of the impeller.
Figures 5 and 6 show the streamlined distribution without and with inducer at different flow rates. There is not only obvious backflow but also signs of secondary backflow in the interior without an inducer, which shows that the inducer can significantly improve the flow condition of the high-speed partial emission pump. In the high-speed partial emission pump without inducer, the secondary flow phe-nomenon becomes more serious with the increase of the flow rate. It mainly occurs in the area of the first impeller
sliding through the volute, indicating that the turbulence in this part is the strongest, which greatly affects the overall performance of the pump. With the increase of the flow rate, the internal flow of the high-speed partial emission pump becomes more turbulent, which is consistent with the sit-uation with the inducer. This shows that the overload condition has a very serious impact on the high-speed emission pump. For the high-speed partial emission pump with an inducer, it is a nozzle-type volute. With the high-speed rotation of the impeller, the medium fows out at high speed along the tangential direction of the impeller and ejects to the nozzle area of the volute. In this process, the nozzle area of the high-speed partial emission pump is an important factor. The choice of nozzle area can make the entire streamline in the best condition. After the pump has an inducer, in the design working condition, in addition to sliding through the nozzle area, the streamline distribution between the impellers is very uniform, so that the operation of the high-speed partial emission pump is optimal.
Figures 7 and 8 show the speed vector diagrams of the high-speed partial emission pumps without and with in-ducers. Figure 7 shows that there is a secondary backflow phenomenon between the impellers. However, as the flow rate increases, the velocity in the nozzle area increases significantly, and the maximum velocity is much higher than the velocity at the exit of the impeller. At the same time, the velocity of the nozzle area has a velocity direction per-pendicular to the centerline of the nozzle, and the velocity increases significantly. Figure 8 shows that the speed of the middle section is higher than that without an inducer, so the inducer can adjust the internal flow field. Under different flow rates, the internal velocity distribution tends to be uniform only at the design operating point, which is very effective to prevent the vibration of the pump body. When it deviates from the design operating point, uneven velocity distribution occurs.
3.2. Analysis of Two-Phase Flow. Figure 9 shows the char-acteristic curves of the pump under different particle sizes. Under the design conditions, the gas concentration is set to 5%, and the outer diameter of the gas particles is taken as 0.01 mm, 0.1 mm, and 0.2 mm, respectively. It shows that as
(a) (b) (c) (d)
Total pressure Contour 1 5.9e + 006 5.3e + 006 4.7e + 006 4.1e + 006 3.5e + 006 2.9e + 006 2.3e + 006 1.7e + 006 1.1e + 006 5.4e + 005 –5.6e + 004 [Pa] 0 0.04 0.02 0.080 (m) 0.060 (a) Total pressure Contour 1 5.9e + 006 5.3e + 006 4.7e + 006 4.1e + 006 3.5e + 006 2.8e + 006 2.2e + 006 1.6e + 006 9.9e + 005 3.7e + 005 –2.5e + 005 [Pa] 0 0.04 0.02 0.080 (m) 0.060 (b) Total pressure Contour 1 6.2e + 006 5.5e + 006 4.8e + 006 4.2e + 006 3.5e + 006 2.8e + 006 2.2e + 006 1.5e + 006 8.5e + 005 1.8e + 005 –4.9e + 005 [Pa] 0 0.04 0.02 0.080 (m) 0.060 (c)
Figure3: The total pressure distribution without inducer. (a)QT�0.6Q.(b)QT�Q. (c)QT�1.4Q.
Total pressure Contour 1 5.9e + 006 5.3e + 006 4.7e + 006 4.1e + 006 3.5e + 006 2.9e + 006 2.3e + 006 1.7e + 006 1.1e + 006 5.0e + 005 –9.4e + 004 [Pa] 0 0.045 0.0225 0.090 (m) 0.067 (a) Total pressure Contour 1 5.9e + 006 5.3e + 006 4.7e + 006 4.1e + 006 3.5e + 006 2.9e + 006 2.3e + 006 1.7e + 006 1.1e + 006 4.7e + 005 –1.3e + 005 [Pa] 0 0.045 0.0225 0.090 (m) 0.067 (b) Total pressure Contour 1 6.0e + 006 5.4e + 006 4.8e + 006 4.1e + 006 3.5e + 006 2.9e + 006 2.3e + 006 1.6e + 006 1.0e + 006 3.8e + 005 –2.4e + 005 [Pa] 0 0.045 0.0225 0.090 (m) 0.067 (c)
Figure4: The total pressure distribution with inducer. (a)QT�0.6Q.(b)QT�Q. (c)QT�1.4Q.
H
Pump with inducer Pump without inducer 360 390 420 450 3 6 9 12 0 Q (a) η
Pump with inducer Pump without inducer
3 6 9 12 0 Q 10 20 30 40 50 60 70 80 90 100 (b)
the particle size increases, the head dropped significantly, decreased by 70 m, and the efficiency has dropped by nearly 13%. This shows that the gas-phase particle diameter has a strong influence on external characteristics. Due to the increase of gas concentration, more and more bubbles rotate rigidly with the impeller, so that the backflow and secondary
flow are obviously enhanced, and the torque between the impellers will also increase. This is also the main reason for the decline in efficiency.
Figures 10 and 11 show the concentration distribution of the liquid phase with different particle sizes and liquid phase velocity contours under different particle sizes. The result Velocity Streamline 1 7.9e + 001 5.9e + 001 3.9e + 001 2.0e + 001 0.0e + 000 0.0225 0.045 0.090 (m) 0 0.067 [ms–1] (a) 0.0225 0.045 0.090 (m) 0 0.067 Velocity Streamline 1 7.9e + 001 5.9e + 001 3.9e + 001 2.0e + 001 0.0e + 000 [ms–1] (b) 0.0225 0.045 0.090 (m) 0 0.067 Velocity Streamline 1 7.9e + 001 5.9e + 001 3.9e + 001 2.0e + 001 0.0e + 000 [ms–1] (c)
Figure5: Streamline distribution without inducer at different flow rates. (a)QT�0.6Q.(b)QT�Q. (c)QT�1.4Q.
7.9e + 001 Velocity Streamline 5.9e + 001 3.9e + 001 2.0e + 001 0.0e + 000 [ms–1] 0 0.04 0.02 0.060 0.080 (m) (a) Velocity Streamline 7.9e + 001 5.9e + 001 3.9e + 001 2.0e + 001 0.0e + 000 [ms–1] 0 0.04 0.02 0.060 0.080 (m) (b) Velocity Streamline 7.9e + 001 5.9e + 001 4.0e + 001 2.0e + 001 0.0e + 000 [ms–1] 0 0.04 0.02 0.060 0.080 (m) (c)
Figure6: Streamline distribution with inducer at different flow rates. (a)QT�0.6Q.(b)QT�Q. (c)QT�1.4Q.
Velocity Vector 1 7.9e + 001 5.9e + 001 3.9e + 001 2.0e + 001 0.0e + 000 [ms–1] 0 0.050 0.025 0.075 0.100 (m) (a) Velocity Vector 1 7.9e + 001 5.9e + 001 3.9e + 001 2.0e + 001 0.0e + 000 [ms–1] 0 0.045 0.0225 0.067 0.090 (m) (b) 0 0.045 0.0225 0.067 0.090 (m) Velocity Vector 1 7.9e + 001 5.9e + 001 3.9e + 001 2.0e + 001 0.0e + 000 [ms–1] (c)
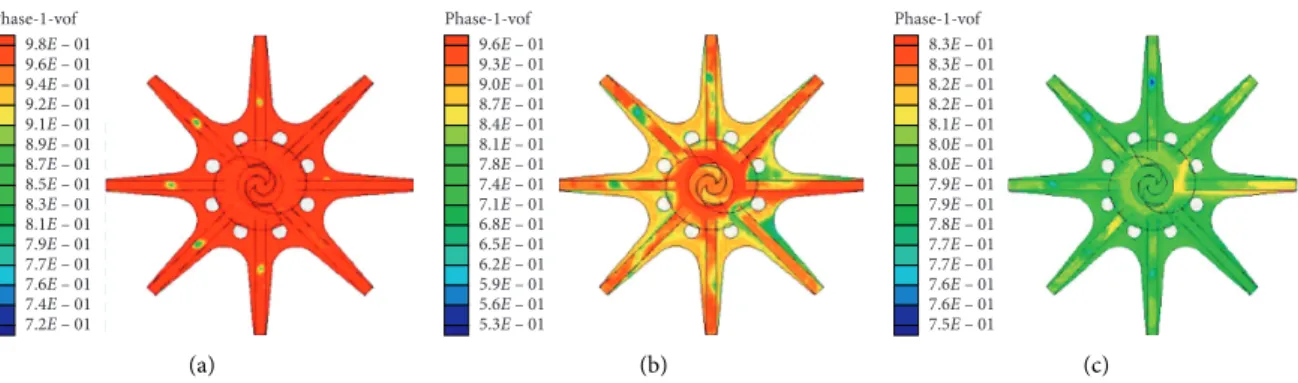
shows that the gas-particle diameter and outer diameter have a great influence on the distribution of the liquid phase in the impeller and the movement of liquid phase particles. As the particle size increases, the particle concentration on the blade working surface increases significantly. At the same time, the volume concentration of the liquid phase increases, and the gas-phase distribution becomes smaller. Due to the increase of the particle size, the liquid phase reflux between the impellers is strengthened, which causes part of the particles entering the impeller channel to reflux between the impellers. Figure 11 shows that the smaller the particle size, the smaller the force of inertial force on the particles. Under the action of centrifugal force, small particles outflow more than large particles. As the particle size increases, the water head decreases and the efficiency decreases.
Figure 12 shows the external characteristic curve of the pump under different gas concentrations. With the increase of gas-phase concentration, the head decreases, but it is not so drastic. BetweenCv�1% andCv�20%, the head drops by 30m, which is not as obvious as the change between
particles. It indicates that the influence of gas concentration on the head is not very significant. And the efficiency changes with the gas concentration is 7%. The main reason is the internal flow field caused by the change of the gas concentration. It can be seen from the streamline cloud chart that the change in concentration from 10% to 20% is not very significant, so the change of efficiency and head with gas concentration is not very obvious.
Figure 13 shows the distribution of liquid phase con-centration distribution at different flow rates (0.6Q,Q, 1.4
Q). It shows that the flow change has a significant impact on the movement and distribution of particles. At 1.4 Q, the particle concentration distribution of the liquid phase is higher than that at other flow rates, and the area of high concentration distribution in the flow channel is larger. This is because the backflow movement of the liquid phase be-tween the impellers at different flow rates increases with the increase in flow rate. The internal eddy current is more serious. In Figure 14, the backflow between the impellers is very violent when the flow rate is large. At other phase
0 0.04 0.02 0.060 0.080 (m) Velocity Vector 1 7.9e + 001 5.9e + 001 3.9e + 001 2.0e + 001 0.0e + 000 [ms–1] (a) 0 0.04 0.02 0.060 0.080 (m) Velocity Vector 1 [ms–1] 7.9e + 001 5.9e + 001 3.9e + 001 2.0e + 001 0.0e + 000 (b) 0 0.04 0.02 0.060 0.080 (m) Velocity Vector 1 [ms–1] 7.9e + 001 5.9e + 001 4.0e + 001 2.0e + 001 0.0e + 000 (c)
Figure8: The vector distribution with inducer at different flow rates (a)QT�0.6Q.(b)QT�Q. (c)QT�1.4Q.
320 340 360 380 400 H ead H / (m) 0.05 0.10 0.15 0.20 0.00 Particle diameter/ (mm) (a) 32 34 36 38 40 42 44 46 48 50 Ef ficienc y η / (%) 0.05 0.10 0.15 0.20 0.00 Particle diameter/ (mm) (b)
Figure9: Characteristic curves of different particle sizes. (a) Influence of particle size on pump head. (b) Influence of particle diameter on
9.6E – 01 Phase-1-vof 9.6E – 01 9.6E – 01 9.5E – 01 9.5E – 01 9.5E – 01 9.5E – 01 9.5E – 01 9.4E – 01 9.4E – 01 9.4E – 01 9.4E – 01 9.4E – 01 9.3E – 01 9.3E – 01 (a) 9.7E – 01 Phase-1-vof 9.4E – 01 9.1E – 01 8.8E – 01 8.5E – 01 8.2E – 01 7.9E – 01 7.6E – 01 7.3E – 01 7.0E – 01 6.7E – 01 6.4E – 01 6.1E – 01 5.8E – 01 5.5E – 01 (b) 9.5E – 01 Phase-1-vof 9.1E – 01 8.6E – 01 8.1E – 01 7.7E – 01 7.2E – 01 6.7E – 01 6.3E – 01 5.8E – 01 5.3E – 01 4.9E – 01 4.4E – 01 4.0E – 01 3.5E – 01 3.0E – 01 (c)
Figure10: Concentration distribution of the liquid phase of different particle size. (a)D�0.01. (b)D�0.1. (c)D�0.2.
Phase-1-velocity-magnitude 72 66 61 55 50 44 38 33 27 22 16 10 5 (a) Phase-1-velocity-magnitude 74 68 62 57 51 45 40 34 28 23 17 11 6 (b) Phase-1-velocity-magnitude 71 66 60 55 49 44 38 33 27 22 16 11 5 (c)
Figure11: Liquid phase velocity distribution of different particle sizes. (a)D�0.01. (b)D�0.1. (c)D�0.2.
340 350 360 370 380 H ead H / (m) 0.05 0.10 0.15 0.20 0.00 Gas concentration Cv/ (%) (a) 38 40 42 44 46 48 Ef ficienc y η / (%) 0.05 0.10 0.15 0.20 0.00 Gas concentration Cv/ (%) (b)
Figure12: The external characteristics change under different volume fractions. (a) The effect of concentration on the head. (b) The effect of
angles, since the backflow between the working surface and the rear of the impeller is very obvious under high flow conditions, the liquid phase distribution is very obvious and more uniform, and the concentration is much larger. In the design conditions, the backflow between the impellers is not so serious; thus, the liquid phase is distributed on the back of the impeller more than on the working surface.
Figure 15 shows that as the concentration of the gas phase increases, the distribution and the concentration of the liquid phase continues to decrease, which indirectly affects the changes in external characteristics. This shows that because the gas-liquid mixed medium in the impeller is affected by the rotating centrifugal force and the wake, the liquid phase is distributed close to the impeller, causing the bubbles to continue to hit the working surface of the im-peller, thus forming a phenomenon that the concentration is higher than in other regions. Figure 16 shows that as the volume concentration of the gas phase increases, the reflux of the gas phase between the impellers becomes more in-tense. The main reason is the concentration increases.
3.3. Experimental Verification. The test setup is shown in Figure 17. Control valves are installed at the inlet and outlet of the steady flow storage tank. According to the experi-mental standards of the pump, if the length of the inlet pipe allows, the inlet measurement section should generally be set at a distance of 2 times the pipe diameter from the pump inlet flange. At the upstream of the flow meter, the setting of the outlet measurement section is the same as that of the inlet. For the electromagnetic flow meter, it is required to have a straight pipe length of 5 times or more before the flow-meter inlet, the inlet measurement section of this test bench is set at 3 times the pipe diameter from the inlet flange, and the outlet measurement section is set at 4 times the pipe diameter from the inlet flange. There is a straight pipe with a length of more than 10 times the pipe diameter. In this experiment, a pressure-taking hole is opened at the inlet and outlet pressure measurement section of the pump, and the pressure is perpendicular to the plane of the volute of the pump, partial flow pump inlet pipe diameter V: 50 mm, outlet pipe diameterV: 50 mm, and the pipe diameter of the
9.7E – 01 Phase-1-vof 9.4E – 01 9.1E – 01 8.8E – 01 8.5E – 01 8.2E – 01 7.9E – 01 7.6E – 01 7.3E – 01 7.0E – 01 6.7E – 01 6.4E – 01 6.1E – 01 5.8E – 01 5.5E – 01 (a) 9.7E – 01 Phase-1-vof 9.3E – 01 9.0E – 01 8.7E – 01 8.3E – 01 8.0E – 01 7.6E – 01 7.3E – 01 7.0E – 01 6.6E – 01 6.3E – 01 6.0E – 01 5.6E – 01 5.3E – 01 5.0E – 01 (b) 9.8E – 01 Phase-1-vof 9.6E – 01 9.3E – 01 9.1E – 01 8.9E – 01 8.7E – 01 8.5E – 01 8.2E – 01 8.0E – 01 7.8E – 01 7.6E – 01 7.4E – 01 7.2E – 01 6.9E – 01 6.7E – 01 (c)
Figure13: Liquid phase distribution under different flow rates. (a)QT�0.6Q. (b)QT�Q. (c)QT�1.4Q.
7.9e + 001 Phase 1.velocity Vector 1 5.9e + 001 3.9e + 001 2.0e + 001 0.0e + 000 0 0.045 0.0225 0.067 Y X Z 0.090 (m) [ms–1] (a) Y X Z 0 0.04 0.02 0.060 0.080 (m) [ms–1] 7.9e + 001 Phase 1.velocity Vector 1 6.6e + 001 5.3e + 001 3.9e + 001 2.6e + 001 1.3e + 001 0.0e + 000 (b) Y X Z 0 0.04 0.02 0.060 0.080 (m) [ms–1] 7.9e + 001 Phase 1.velocity Vector 1 5.9e + 001 3.9e + 001 2.0e + 001 0.0e + 000 (c)
pipe section where the electromagnetic flow meter is located V: 100 mm, using a reducing pipe (inletV: 50 mm, outletV: 100 mm) to connect different pipe diameters of pipeline.
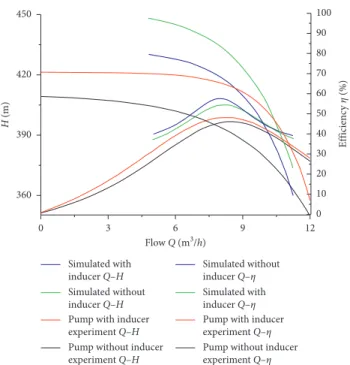
Figure 18 shows a comparison of experimental and simulation results. It shows that the simulated head is generally 18 m higher than the test head at the design
operating point, which meets the requirements of numerical simulation. The error range is 5%, and the efficiency error is also 5%. However, in the numerical simulation, the efficiency of a high-speed pump with an inducer is 2% lower than that without an inducer. The main reason for this is that the inducer increases torque, which reduces efficiency.
0 0.04 0.02 0.060 0.080 (m) [ms–1] 7.9e + 001 Phase 2.velocity Streamline 1 5.9e + 001 3.9e + 001 2.0e + 001 0.0e + 000 (a) 0 0.04 0.02 0.060 0.080 (m) [ms–1] 7.9e + 001 Phase 2.velocity Streamline 1 5.9e + 001 3.9e + 001 2.0e + 001 0.0e + 000 (b) 0 0.04 0.02 0.060 0.080 (m) [ms–1] 7.9e + 001 Phase 2.velocity Streamline 1 5.9e + 001 3.9e + 001 2.0e + 001 0.0e + 000 (c)
Figure16: Gas streamline distribution with different gas concentrations. (a)Cv�1%. (b)Cv�10%. (c)Cv�20%.
Power supply
Steady flow storage tank l1 l2 l3 1 2 3 Flowmeter DN50 DN50 DN100 4 5 6
Figure17: Piping diagram of the experimental platform. 1, inlet control valve; 2, outlet control valve; 3, outlet pressure gauge; 4, high-speed
partial emission pump; 5, inlet pressure gauge; 6, flow valve.
9.8E – 01 Phase-1-vof 9.6E – 01 9.4E – 01 9.2E – 01 9.1E – 01 8.9E – 01 8.7E – 01 8.5E – 01 8.3E – 01 8.1E – 01 7.9E – 01 7.7E – 01 7.6E – 01 7.4E – 01 7.2E – 01 (a) 9.6E – 01 Phase-1-vof 9.3E – 01 9.0E – 01 8.7E – 01 8.4E – 01 8.1E – 01 7.8E – 01 7.4E – 01 7.1E – 01 6.8E – 01 6.5E – 01 6.2E – 01 5.9E – 01 5.6E – 01 5.3E – 01 (b) 8.3E – 01 Phase-1-vof 8.3E – 01 8.2E – 01 8.2E – 01 8.1E – 01 8.0E – 01 8.0E – 01 7.9E – 01 7.9E – 01 7.8E – 01 7.7E – 01 7.7E – 01 7.6E – 01 7.6E – 01 7.5E – 01 (c)
4. Conclusions
The methods of experiment and numerical simulation are used to compare and analyze the external characteristic curves of high-speed partial emission pumps with or without inducer. The influence of inducers on the external charac-teristics is summarized. A steady analysis was made to compare the static pressure and velocity vector diagrams. The results show that the head of the high-speed partial emission pump with inducer is nearly 15 m higher than which without inducer, and the efficiency is 7% higher.
Because the high-speed partial emission pump is usually used in the working conditions of high temperature and high pressure, there are often two-phase gas-liquid flows. Therefore, the mixture model method was used to calculate different flow rates and different particles. For two-phase flow with different gas diameters and different gas con-centrations, the distribution of different liquid phases, liquid phase velocity vector diagrams, and external characteristic curves were compared to explain the influence of these factors on the external characteristics. The calculation result shows that the meteorological particle diameter has the greatest influence on the external characteristics under the same flow conditions.
Notations
b2: Exit width of impeller (mm) b3: Width of the annular volute (mm) dk: Outlet diameter of the diffuser (mm) dt: Diameter of the circular nozzle (mm)
D2: Diameter of Impeller (mm) Dt: Tip diameter (mm)
D3: Inside diameter of volute (mm)
H: Head (m)
Hdes: Design head (m) n: Rotational speed (r/min) Q: Volume flow rate(m3/h) Qdes: Design flow rate(m3/h) Qqo: Outlet flow(m3/h)
Rd1: Inlet wheel ratio of inducer (mm) Rd2: Outlet wheel ratio of inducer (mm) R3: Radius of the annular volute (mm)
βi: Installation angle of blades (°)
ω: Angular velocity of the impeller rotation (rad/s).
Data Availability
The data used to support the findings of this study are in-cluded within the article.
Conflicts of Interest
The authors declare that they have no conflicts of interest.
References
[1] G. Lu, Z. Zuo, D. Liu, and S. Liu, “Energy balance and local unsteady loss analysis of flows in a low specific speed model pump-turbine in the positive slope region on the pump
performance curve,”Energies, vol. 12, no. 10, p. 1829, 2019.
[2] B. Yang, B. Li, H. Chen, and Z. Liu, “Entropy production analysis for the clocking effect between inducer and impeller
in a high-speed centrifugal pump,” Journal of Mechanical
Engineering Science, vol. 233, no. 15, pp. 5302–5315, 2019.
[3] L. P. Chai, B. H. Pan, H. X. Shi, J. Wang, and M. K. Huang, “CFD calculation and optimal design of high-speed partial
mission pump,”Journal of Drainage and Irrigation Machinery
Engineering, vol. 28, pp. 211–214, 2010.
[4] H. Quan, J. Cheng, Y. Guo, L. Kang, and G. Peng, “Influence of screw centrifugal inducer on internal flow structure of
vortex pump,”Journal of Fluids Engineering-Transactions of
the ASME, vol. 142, no. 9, p. 091203, 2020.
[5] X. R. Cheng, Z. B. Chang, and Y. M. Jiang, “Study on the influence of the specific area of balance hole on cavitation
performance of high- speed centrifugal pump,” Journal of
Mechanical Science and Technology, vol. 34, no. 8, pp. 3325–
3334, 2020.
[6] K. Majidi, “Numerical study of unsteady flow in a centrifugal
pump,”ASME Journal of Turbo Machinery, vol. 127, no. 2,
pp. 363–371, 2005.
[7] J.-S. Choi, D. K. McLaughlin, and D. E. Thompson, “Ex-periments on the unsteady flow field and noise generation in a
centrifugal pump impeller,”Journal of Sound and Vibration,
vol. 263, no. 5, pp. 493–514, 2003.
[8] J. Gonzalez, J. Fernandez, E. Blanco, and C. Santolaria, “Numerical simulation of the dynamic effect due to
impeller-volute interaction in a centrifugal pump,”ASME Journal of
Fluid Engineering, vol. 124, no. 6, pp. 349–355, 2002.
[9] M. H. Shojaeefard, S. E. Hosseini, and J. Zare, “CFD simu-lation and Pareto-based multi-objective shape optimization of the centrifugal pump inducer applying GMDH neural
net-work, modified NSGA-II, and TOPSIS,” Structural and
Multidisciplinary Optimization, vol. 60, no. 4, pp. 1509–1525,
2019.
[10] G. Pace, D. Valentini, A. Pasini, L. Torre, R. Hadavandi, and L. d’Agostino, “Inducer and centrifugal pump contributions
450 100 90 80 70 60 50 Ef ficienc y η (%) 40 30 20 10 0 420 390 H (m) 360 0 3 6 Flow Q (m3/h) 9 12 Simulated with inducer Q–H Pump with inducer experiment Q–H Pump without inducer experiment Q–H Simulated without inducer Q–H
Simulated without inducer Q–η Pump with inducer experiment Q–η Pump without inducer experiment Q–η Simulated with inducer Q–η
to the rotordynamic fluid forces acting on a space
turbo-pump,” Journal of Fluids Engineering-Transactions of the
ASME, vol. 140, no. 2, p. 10, 2018.
[11] C. Kim, S. Kim, C. H. Choi, and J. Baek, “Effects of inducer tip clearance on the performance and flow characteristics of a
pump in a turbopump,” Proceedings of the Institution of
Mechanical Engineers, Part A: Journal of Power and Energy,
vol. 231, no. 5, pp. 398–414, 2017.
[12] Y. Liu and L. Tan, “Tip clearance on pressure fluctuation intensity and vortex characteristic of a mixed flow pump as
turbine at pump mode,” Renewable Energy, vol. 129,
pp. 606–615, 2018.
[13] Y. Hao and L. Tan, “Symmetrical and unsymmetrical tip clearances on cavitation performance and radial force of a
mixed flow pump as turbine at pump mode,” Renewable
Energy, vol. 127, pp. 368–376, 2018.
[14] X. R. Cheng and A. M. Zhang, “Effect of axial matching between inducer and centrifugal pump suction chamber on
cavitation performance,” Proceedings of the Institution of
Mechanical Engineers, Part A: Journal of Power and Energy,
vol. 234, no. 7, pp. 947–956, 2020.
[15] W. Yang, R. Xiao, F. Wang, and Y. Wu, “Influence of splitter blades on the cavitation performance of a double suction
centrifugal pump,” Advances in Mechanical Engineering,
vol. 6, p. 963197, 2014.
[16] E. S. Karakas, H. Watanabe, M. Aureli, and C. A. Evrensel, “Cavitation performance of constant and variable pitch helical inducers for centrifugal pumps: effect of inducer tip
clear-ance,”Journal of Fluids Engineering-Transactions of the ASME,
vol. 142, no. 2, p. 19, 2020.
[17] M. Mansour, T. Parikh, S. Engel, and D. Thevenin, “Numerical investigations of gas-liquid two-phase flow in a pump
in-ducer,” Journal of Fluids Engineering-Transactions of the
ASME, vol. 142, no. 2, p. 12, 2020.
[18] J. Jiang, Y. H. Li, C. Y. Pei et al., “Cavitation performance of high-speed centrifugal pump with annular jet and inducer at
different temperatures and void fractions,” Journal of
Hy-drodynamics, vol. 31, no. 1, pp. 93–101, 2019.
[19] M. Mansour, B. Wunderlich, and D. Thevenin, “Effect of tip clearance gap and inducer on the transport of two-phase
air-water flows by centrifugal pumps,”Experimental Thermal and