Anomaly Detection of Web-based Attacks
Christopher Kruegel
Giovanni Vigna
Reliable Software GroupUniversity of California, Santa Barbara Santa Barbara, CA 93106
ABSTRACT
Web-based vulnerabilities represent a substantial portion of the security exposures of computer networks. In order to de-tect known web-based attacks, misuse dede-tection systems are equipped with a large number of signatures. Unfortunately, it is difficult to keep up with the daily disclosure of web-related vulnerabilities, and, in addition, vulnerabilities may be intro-duced by installation-specific web-based applications. There-fore, misuse detection systems should be complemented with anomaly detection systems. This paper presents an intrusion detection system that uses a number of different anomaly de-tection techniques to detect attacks against web servers and web-based applications. The system correlates the server-side programs referenced by client queries with the parameters contained in these queries. The application-specific charac-teristics of the parameters allow the system to perform fo-cused analysis and produce a reduced number of false posi-tives. The system derives automatically the parameter pro-files associated with web applications (e.g., length and struc-ture of parameters) from the analyzed data. Therefore, it can be deployed in very different application environments without having to perform time-consuming tuning and con-figuration.
Categories and Subject Descriptors
D.4.6 [Operating Systems]: Security and Protection
General Terms
Security
Keywords
Anomaly Detection, World-Wide Web, Network Security
1.
INTRODUCTION
Web servers and web-based applications are popular at-tack targets. Web servers are usually accessible through cor-porate firewalls, and web-based applications are often
devel-Permission to make digital or hard copies of all or part of this work for personal or classroom use is granted without fee provided that copies are not made or distributed for profit or commercial advantage and that copies bear this notice and the full citation on the first page. To copy otherwise, to republish, to post on servers or to redistribute to lists, requires prior specific permission and/or a fee.
CCS’03, October 27–31, 2003, Washington, DC, USA.
Copyright 2003 ACM 1-58113-738-9/03/0010 ...$5.00.
oped without following a sound security methodology. At-tacks that exploit web servers or server extensions (e.g., pro-grams invoked through the Common Gateway Interface [7] and Active Server Pages [22]) represent a substantial por-tion of the total number of vulnerabilities. For example, in the period between April 2001 and March 2002, web-related vulnerabilities accounted for 23% of the total number of vul-nerabilities disclosed [34]. In addition, the large installation base makes both web applications and servers a privileged target for worm programs that exploit web-related vulnera-bilities to spread across networks [5].
To detect web-based attacks, intrusion detection systems (IDSs) are configured with a number of signatures that sup-port the detection of known attacks. For example, at the time of writing, Snort 2.0 [28] devotes 868 of its 1931 signatures to detect web-related attacks. Unfortunately, it is hard to keep intrusion detection signature sets updated with respect to the large numbers of vulnerabilities discovered daily. In addition, vulnerabilities may be introduced by custom web-based applications developed in-house. Developing ad hoc
signatures to detect attacks against these applications is a time-intensive and error-prone activity that requires substan-tial security expertise.
To overcome these issues, misuse detection systems should be composed with anomaly detection systems, which sup-port the detection of new attacks. In addition, anomaly detection systems can be trained to detect attacks against custom-developed web-based applications. Unfortunately, to the best of our knowledge, there are no available anomaly de-tection systems tailored to detect attacks against web servers and web-based applications.
This paper presents an anomaly detection system that de-tects web-based attacks using a number of different tech-niques. The anomaly detection system takes as input the web server log files which conform to the Common Log For-mat and produces an anomaly score for each web request. More precisely, the analysis techniques used by the tool take advantage of the particular structure of HTTP queries [11] that contain parameters. The parameters of the queries are compared with established profiles that are specific to the program or active document being referenced. This approach supports a more focused analysis with respect to generic anomaly detection techniques that do not take into account the specific program being invoked.
This paper is structured as follows. Section 2 presents re-lated work on detection of web-based attacks and anomaly detection in general. Section 3 describes an abstract model for the data analyzed by our intrusion detection system. tion 4 presents the anomaly detection techniques used. Sec-tion 5 contains the experimental evaluaSec-tion of the system
with respect to real-world data and discusses the results ob-tained so far and the limitations of the approach. Finally, Section 6 draws conclusions and outlines future work.
2.
RELATED WORK
Anomaly detection relies on models of the intended behav-ior of users and applications and interprets deviations from this ‘normal’ behavior as evidence of malicious activity [10, 17, 13, 19]. This approach is complementary with respect to misuse detection, where a number of attack descriptions (usually in the form of signatures) are matched against the stream of audited events, looking for evidence that one of the modeled attacks is occurring [14, 25, 23].
A basic assumption underlying anomaly detection is that attack patterns differ from normal behavior. In addition, anomaly detection assumes that this ‘difference’ can be ex-pressed quantitatively. Under these assumptions, many tech-niques have been proposed to analyze different data streams, such as data mining for network traffic [21], statistical analy-sis for audit records [16], and sequence analyanaly-sis for operating system calls [12].
Of particular relevance to the work described here are tech-niques that learn the detection parameters from the ana-lyzed data. For instance, the framework developed by Lee et al. [20] provides guidelines to extract features that are useful for building intrusion classification models. The approach uses labeled data to derive which is the best set of features to be used in intrusion detection.
The approach described in this paper is similar to Lee’s because it relies on a set of selected features to perform both classification and link analysis on the data. On the other hand, the approach is different because it does not rely on the labeling of attacks in the training data in order to derive either the features or the threshold values used for detection. The learning process is purely based on past data, as, for example, in [18].
3.
DATA MODEL
Our anomaly detection approach analyzes HTTP requests as logged by most common web servers (for example, Apache [2]). More specifically, the analysis focuses onGET requests that use parameters to pass values to server-side programs or active documents. Neither header data of GETrequests nor
POST/HEADrequests are taken into account. Note, however, that it is straightforward to include the parameters of these requests. This is planned for future work.
More formally, the input to the detection process consists of an ordered setU ={u1, u2, ..., um}of URIs extracted from
successfulGET requests, that is, requests whose return code is greater or equal to 200 and less than 300.
A URIuican be expressed as the composition of the path
to the desired resource (pathi), an optional path information component (pinfoi), and an optional query string (q). The
query string is used to pass parameters to the referenced resource and it is identified by a leading ‘?’ character. A query string consists of an ordered list ofnpairs of param-eters (or attributes) with their corresponding values. That is,q = (a1, v1),(a2, v2), . . . ,(an, vn) whereai∈A, the set of
all attributes, andviis a string. The setSqis defined as the
subset{aj, . . . , ak}of attributes of queryq. Figure 1 shows
an example of an entry from a web server log and the cor-responding elements that are used in the analysis. For this example queryq,Sq={a1, a2}.
The analysis process focuses on the association between programs, parameters, and their values. URIs that do not contain a query string are irrelevant, and, therefore, they are removed fromU. In addition, the set of URIsUis partitioned into subsets Ur according to the resource path. Therefore,
each referred programr is assigned a set of corresponding queries Ur. The anomaly detection algorithms are run on
each set of queriesUr, independently. This means that the
modeling and the detection process are performed separately for each programr.
In the following text, the term ‘request’ refers only to re-quests with queries. Also, the terms ‘parameter’ and ‘at-tribute’ of a query are used interchangeably.
4.
DETECTION MODELS
The anomaly detection process uses a number of different models to identify anomalous entries within a set of input requestsUr associated with a programr. A model is a set
of procedures used to evaluate a certain feature of a query attribute (e.g., the string length of an attribute value) or a certain feature of the query as a whole (e.g., the presence and absence of a particular attribute). Each model is associated with an attribute (or a set of attributes) of a program by means of a profile. Consider, for example, the string length model for the username attribute of a login program. In this case, the profile for the string length model captures the ‘normal’ string length of the user name attribute of the login program.
The task of a model is to assign a probability value to either a query or one of the query’s attributes. This proba-bility value reflects the probaproba-bility of the occurrence of the given feature value with regards to an established profile. The assumption is that feature values with a sufficiently low probability (i.e., abnormal values) indicate a potential at-tack.
Based on the model outputs (i.e., the probability values of the query and its individual attributes), a decision is made – that is, the query is either reported as a potential attack or as normal. This decision is reached by calculating an anomaly score individually for each query attribute and for the query as a whole. When one or more anomaly scores (either for the query or for one of its attributes) exceed the detection threshold determined during the training phase (see below), the whole query is marked as anomalous. This is necessary to prevent attackers from hiding a single malicious attribute in a query with many ‘normal’ attributes.
The anomaly scores for a query and its attributes are de-rived from the probability values returned by the correspond-ing models that are associated with the query or one of the attributes. The anomaly score value is calculated using a weighted sum as shown in Equation 1. In this equation,wm
represents the weight associated with modelm, while pm is
its returned probability value. The probability pm is
sub-tracted from 1 because a value close to zero indicates an anomalous event that should yield a high anomaly score.
Anomaly Score =
m∈Models
wm∗(1−pm) (1)
A model can operate in one of two modes, training or de-tection. The training phase is required to determine the char-acteristics of normal events (that is, the profile of a feature according to a specific model) and to establish anomaly score thresholds to distinguish between regular and anomalous
in-169.229.60.105 − johndoe [6/Nov/2002:23:59:59 −0800 "GET /scripts/access.pl?user=johndoe&cred=admin" 200 2122
path a = v1 1 a = v2 2
q
Figure 1: Sample Web Server Access Log Entry
puts. This phase is divided into two steps. During the first step, the system creates profiles for each server-side program and its attributes. During the second step, suitable thresh-olds are established. This is done by evaluating queries and their attributes using the profiles created during the previ-ous step. For each program and its attributes, the highest anomaly score is stored and then, the threshold is set to a value that is a certain, adjustable percentage higher than this maximum. The default setting for this percentage (also used for our experiments) is 10%. By modifying this value, the user can adjust the sensitivity of the system and perform a trade-off between the number of false positives and the ex-pected detection accuracy. The length of the training phase (i.e., the number of queries and attributes that are utilized to establish the profiles and the thresholds) is determined by an adjustable parameter.
Once the profiles have been created – that is, the models have learned the characteristics of normal events and suit-able thresholds have been derived – the system switches to detection mode. In this mode, anomaly scores are calculated and anomalous queries are reported.
The following sections describe the algorithms that ana-lyze the features that are considered relevant for detecting malicious activity. For each algorithm, an explanation of the model creation process (i.e., the learning phase) is included. In addition, the mechanism to derive a probability valuepfor a new input element (i.e., the detection phase) is discussed.
4.1
Attribute Length
In many cases, the length of a query attribute can be used to detect anomalous requests. Usually, parameters are either fixed-size tokens (such as session identifiers) or short strings derived from human input (such as fields in an HTML form). Therefore, the length of the parameter values does not vary much between requests associated with a certain program. The situation may look different when malicious input is passed to the program. For example, to overflow a buffer in a target application, it is necessary to ship the shell code and additional padding, depending on the length of the tar-get buffer. As a consequence, the attribute contains up to several hundred bytes.
The goal of this model is to approximate the actual but unknown distribution of the parameter lengths and detect instances that significantly deviate from the observed normal behavior. Clearly, we cannot expect that the probability density function of the underlying real distribution will follow a smooth curve. We also have to assume that the distribution has a large variance. Nevertheless, the model should be able to identify significant deviations.
4.1.1
Learning
We approximate the mean ˙µand the variance ˙σ2of the real
attribute length distribution by calculating the sample mean
µand the sample varianceσ2 for the lengthsl1, l2, . . . , ln of
the parameters processed during the learning phase (assum-ing thatnqueries with this attribute were processed).
4.1.2
Detection
Given the estimated query attribute length distribution with parameters µ and σ2 as determined by the previous learning phase, it is the task of the detection phase to assess the regularity of a parameter with lengthl.
The probability oflcan be calculated using the Chebyshev inequality shown below.
p(|x−µ|> t)< σ
2
t2 (2)
The Chebyshev inequality puts an upper bound on the probability that the difference between the value of a ran-dom variablex andµ exceeds a certain threshold t, for an arbitrary distribution with varianceσ2 and mean µ. This upper bound is strict and has the advantage that is does not assume a certain underlying distribution. We substitute the threshold t with the distance between the attribute length
l and the mean µ of the attribute length distribution (i.e.,
|l−µ|). This allows us to obtain an upper bound on the prob-ability that the length of the parameter deviates more from the mean than the current instance. The resulting probabil-ity valuep(l) for an attribute with lengthl is calculated as shown below.
p(|x−µ|>|l−µ|)< p(l) = σ
2
(l−µ)2 (3)
This is the value returned by the model when operating in detection mode. The Chebyshev inequality is independent of the underlying distribution and its computed bound is, in general, very weak. Applied to our model, this weak bound results in a high degree of tolerance to deviations of attribute lengths given an empirical mean and variance. Although such a property is undesirable in many situations, by using this technique only obvious outliers are flagged as suspicious, leading to a reduced number of false alarms.
4.2
Attribute Character Distribution
The attribute character distribution model captures the concept of a ‘normal’ or ‘regular’ query parameter by look-ing at its character distribution. The approach is based on the observation that attributes have a regular structure, are mostly human-readable, and almost always contain only printable characters.
A large percentage of characters in such attributes are drawn from a small subset of the 256 possible 8-bit values (mainly from letters, numbers, and a few special charac-ters). As in English text, the characters are not uniformly distributed, but occur with different frequencies. Obviously, it cannot be expected that the frequency distribution is iden-tical to a standard English text. Even the frequency of a cer-tain character (e.g., the frequency of the letter ‘e’) varies con-siderably between different attributes. Nevertheless, there are similarities between the character frequencies of query parameters. This becomes apparent when the relative
fre-quencies of all possible 256 characters are sorted in descend-ing order.
The algorithm is based only on the frequency values them-selves and does not rely on the distributions of particular characters. That is, it does not matter whether the character with the most occurrences is an ‘a’ or a ‘/’. In the following, the sorted, relative character frequencies of an attribute are called itscharacter distribution.
For example, consider the parameter string ‘passwd’ with the corresponding ASCII values of ‘112 97 115 115 119 100’. The absolute frequency distribution is 2 for 115 and 1 for the four others. When these absolute counts are transformed into sorted, relative frequencies (i.e., the character distribution), the resulting values are 0.33, 0.17, 0.17, 0.17, 0.17 followed by 0 occurring 251 times.
For an attribute of a legitimate query, one can expect that the relative frequencies slowly decrease in value. In case of malicious input, however, the frequencies can drop extremely fast (because of a peak caused by a single character with a very high frequency) or nearly not at all (in case of random values).
The character distribution of an attribute that is perfectly normal (i.e., non-anomalous) is called the attribute’s ideal-ized character distribution (ICD). The idealized character distribution is a discrete distribution with:
ICD: 7→ with ={n∈ N |0≤n≤255}, ={p∈
|0≤p≤1}and 255
i=0ICD(i) = 1.0.
The relative frequency of the character that occurs n-most often (0-most denoting the maximum) is given as ICD(n). When the character distribution of the sample parameter ‘passwd’ is interpreted as the idealized character distribution, thenICD(0) = 0.33 andICD(1) toICD(4) are equal to 0.17. In contrast to signature-based approaches, this model has the advantage that it cannot be evaded by some well-known attempts to hide malicious code inside a string. In fact, signature-based systems often contain rules that raise an alarm when long sequences of 0x90 bytes (thenopoperation in Intel x86-based architectures) are detected in a packet. An intruder may substitute these sequences with instructions that have a similar behavior (e.g.,add rA,rA,0, which adds 0 to the value in register A and stores the result back to A). By doing this, it is possible to prevent signature-based sys-tems from detecting the attack. Such sequences, nonetheless, cause a distortion of the attribute’s character distribution, and, therefore, the character distribution analysis still yields a high anomaly score. In addition, characters in malicious in-put are sometimes disguised byxor’ing them with constants or shifting them by a fixed value (e.g., using the ROT-13 code). In this case, the payload only contains a small rou-tine in clear text that has the task of decrypting and launch-ing the primary attack code. These evasion attempts do not change the resulting character distribution and the anomaly score of the analyzed query parameter is unaffected.
4.2.1
Learning
The idealized character distribution is determined during the training phase. For each observed query attribute, its character distribution is stored. The idealized character dis-tribution is then approximated by calculating the average of all stored character distributions. This is done by setting
ICD(n) to the mean of thenthentry of the stored character distributions∀n: 0≤n≤255 . Because all individual char-acter distributions sum up to unity, their average will do so as well, and the idealized character distribution is well-defined.
4.2.2
Detection
Given an idealized character distributionICD, the task of the detection phase is to determine the probability that the character distribution of a query attribute is an actual sam-ple drawn from itsICD. This probability, or more precisely, the confidence in the hypothesis that the character distribu-tion is a sample from the idealized character distribudistribu-tion, is calculated by a statistical test.
This test should yield a high confidence in the correctness of the hypothesis for normal (i.e., non-anomalous) attributes while it should reject anomalous ones. The detection algo-rithm uses a variant of the Pearsonχ2-test as a ‘goodness-of-fit’ test [4].
For the intended statistical calculations, it is not neces-sary to operate on all values ofICD directly. Instead, it is enough to consider a small number of intervals, or bins. For example, assume that the domain ofICD is divided into six segments as shown in Table 1. Although the choice of six bins is somewhat arbitrary1, it has no significant impact on the results.
Segment 0 1 2 3 4 5
x-Values 0 1-3 4-6 7-11 12-15 16-255
Table 1: Bins for theχ2-test
The expected relative frequency of characters in a segment can be easily determined by adding the values ofICDfor the corresponding x-values. Because the relative frequencies are sorted in descending order, it can be expected that the values ofICD(x) are more significant for the anomaly score whenx
is small. This fact is clearly reflected in the division ofICD’s domain.
When a new query attribute is analyzed, the number of occurrences of each character in the string is determined. Afterward, the values are sorted in descending order and combined according to Table 1 by aggregating values that belong to the same segment. Theχ2-test is then used to cal-culate the probability that the given sample has been drawn from the idealized character distribution. The standard test requires the following steps to be performed.
1. Calculate the observed and expected frequencies - The observed valuesOi(one for each bin) are already given.
The expected number of occurrencesEiare calculated
by multiplying the relative frequencies of each of the six bins as determined by theICDtimes the length of the attribute (i.e., the length of the string).
2. Compute the χ2-value as χ2 =
i<6
i=0
(Oi−Ei)2
Ei - note
thatiranges over all six bins.
3. Determine the degrees of freedom and obtain the sig-nificance - The degrees of freedom for theχ2-test are identical to the number of addends in the formula above minus one, which yields five for the six bins used. The actual probability p that the sample is derived from the idealized character distribution (that is, its signif-icance) is read from a predefined table using the χ2 -value as index.
1The number six seems to have a particular relevance to the
The derived value p is used as the return value for this model. When the probability that the sample is drawn from the idealized character distribution increases,pincreases as well.
4.3
Structural Inference
Often, the manifestation of an exploit is immediately vis-ible in query attributes as unusually long parameters or pa-rameters that contain repetitions of non-printable characters. Such anomalies are easily identifiable by the two mechanisms explained before.
There are situations, however, when an attacker is able to craft her attack in a manner that makes its manifestation appear more regular. For example, non-printable characters can be replaced by groups of printable characters. In such situations, we need a more detailed model of the query at-tribute that contains the evidence of the attack. This model can be acquired by analyzing the parameter’s structure. For our purposes, the structure of a parameter is the regular grammar that describes all of its normal, legitimate values.
4.3.1
Learning
When structural inference is applied to a query attribute, the resulting grammar must be able to produce at least all training examples. Unfortunately, there is no unique gram-mar that can be derived from a set of input elements. When no negative examples are given (i.e., elements that should not be derivable from the grammar), it is always possible to create either a grammar that contains exactly the train-ing data or a grammar that allows production of arbitrary strings. The first case is a form of over-simplification, as the resulting grammar is only able to derive the learned in-put without providing any level of abstraction. This means that no new information is deduced. The second case is a form of over-generalization because the grammar is capable of producing all possible strings, but there is no structural information left.
The basic approach used for our structural inference is to generalize the grammar as long as it seems to be ‘reasonable’ and stop before too much structural information is lost. The notion of ‘reasonable generalization’ is specified with the help of Markov models and Bayesian probability.
In a first step, we consider the set of training items (i.e., query attributes stored during the training phase) as the out-put of aprobabilisticgrammar. A probabilistic grammar is a grammar that assigns probabilities to each of its productions. This means that some words are more likely to be produced than others, which fits well with the evidence gathered from query parameters. Some values appear more often, and this is important information that should not be lost in the mod-eling step.
A probabilistic regular grammar can be transformed into a non-deterministic finite automaton (NFA). Each state S
of the automaton has a set ofnS possible output symbolso
which are emitted with a probability ofpS(o). Each
transi-tiontis marked with a probabilityp(t) that characterizes the likelihood that the transition is taken. An automaton that has probabilities associated with its symbol emissions and its transitions can also be considered a Markov model.
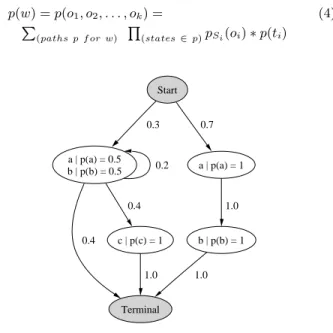
The output of the Markov model consists of all paths from its start state to its terminal state. A probability value can be assigned to each output wordw(that is, a sequence of output symbolso1, o2, . . . , ok). This probability value (as shown in
Equation 4) is calculated as the sum of the probabilities of all distinct paths through the automaton that producew. The
probability of a single path is the product of the probabili-ties of the emitted symbolspSi(oi) and the taken transitions
p(ti). The probabilities of all possible output words wsum
up to 1. p(w) =p(o1, o2, . . . , ok) = (4) (paths p f or w) (states∈p)pSi(oi)∗p(ti) Start a | p(a) = 0.5 b | p(b) = 0.5 0.3 a | p(a) = 1 0.7 Terminal 0.4 0.2 c | p(c) = 1 0.4 b | p(b) = 1 1.0 1.0 1.0
Figure 2: Markov Model Example
For example, consider the NFA in Figure 2. To calculate the probability of the word ‘ab’, one has to sum the probabil-ities of the two possible paths (one that follows the left arrow and one that follows the right one). The start state emits no symbol and has a probability of 1. Following Equation 4, the result is
p(w) = (1.0∗0.3∗0.5∗0.2∗0.5∗0.4) + (1.0∗0.7∗1.0∗1.0∗1.0∗1.0)
= 0.706 (5)
The target of the structural inference process is to find a NFA that has the highest likelihood for the given training elements. An excellent technique to derive a Markov model from empirical data is explained in [30]. It uses the Bayesian theorem to state this goal as
p(M odel|T rainingData) = (6)
p(T rainingData|M odel)∗p(M odel)
p(T rainingData)
The probability of the training data is considered a scal-ing factor in Equation 6 and it is subsequently ignored. As we are interested in maximizing thea posteriori probability (i.e., the left-hand side of the equation), we have to maximize the product shown in the enumerator on the right-hand side of the equation. The first term – the probability of the train-ing data given the model – can be calculated for a certain automaton (i.e., for a certain model) by adding the probabil-ities calculated for each input training element as discussed above. The second term – the prior probability of the model – is not as straightforward. It has to reflect the fact that, in general, smaller models are preferred. The model proba-bility is calculated heuristically and takes into account the total number of statesNas well as the number of transitions
Stransand emissions
justified by the fact that smaller models can be described with less states as well as fewer emissions and transitions. The actual value is derived as shown in Equation 7.
p(M odel) = (7) S∈States (N+ 1) Strans∗(N+ 1) Semit
The term that is maximized – the product of the probabil-ity of the model given the data, times the prior probabilprobabil-ity of the model itself – reflects the intuitive idea that there is a conflict between simple models that tend to over-generalize and models that perfectly fit the data but are too complex.
Models that are too simple have a high model probabil-ity, but the likelihood for producing the training data is ex-tremely low. This yields a small product after both terms are multiplied. Models that are too complex have a high likelihood of producing the training data (up to 1 when the model only contains the training input without any abstrac-tions), but the probability of the model itself is very low. By maximizing the product, the Bayesian model induction approach creates automatons that generalize enough to re-flect the general structure of the input without discarding too much information.
The model building process starts with an automaton that exactly reflects the input data and then gradually merges states. This state merging is continued until thea posteriori
probability no longer increases. There are a number of op-timizations such as the Viterbi path approximation and the path prefix compression that need to be applied to make that process effective. The interested reader is referred to [30] and [31] for details. Alternative applications of Markov models for intrusion detection have been presented in [3] and in [35].
4.3.2
Detection
Once the Markov model has been built, it can be used by the detection phase to evaluate query attributes by de-termining their probability. The probability of an attribute is calculated in a way similar to the likelihood of a training item as shown in Equation 4. The problem is that even legi-timate input that has been regularly seen during the training phase may receive a very small probability value because the probability values of all possible input words sum up to 1. Therefore, we chose to have the model return a probability value of 1 if the word is a valid output from the Markov model and a value of 0 when the value cannot be derived from the given grammar.
4.4
Token Finder
The purpose of the token finder model is to determine whether the values of a certain query attribute are drawn from a limited set of possible alternatives (i.e., they are to-kens or elements of an enumeration). Web applications often require one out of a few possible values for certain query attributes, such as flags or indices. When a malicious user attempts to use these attributes to pass illegal values to the application, the attack can be detected. When no enumera-tion can be identified, it is assumed that the attribute values are random.
4.4.1
Learning
The classification of an argument as an enumeration or as a random value is based on the observation that the number of different occurrences of parameter values is bound by some
unknown thresholdtin the case of an enumeration while it is unrestricted in the case of random values.
When the number of different argument instances grows proportional to the total number of argument instances, the use of random values is indicated. If such an increase cannot be observed, we assume an enumeration. More formally, to decide if argument a is an enumeration, we calculate the statistical correlation ρbetween the values of the functions
f and gfor increasing numbers 1, . . . , i of occurrences of a. The functionsfandgare defined as follows onN0.
f(x) =x (8) g(x) = g(x−1) + 1,
ifthe xthvalue forais new g(x−1)−1,
ifthe xthvalue was seen before 0,
ifx= 0
(9)
The correlation parameter ρis derived after the training data has been processed. It is calculated fromf andgwith their respective variances Var(f),Var(g) and the covariance Covar(f,g) as shown below.
ρ= Covar(f, g)
Var(f)∗Var(g) (10) Ifρ is less than 0, thenf andgare negatively correlated and an enumeration is assumed. This is motivated by the fact that, in this case, increasing function values off (reflecting the increasing number of analyzed parameters) correlate with decreasing values ofg(x) (reflecting the fact that many argu-ment values forahave previously occurred). In the opposite case, whereρ is greater than 0, the values ofa have shown sufficient variation to support the hypothesis that they are not drawn from a small set of predefined tokens.
When an enumeration is assumed, the complete set of iden-tifiers is stored for use in the detection phase.
4.4.2
Detection
Once it has been determined that the values of a query attribute are tokens drawn from an enumeration, any new value is expected to appear in the set of known values. When this happens, 1 is returned, 0 otherwise. If it has been de-termined that the parameter values are random, the model always returns 1.
4.5
Attribute Presence or Absence
Most of the time, server-side programs are not directly in-voked by users typing the input parameters into the URIs themselves. Instead, client-side programs, scripts, or HTML forms pre-process the data and transform it into a suitable request. This processing step usually results in a high reg-ularity in the number, name, and order of parameters. Em-pirical evidence shows that hand-crafted attacks focus on ex-ploiting a vulnerability in the code that processes a certain parameter value, and little attention is paid to the order or completeness of the parameters.
The analysis takes advantage of this fact and detects re-quests that deviate from the way parameters are presented by legitimate client-side scripts or programs. This type of anomaly is detected using two different algorithms. The first
one, described in this section, deals with the presence and absence of attributes ai in a query q. The second one is
based on the relative order of parameters and is further dis-cussed in Section 4.6. Note that the two models differ from the previous ones because the analysis is performed on the query as a whole, and not individually on each parameter.
The algorithm discussed hereinafter assumes that the ab-sence or abnormal preab-sence of one or more parameters in a query might indicate malicious behavior. In particular, if an argument needed by a server-side program is missing, or if mutually exclusive arguments appear together, then the request is considered anomalous.
4.5.1
Learning
The test for presence and absence of parameters creates a model of acceptable subsets of attributes that appear simul-taneously in a query. This is done by recording each distinct subsetSq={ai, . . . , ak}of attributes that is seen during the
training phase.
4.5.2
Detection
During the detection phase, the algorithm performs for each query a lookup of the current attribute set. When the set of parameters has been encountered during the training phase, 1 is returned, otherwise 0.
4.6
Attribute Order
As discussed in the previous section, legitimate invocations of server-side programs often contain the same parameters in the same order. Program logic is usually sequential, and, therefore, the relative order of attributes is preserved even when parameters are omitted in certain queries. This is not the case for hand-crafted requests, as the order chosen by a human can be arbitrary and has no influence on the execution of the program.
The test for parameter order in a query determines whether the given order of attributes is consistent with the model deduced during the learning phase.
4.6.1
Learning
The order constraints between all k attributes (ai:∀i=
1. . . k) of a query are gathered during the training phase. An attributeas of a programprecedes another attributeat
when as and at appear together in the parameter list of at
least one query andascomes beforeatin the ordered list of
attributes of all queries where they appear together. This definition allows one to introduce the order constraints as a set of attribute pairsOsuch that:
O={(ai, aj) :aiprecedesaj and (11) ai, aj ∈(Sqj :∀j= 1. . . n)}
The set of attribute pairsOis determined as follows. Con-sider a directed graphGthat has a number of vertices equal to the number of distinct attributes. Each vertex vi in G
is associated with the corresponding attributeai. For every
queryqj, withj= 1. . . n, that is analyzed during the
train-ing period, the ordered list of its attributesa1, a2, . . . , ai is
processed. For each attribute pair (as, at) in this list, with s 6=tand 1≤s, t≤i, a directed edge is inserted into the graph fromvs tovt.
At the end of the learning process, graphGcontains all or-der constraints imposed by queries in the training data. The order dependencies between two attributes are represented
either by a direct edge connecting their corresponding ver-tices, or by a path over a series of directed edges. At this point, however, the graph could potentially contain cycles as a result of precedence relationships between attributes de-rived from different queries. As such relationships are im-possible, they have to be removed before the final order con-straints can be determined. This is done with the help of Tarjan’s algorithm [33] which identifies all strongly connected components (SCCs) ofG. For each component, all edges con-necting vertices of the same SCC are removed. The resulting graph is acyclic and can be utilized to determine the set of attribute pairsOwhich are in a ‘precedes’ relationship. This is obtained by enumerating for each vertexviall its reachable
nodesvg, . . . , vhinG, and adding the pairs (ai, ag). . .(ai, ah)
toO.
4.6.2
Detection
The detection process checks whether the attributes of a query satisfy the order constraints deduced during the learn-ing phase. Given a query with attributesa1, a2, . . . , ai and
the set of order constraintsO, all the parameter pairs (aj, ak)
with j 6= k and 1 ≤ j, k ≤ i are analyzed to detect po-tential violations. A violation occurs when for any single pair (aj, ak), the corresponding pair with swapped elements
(ak, aj) is an element ofO. In such a case, the algorithm
returns an anomaly score of 0, otherwise it returns 1.
5.
EVALUATION
This section discusses our approach to validate the pro-posed models and to evaluate the detection effectiveness of our system. That is, we assess the capability of the models to accurately capture the properties of the analyzed attributes and their ability to reliably detect potentially malicious de-viations.
The evaluation was performed using three data sets. These data sets were Apache log files from a production web server at Google, Inc. and from two Computer Science Department web servers located at the University of California, Santa Barbara (UCSB) and the Technical University, Vienna (TU Vienna).
We had full access to the log files of the two universities. However, the access to the log file from Google was restricted because of privacy issues. To obtain results for this data set, our tool was run on our behalf locally at Google and the results were mailed to us.
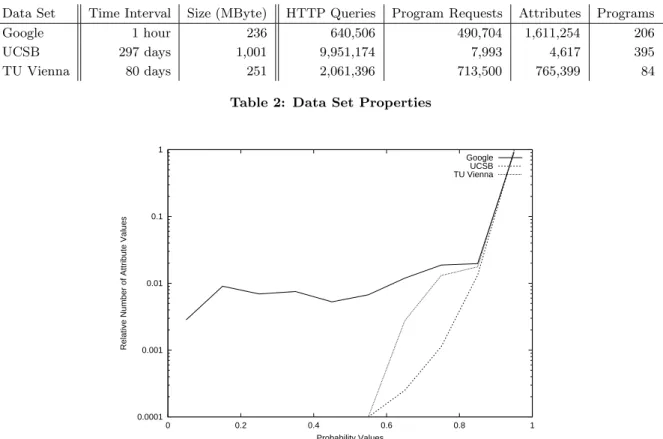
Table 2 provides information about important properties of the data sets. The table shows the time interval during which the data was recorded and the log file size. It also lists the total number of HTTP queries in the log file, the number of requests that invoke server-side programs (such as CGI requests), the total number of their attributes, and the number of different server-side programs.
5.1
Model Validation
This section shows the validity of the claim that our pro-posed models are able to accurately describe properties of query attributes. For this purpose, our detection tool was run on the three data sets to determine the distribution of the probability values for the different models. The length of the training phase was set to 1,000 for this and all follow-ing experiments. This means that our system used the first thousand queries that invoked a certain server-side program to establish its profiles and to determine suitable detection thresholds.
Data Set Time Interval Size (MByte) HTTP Queries Program Requests Attributes Programs Google 1 hour 236 640,506 490,704 1,611,254 206
UCSB 297 days 1,001 9,951,174 7,993 4,617 395
TU Vienna 80 days 251 2,061,396 713,500 765,399 84
Table 2: Data Set Properties
0.0001 0.001 0.01 0.1 1 0 0.2 0.4 0.6 0.8 1
Relative Number of Attribute Values
Probability Values
Google UCSB TU Vienna
Figure 3: Attribute Length
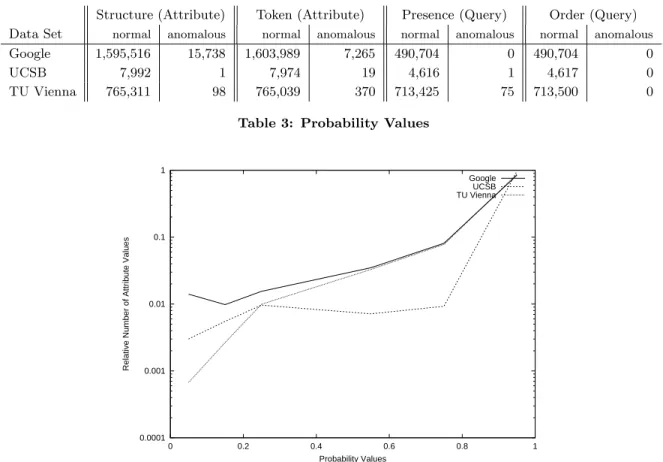
Figure 3 and 4 show a distribution of the probability values that have been assigned to the query attributes by the length and the character distribution models, respectively. The y-axis shows the percentage of attribute values that appeared with a specific probability. For the figures, we aggregated the probability values (which are real numbers in the interval be-tween 0.0 and 1.0) into ten bins, each bin covering an interval of 0.1. That is, all probabilities in the interval [0.0,0.1[ are added to the first bin, values in the interval [0.1,0.2[ are added to the second bin, and so forth. Note that a proba-bility of 1 indicates a completely normal event. The relative number of occurrences are shown on a logarithmic scale.
Table 3 shows the number of attributes that have been rated as normal (with a probability of 1) or as anomalous (with a probability of 0) by the structural model and the token finder model. The table also provides the number of queries that have been classified as normal or as anoma-lous by the presence/absence model and the attribute order model. The number of queries is less than the number of attributes, as each query can contain multiple attributes.
The distributions of the anomaly scores in Figure 3, Fig-ure 4 and Table 3 show that all models are capable of captur-ing the normality of their correspondcaptur-ing features. The vast majority of the analyzed attributes are classified as normal (reflected by an anomaly score close to one in the figures) and only few instances deviate from the established profiles. The graphs in Figure 3 and 4 quickly drop from above 90% of ‘most normal’ instances in the last bin to values below 1%. It can be seen that the data collected by the Google server shows the highest variability (especially in the case of the at-tribute length model). This is due to the fact that the Google
search string is included in the distribution. Naturally, this string, which is provided by users via their web browsers to issue Google search request, varies to a great extent.
5.2
Detection Effectiveness
This section analyzes the number of hits and false positives raised during the operation of our tool.
To assess the number of false positives that can be ex-pected when our system is deployed, the intrusion detection system was run on our three data sets. For this experiment, we assumed that the training data contained no real attacks. Although the original log files showed a significant number of entries from Nimda or Code Red worm attacks, these queries were excluded both from the model building and detection process. Note, however, that this is due to the fact that all three sites use the Apache HTTP server. This web server fails to locate the targeted vulnerable program and thus, fails execute it. As we only include queries that result from the in-vocation of existing programs into the training and detection process, these worm attacks were ignored.
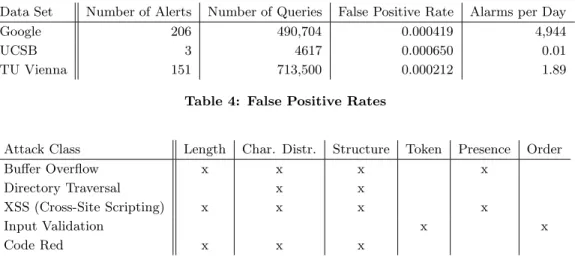
The false positive rate can be easily calculated by divid-ing the number of reported anomalous queries by the total number of analyzed queries. It is shown for each data set in Table 4.
The relative numbers of false positives are very similar for all three sites, but the absolute numbers differ tremendously, reflecting the different web server loads. Although almost five thousand alerts per day for the Google server appears to be a very high number at a first glance, one has to take into account that this is an initial result. The alerts are the raw output produced by our system after a training phase with parameters chosen for the university log files. One
ap-Structure (Attribute) Token (Attribute) Presence (Query) Order (Query) Data Set normal anomalous normal anomalous normal anomalous normal anomalous
Google 1,595,516 15,738 1,603,989 7,265 490,704 0 490,704 0
UCSB 7,992 1 7,974 19 4,616 1 4,617 0
TU Vienna 765,311 98 765,039 370 713,425 75 713,500 0
Table 3: Probability Values
0.0001 0.001 0.01 0.1 1 0 0.2 0.4 0.6 0.8 1
Relative Number of Attribute Values
Probability Values
Google UCSB TU Vienna
Figure 4: Attribute Character Distribution
proach to reduce the number of false positives is to modify the training and detection thresholds to account for the higher variability in the Google traffic. Nearly half of the number of false positives are caused by anomalous search strings that contain instances of non-printable characters (probably re-quests issued by users with incompatible character sets) or extremely long strings (such as URLs directly pasted into the search field). Another approach is to perform post-processing of the output, maybe using a signature-based intrusion tection system to discard anomalous queries with known de-viations. In addition, it is not completely impossible to deal with this amount of alerts manually. One or two full-time employees could browse the list of alerts, quickly discarding obviously incorrect instances and concentrating on the few suspicious ones.
When analyzing the output for the two university log files, we encountered several anomalous queries with attributes that were not malicious, even though they could not be in-terpreted as correct in any way. For example, our tool re-ported a character string in a field used by the application to transmit an index. By discussing these queries with the administrators of the corresponding sites, it was concluded that some of the mistakes may have been introduced by users that were testing the system for purposes other than security. After estimating the false alarm rates, the detection ca-pabilities of our tool were analyzed. For this experiment, a number of attacks were introduced into the data set of TU Vienna. We have chosen this data set to insert attacks for two reasons. First, we had access to the log file and could inject queries; something that was impossible for the Google data set. Second, the vulnerable programs that were attacked had
already been installed at this site and were regularly used. This allowed us to base the evaluation on real-world training data.
We used eleven real-world exploits downloaded from popu-lar security sites [6, 27, 29] for our experiment. The set of at-tacks consisted of a buffer overflow againstphorum[26], a php message board, and three directory traversal attacks against
htmlscript [24]. Two XSS (cross-site scripting) exploits were launched against imp [15], a web-based email client, and two XSS exploits againstcsSearch[8], a search utility.
Webwho[9], a web-based directory service was compromised using three variations of input validation errors. We also wanted to assess the ability of our system to detect worms such as Nimda or Code Red. However, as mentioned above, all log files were created by Apache web servers. Apache is not vulnerable against the attacks, as both worms exploit vulnerabilities in Microsoft’s Internet Information Server (IIS). We solved the problem by installing a Microsoft IIS server and, after manually creating training data for the vulnerable program, injecting the signature of a Code Red attack [5]. Then, we transformed the log file into Apache format and run our system on it.
All eleven attacks and the Code Red worm have been re-liably detected by our anomaly detection system, using the same thresholds and training data that were used to evaluate the false alarm rate for this data set. Although the attacks were known to us, all are based on existing code that was used unmodified. In addition, the malicious queries were in-jected into the log files for this experiment after the model algorithms were designed and the false alarm rate was as-sessed. No manual tuning or adjustment was necessary.
Data Set Number of Alerts Number of Queries False Positive Rate Alarms per Day
Google 206 490,704 0.000419 4,944
UCSB 3 4617 0.000650 0.01
TU Vienna 151 713,500 0.000212 1.89
Table 4: False Positive Rates
Attack Class Length Char. Distr. Structure Token Presence Order
Buffer Overflow x x x x
Directory Traversal x x
XSS (Cross-Site Scripting) x x x x
Input Validation x x
Code Red x x x
Table 5: Detection Capabilities
Table 5 shows the models that reported an anomalous query or an anomalous attribute for each class of attacks. It is evident that there is no model that raises an alert for all attacks. This underlines the importance of choosing and combining different properties of queries and attributes to cover a large number of possible attack venues.
The length model, the character distribution model, and the structural model are very effective against a broad range of attacks that inject a substantial amount of malicious pay-load into an attribute string. Attacks such as buffer over-flow exploits (including the Code Red worm, which bases its spreading mechanism on a buffer overflow in Microsoft’s IIS) and cross-site scripting attempts require a substantial amount of characters, thereby increasing the attribute length noticeably. Also, a human operator can easily tell that a ma-liciously modified attribute does not ‘look right’. This ob-servation is reflected in its anomalous character distribution and a structure that differs from the previously established profile.
Input validation errors, including directory traversal at-tempts, are harder to detect. The required number of charac-ters is smaller than the number needed for buffer overflow or XSS exploits, often in the range of the legitimate attribute. Directory traversal attempts stand out because of the un-usual structure of the attribute string (repetitions of slashes and dots). Unfortunately, this is not true for input valida-tion attacks in general. The three attacks that exploit an error inWebwhodid not result in an anomalous attribute for the character distribution model or the structural model. In this particular case, however, the token finder raised an alert, because only a few different values of the involved attribute were encountered during the training phase.
The presence/absence and the parameter order model can be evaded without much effort by an adversary that has suffi-cient knowledge of the structure of a legitimate query. Note, however, that the available exploits used in our experiments resulted in reported anomalies from at least one of the two models in 8 out of 11 cases (one buffer overflow, four directory traversal, and three input validation attacks). We therefore decided to include these models into our IDS, especially be-cause of the low number of false alarms they produce.
The results presented in this section show that our sys-tem is able to detect a high percentage of attacks with a very limited number of false positives (all attacks, with less
than 0.2% false alarms in our experiments). Some of the at-tacks are also detectable by signature-based intrusion detec-tion systems such as Snort, because they represent variadetec-tions of known attacks (e.g., Code Red, buffer overflows). Other attacks use malicious manipulation of the query parameters, which signature-based system do not notice. These attacks are correctly flagged by our anomaly detection system.
A limitation of the system is its reliance on web access logs. Attacks that compromise the security of a web server before the logging is performed may not be detected. The approach described in [1] advocates the direct instrumentation of web servers in order to perform timely detection of attacks, even before a query is processed. This approach may introduce some unwanted delay in certain cases, but if this delay is acceptable then the system described here could be easily modified to fit that model.
6.
CONCLUSIONS
Web-based attacks should be addressed by tools and tech-niques that compose the precision of signature-based detec-tion with the flexibility of anomaly-based intrusion detecdetec-tion system.
This paper introduces a novel approach to perform anomaly detection, using as input HTTP queries containing param-eters. The work presented here is novel in several ways. First of all, to the best of our knowledge, this is the first anomaly detection system specifically tailored to the detec-tion of web-based attacks. Second, the system takes advan-tage of application-specific correlation between server-side programs and parameters used in their invocation. Third, the parameter characteristics (e.g., length and structure) are learned from input data. Ideally, the system will not re-quire any installation-specific configuration, even though the level of sensitivity to anomalous data can be configured via thresholds to suit different site policies.
The system has been tested on data gathered at Google, Inc. and two universities in the United States and Europe. Future work will focus on further decreasing the number of false positives by refining the algorithms developed so far, and by looking at additional features. The ultimate goal is to be able to perform anomaly detection in real-time for web sites that process millions of queries per day with virtually no false alarms.
Acknowledgments
We would like to thank Urs Hoelzle from Google, Inc. who made it possible to test our system on log files from one of the world’s most popular web sites.
This research was supported by the Army Research Office, under agreement DAAD19-01-1-0484. The views and conclu-sions contained herein are those of the authors and should not be interpreted as necessarily representing the official policies or endorsements, either expressed or implied, of the Army Research Office, or the U.S. Government.
7.
REFERENCES
[1] M. Almgren and U. Lindqvist. Application-Integrated Data Collection for Security Monitoring. InProceedings of Recent Advances in Intrusion Detection (RAID), LNCS, pages 22–36, Davis,CA, October 2001. Springer. [2] Apache 2.0 Documentation, 2002.
http://www.apache.org/.
[3] D. Barbara, R. Goel, and S. Jajodia. Mining Malicious Data Corruption with Hidden Markov Models. In16th Annual IFIP WG 11.3 Working Conference on Data and Application Security, Cambridge, England, July 2002.
[4] Patrick Billingsley.Probability and Measure. Wiley-Interscience, 3 edition, April 1995.
[5] CERT/CC. “Code Red Worm” Exploiting Buffer Overflow In IIS Indexing Service DLL. Advisory CA-2001-19, July 2001.
[6] CGI Security Homepage.
http://www.cgisecurity.com/, 2002.
[7] K. Coar and D. Robinson. The WWW Common Gateway Interface, Version 1.1. Internet Draft, June 1999.
[8] csSearch.http://www.cgiscript.net/.
[9] Cyberstrider WebWho.http://www.webwho.co.uk/. [10] D.E. Denning. An Intrusion Detection Model.IEEE Transactions on Software Engineering, 13(2):222–232, February 1987.
[11] R. Fielding et al. Hypertext Transfer Protocol – HTTP/1.1. RFC 2616, June 1999.
[12] S. Forrest. A Sense of Self for UNIX Processes. In
Proceedings of the IEEE Symposium on Security and Privacy, pages 120–128, Oakland, CA, May 1996. [13] A.K. Ghosh, J. Wanken, and F. Charron. Detecting
Anomalous and Unknown Intrusions Against Programs. InProceedings of the Annual Computer Security Applications Conference (ACSAC’98), pages 259–267, Scottsdale, AZ, December 1998.
[14] K. Ilgun, R.A. Kemmerer, and P.A. Porras. State Transition Analysis: A Rule-Based Intrusion Detection System.IEEE Transactions on Software Engineering, 21(3):181–199, March 1995.
[15] IMP Webmail Client.http://www.horde.org/imp/. [16] H. S. Javitz and A. Valdes. The SRI IDES Statistical
Anomaly Detector. InProceedings of the IEEE Symposium on Security and Privacy, May 1991. [17] C. Ko, M. Ruschitzka, and K. Levitt. Execution
Monitoring of Security-Critical Programs in
Distributed Systems: A Specification-based Approach. InProceedings of the 1997 IEEE Symposium on Security and Privacy, pages 175–187, May 1997. [18] C. Kruegel, T. Toth, and E. Kirda. Service Specific
Anomaly Detection for Network Intrusion Detection.
InSymposium on Applied Computing (SAC). ACM Scientific Press, March 2002.
[19] T. Lane and C.E. Brodley. Temporal sequence learning and data reduction for anomaly detection. In
Proceedings of the 5th ACM conference on Computer and communications security, pages 150–158. ACM Press, 1998.
[20] W. Lee and S. Stolfo. A Framework for Constructing Features and Models for Intrusion Detection Systems.
ACM Transactions on Information and System Security, 3(4), November 2000.
[21] W. Lee, S. Stolfo, and K. Mok. Mining in a Data-flow Environment: Experience in Network Intrusion Detection. InProceedings of the5thACM SIGKDD International Conference on Knowledge Discovery & Data Mining (KDD ’99), San Diego, CA, August 1999. [22] J. Liberty and D. Hurwitz.Programming ASP.NET.
O’REILLY, February 2002.
[23] U. Lindqvist and P.A. Porras. Detecting Computer and Network Misuse with the Production-Based Expert System Toolset (P-BEST). InIEEE Symposium on Security and Privacy, pages 146–161, Oakland, California, May 1999.
[24] Miva HtmlScript.http://www.htmlscript.com/. [25] V. Paxson. Bro: A System for Detecting Network
Intruders in Real-Time. InProceedings of the 7th USENIX Security Symposium, San Antonio, TX, January 1998.
[26] Phorum: PHP Message Board.
http://www.phorum.org/. [27] PHP Advisory Homepage.
http://www.phpadvisory.com/, 2002.
[28] M. Roesch. Snort - Lightweight Intrusion Detection for Networks. InProceedings of the USENIX LISA ’99 Conference, November 1999.
[29] Security Focus Homepage.
http://www.securityfocus.com/, 2002.
[30] Andreas Stolcke and Stephen Omohundro. Hidden Markov Model Induction by Bayesian Model Merging.
Advances in Neural Information Processing Systems, 1993.
[31] Andreas Stolcke and Stephen Omohundro. Inducing Probabilistic Grammars by Bayesian Model Merging. InConference on Grammatical Inference, 1994. [32] K. Tan and R. Maxion. ”Why 6?” Defining the Operational Limits of Stide, an Anomaly-Based Intrusion Detector. InProceedings of the IEEE Symposium on Security and Privacy, pages 188–202, Oakland, CA, May 2002.
[33] Robert Tarjan. Depth-First Search and Linear Graph Algorithms.SIAM Journal of Computing, 1(2):10–20, June 1972.
[34] Security Tracker. Vulnerability statistics April 2001-march 2002.http://www.securitytracker.com/ learn/statistics.html, April 2002.
[35] N. Ye, Y. Zhang, and C. M. Borror. Robustness of the Markov chain model for cyber attack detection.IEEE Transactions on Reliability, 52(3), September 2003.