REPUBLIC OF KENYA
MINISTRY OF FINANCE Debt Management Department
ANNUAL
PUBLIC DEBT MANAGEMENT REPORT
July 2005 – June 2006
Information in this publication may be reproduced without restriction provided that due acknowledgement of the source is made.
Enquiries covering the publication should be addressed to:
The Director,
Debt Management Department
1st Floor, Treasury Building, Harambee Avenue P.O. Box 30007-00100, Nairobi, Kenya
Tel: (254) 20 252299 Fax: (254) 20 315294 Email: [email protected]
This publication is available at the Treasury Website at: http://www.treasury.go.ke
Foreword
The primary objective of Government debt management policy is to cover the government financing requirements at the lowest possible long-term borrowing costs, subject to a prudent degree of risk. The other objective is to deepen the domestic market for Government securities. This Annual Public Debt Management
Report reviews the state of public debt management over the last ten years and
current reforms in this area. The Ministry of Finance will be publishing this report annually as part of its effort to disseminate information on public debt.
Public debt continues to be a major challenge towards achievement of Millennium
Development Goals. A significant proportion of the Government budget allocation is
to service public debt, leaving inadequate financial resources for pro-poor development programmes. The need to strengthen public debt management is critical not only to lowering the cost of debt service to the Exchequer, but also to the development of Kenya’s capital markets. Over the last two years, the Government experienced major lapses in systems and controls related to management of external supplier credit loan contracts. In response to these shortcomings, the Government took steps to develop effective institutional and legal framework for public debt management anchored on a public debt strategy consistent with the Kenya Vision 2030.
The critical importance of prudent management of public debt has been recognised in many countries and reform measures are being undertaken. Although no specific model is advocated, there are clear set of best practices that should be taken into account when reforms are being designed. In our context, a set of sound practices to strengthen the quality of public debt management has been identified and implementation is underway.
In conclusion, I wish to take this opportunity to express my appreciation to all the stakeholders participating in the on-going public debt management reforms. At the end of the five-year reform process in 2009, it is envisaged that public debt management will be in accordance with best international practice.
Hon. Amos Kimunya Minister for Finance
Acknowledgement
This is the second Annual Public Debt Management Report. The first report was published in 1994. Delay in preparing this important report is attributed to inadequate capacity currently being addressed in the on-going public debt management reforms.
Significant milestones have been achieved in the implementation of the reforms since commencement two years ago. The external debt data has been successfully updated, validated and migrated to the DRMS 2000+ database from the CS-DRMS 7.2 version. Similarly, domestic debt data has been successfully uploaded to the new system. This has improved the quality of debt data, a pre-requisite for effective debt management. In addition, commendable progress has been achieved in consolidating debt management operations under the Debt Management Department (DMD). Supported by a reliable debt database and improved coordination of debt management functions, external debt service payments are currently settled promptly.
By June 2007, electronic debt data will be available on-line between the Ministry of Finance (MoF) and Central Bank of Kenya (CBK) upon completion of the fibre-optic link. A debt sustainability analysis to establish tolerable debt burden thresh-holds and develop a formal National Debt Strategy to guide public debt management will also be undertaken. These measures, together with the institutional and legal reforms on public debt management are consistent with the Public Financial Management Reforms that are currently being implemented by the Government whose objective is to strengthen fiscal discipline and enhance performance of the public sector.
I wish to acknowledge the important role played by the Debt Management Department at the Ministry of Finance for co-ordinating production of this report and the Central Bank of Kenya for their technical input. In particular, I convey special thanks to the core team which was involved, namely: John Murugu (Director), Haron Sirima (Deputy Director), George Wanjau (Principal Economist), Charles Kairu (Senior Economist) and Jairus Muaka (Senior Economist) all from the Debt Management Department at the Ministry of Finance, and Isaya Maana and Cappitus Chironga from the Central Bank of Kenya. It is expected that future series of this annual publication will be ready by end November each year.
Mr. Joseph K. Kinyua
Permanent Secretary/Treasury
TABLE OF CONTENTS Foreword... i Acknowledgement ... ii List of Abbreviations ... iv Executive Summary ... v 1. INTRODUCTION... 1 2. OVERVIEW (1996 – 2005) ... 2 2.1 Institutional Framework... 2
2.2 The Legal Framework... 4
2.3 Debt Management Objectives... 4
2.4 Public Debt Stock ... 5
2.5 Debt Relief Initiatives ... 7
2.6 Debt Service... 8
2.7 Disbursements... 10
2.8 Concessionality of External Debt ... 11
2.9 Publicly Guaranteed Debt ... 11
2.10 Domestic Debt ... 11
3. PUBLIC DEBT DEVELOPMENTS (2005-2006) ... 15
3.1 EXTERNAL DEBT ... 16
3.1.1 External Debt Stock ... 16
3.1.2 Currency Structure of External Debt ... 17
3.1.3 Maturity Structure... 18
3.1.4 Concessionality ... 19
3.1.5 External Debt Service ... 20
3.1.6 Disbursements... 21
3.1.7 Government Guaranteed Loans ... 21
3.2 DOMESTIC DEBT... 22
3.2.1 Stock of Domestic Debt ... 22
3.2.2 Composition of Domestic Debt by Instrument ... 23
3.2.3 Interest Rates on Government Securities... 24
3.2.4 Domestic Debt by Holder ... 26
3.2.5 Treasury Bills... 26
3.2.6 Treasury Bonds ... 27
3.2.7 Government Long-term Stocks... 28
3.2.8 Government Securities Issuance Process... 28
3.2.9 Domestic Interest Payments... 30
3.2.10 Domestic Debt Management... 30
4. STRENGTHENING MANAGEMENT OF EXTERNAL COMMERCIAL DEBTS . 31 5. DEBT SUSTAINABILITY ... 34
6 PUBLIC DEBT MANAGEMENT REFORMS ... 39
7. EVOLUTION OF PUBLIC DEBT IN THE MEDIUM TERM (2006/07 - 2009/10)... 41
GLOSSARY... 43
List of Abbreviations
ADB African Development Bank AIA Appropriation In Aid
CBK Central Bank of Kenya
CDS Central Depository for Securities CFS Consolidated Fund Services
CS-DRMS Commonwealth Secretariat Debt Recording & Management System
CUB Committed Un-disbursed Balance
DGIPE Department of Government Investment and Public Enterprises DMD Debt Management Department
DMO Debt Management Office DOD Disbursed Outstanding Debt DSA Debt Sustainability Analysis ERD External Resources Department
FLSTAP Financial and Legal Sector Technical Assistance Project GDP Gross Domestic Product
GOK Government of Kenya HIPC Highly Indebted Poor Countries
IDA International Development Association IMF International Monetary Fund
KPLC Kenya Power and Lighting Company
KPTC Kenya Post and Telecommunications Corporation
Ksh. Kenya Shilling
MEFMI Macro Economic and Financial Management Institute of Eastern and Southern Africa
MoF Ministry of Finance
NBFI Non Bank Financial Institutions NCC Nairobi City Council NSE Nairobi Stock Exchange NSSF National Social Security Fund
ODA Official Development Assistance PADES Payment Advice Data Entry System
PV Present Value
TARDA Tana and Athi River Development Authority
USD US Dollar
Executive Summary
Over the years, public debt management in Kenya was characterized by weak institutional arrangements with debt functions spread across departments at the MoF and CBK. These include the DMD, External Resources Department (ERD), the Department of Government Investments and Public Enterprises (DGIPE), and Accountant-General’s Department at the MoF. In addition, debt management functions within MoF and CBK were guided by weak debt policy framework and
adhoc debt management strategies. Under-staffing and high staff turnover was
evident particularly within DMD, undermining operational efficiency. The external debt database was incomplete and unreliable. There were no documented operations manuals on business processes while the existing public debt registry had incomplete debt records.
In 2003, the Government requested the World Bank for technical assistance to carry out a study on existing public debt management practices and make recommendations on appropriate reforms. A joint mission of the World Bank and IMF submitted to the Government an Assessment Report on Central Government
Debt Management and Domestic Debt Market Development Program. The report
recommended a road map for the establishment of a Debt Management Office (DMO) at the MoF by December 2009 responsible for public debt management.
Over the last ten years, Kenya’s public debt stock has been rising. The country’s public debt increased from Ksh 466,294 million (or 67.8 percent of GDP) at the end of June 1996 to Ksh 789,076 million (50.5 percent of GDP) at the end of June 2006. In terms of debt category, domestic debt rose from Ksh 120,355 million (17.5 percent of GDP) at the end of June 1996 to Ksh 357,839 million (22.9 percent of GDP) at the end of June 2006 while external debt rose from Ksh 345,939 million (50.3 percent of GDP) to Ksh 431,237 million (27.6 percent of GDP) in the same period. Despite the rise in the stock of debt during the period, the proportion of overall debt to GDP declined due to a faster growth in GDP particularly over the last four years.
The composition of public debt has changed significantly with the share of domestic debt increasing from 25.8 percent of total debt at the end of June 1996 to 45.3 percent at the end of June 2006. Over the same period the proportion of external debt in total debt fell from 74.2 percent to 54.7 percent. The shift in the composition of debt during the period is attributed to reduced access to external funding from multilateral and bilateral agencies and increased domestic borrowing to close the shortfall.
The structure of external debt by creditor type has remained relatively unchanged over the last ten years. As at end of June 2006, the leading multilateral creditor was IDA (47.4 percent of total external debt), followed by the African Development Bank Group (6 percent) and the European Investment Bank (3.1 percent) while Japan (18.4 percent) was the leading bilateral creditor. The currency composition of the external debt was in Euros (34 percent), US dollars (32 percent), Japanese Yen (27 percent) and Sterling Pound (6 percent) while about 1 percent of the debt is denominated in other currencies.
In May 2001, driven by the need to lower the rising cost of domestic debt borrowing, reduce refinancing risk and promote the development of Government securities market, the Government, in consultation with stakeholders through the
Market Leaders Forum agreed to introduce longer dated Treasury Bonds to lengthen
the maturity profile of the debt. This initiative led to a dramatic change in the ratio of Treasury Bills to Treasury Bonds from 74:26 at the end of May 2001 to 30:70 at the end of June 2006. In addition, the Treasury Bonds began to trade at the Nairobi Stock Exchange. In order to curb inflationary pressures resulting from monetised borrowing through Government direct borrowing from CBK, the Central Bank of Kenya Act (Cap 491 Laws of Kenya) was amended to limit the overdraft to 5 percent of the latest Government audited revenue.
Overall public debt service declined during the past 10 years mainly as a result of rescheduling of external debts through the Paris Club and London Club. Debt service decreased from Ksh 57,487 million (39.5 percent of revenue) in the fiscal year 1995/96 to Ksh 44,320 million (14.1 percent of revenue) in the fiscal year 2005/06. However, it should be noted that over the last two years external debt service to commercial creditors decreased significantly following the Government’s decision to suspend payments of external commercial debts pending the outcome of a special audit and investigations by the Controller & Auditor General and Kenya Anti-Corruption Commission respectively. Over the period 2000/01 to 2004/05, domestic interest payments remained relatively stable. The sharp increase in domestic interest payments in the fiscal year 2005/06 was attributed to an increase in Government domestic borrowing to mitigate the effects of drought as well as to compensate for the shortfalls in the budgeted external financing.
Kenya rescheduled its bi-lateral debts three times through the Paris Club, in 1994 (USD 540 million), 2000 (USD 288 million) and 2004 (USD 350 million). It also rescheduled its commercial debts in 1998 (USD 43 million) and 2001 (USD 10 million) through the London Club. Although Kenya does not qualify for debt relief under both the HIPC and Multilateral Debt Relief Initiatives (MDRI), Government policy has been to seek for deeper relief on bilateral basis by seeking debt-for-development swap arrangements and debt cancellation. However, according to the results of the Debt Sustainability Analysis (DSA) carried out by the IMF in
November 2003, Kenya’s external debt burden indicators reveal that external debt is sustainable.
Over the last two years, the Government has been seeking to resolve outstanding external commercial debts suspended pending completion of a special audit and investigations on the supplier credit contracts. The initial audit reports by the Controller and Auditor General raised concerns over accountability and controls in the way supplier credits were contracted. More specifically, the outstanding commercial debts will be subjected to independent forensic audit and valuation to determine the extent to which all parties have performed in accordance with the contracts and in particular determine whether the Government has received value for money. Broadly, the on-going debt management reforms seek to address weaknesses in the institutional and legal frameworks on management of public debt to ensure that such lapses do not re-cur.
Finally, during the fiscal year 2006/07, total debt service is expected to rise to Ksh 59,109 million out of which Ksh 37,309 million and Ksh 21,800 million is domestic and external debt service respectively. This rise is due to resumption of payment of debts not covered under the 2004 Paris Club rescheduling agreement following the end of the Consolidation Period at the end of December 2006 and also the increased cost of servicing the domestic debt stock. Reforms in public debt management will focus on undertaking DSA and preparation of the National Debt Strategy, strengthening of the institutional and legal framework, on-line debt database link between MoF and CBK and scaling up of staff capacity building.
1.
INTRODUCTION
This is the second Annual Public Debt Management Report by the Ministry of Finance. The first report was published in 1994 and considerable changes have taken place in the public debt management arena over the last ten years. In order to close this knowledge gap, the 2005/6 Annual Public Debt Management Report
will include the following:
• An overview of public debt management over the period 1996-2005 highlighting key developments in public debt management since the last debt report in 1994.
• Analysis of key developments in external and domestic debt in the fiscal year 2005/06.
• Comparative analysis of Kenya’s public debt.
• Suspension of settlement of external commercial debts.
• Highlights of 2003 IMF Debt Sustainability Analysis Report on Kenya. • Current reforms in public debt management.
2.
OVERVIEW (1996 – 2005)
2.1
Institutional Framework
In 1985, the Swedish International Development Agency (SIDA) and the Commonwealth Secretariat (ComSec) supported a debt management project aimed at capacity building in sovereign debt management at the Ministry of Finance. Consequently, a Debt Management Division was established in 1987 within the Fiscal and Monetary Affairs Department. However by 2001, the Division’s core function had been reduced to recording of external debt and determining concessionality of external loan proposals through computation of the grant element as most of the well trained staff had left for better paying jobs. The Division was upgraded to a department status in July 2002.
Public debt management in Kenya over the years was characterized by weak institutional arrangements with debt functions spread across departments at the MoF and CBK. Besides DMD, the other departments/institutions involved in public debt management activities include;
• External Resources Department (ERD): Sources for external finance,
negotiates and contracts loans. It monitors disbursements of external loans and grants and, liaises closely with project coordinators in line ministries.
• The Central Bank of Kenya: Manages public domestic debt on behalf of
the Treasury. This includes contracting domestic debt through sale of Treasury Bills and Bonds, extending overdraft facilities to the Government, maintaining domestic debt register and making payments of domestic debt. As a Banker to the Government, CBK effects payments to external creditors on specific instructions from the Treasury.
• The Department of Government Investments and Public Enterprises
(DGIPE): Facilitates on lending of donor funds to public enterprises. It
also monitors and receives repayments by these enterprises on behalf of the Government.
• The Attorney General’s Office: Principal legal adviser to Government
and is responsible for reviewing draft loan agreements to ensure conformity with the relevant legislation.
• Accountant General’s Department: Responsible for cash management
• Controller & Auditor General: Responsible for issuance of authority to debit the Consolidated Fund Service account to settle Government debts. It under-takes periodic audits of public debt.
The debt management functions within MoF and CBK were guided by weak debt policy framework and adhoc debt management strategies. Under-staffing and high staff turnover was evident particularly within DMD thus undermining operational efficiency. The external debt database was incomplete and unreliable. There were no operations manuals documenting business processes including workflows and the public debt registry lacked complete public debt records.
In 2003, the Government requested the World Bank for technical assistance to carry out a study on existing public debt management practises and make recommendations on appropriate reforms. In response, a joint mission of the World Bank and IMF prepared an Assessment Report on Central Government
Debt Management and Domestic Debt Market Development Program. The report
recommended a road map on establishment of a DMO and strengthening of domestic debt markets in accordance with best practice as outlined in the 2001
IMF/World Bank Guidelines for Public Debt Reforms..
In 2004, the Government approved the recommendations of the IMF/WB
Assessment Report and signed a credit agreement with the World Bank to support
establishment of a DMO and strengthen domestic debt markets. A total of USD 1.5 million was earmarked for the project to be financed and coordinated under the five year Financial and Legal Sector Technical Assistance Project
(FLSTAP). Two other partners in the initiative are the ComSec and the
Macroeconomic and Financial Management Institute of East and Southern
Africa (MEFMI). Two senior officials were seconded from the CBK in August
2004 to spearhead the reforms. The main activities under the project are:
• Establishment of a comprehensive and reliable public debt database supported by an effective back office.
• Consolidation of debt management functions currently spread within MoF and CBK under one unit, the DMO.
• Capacity building
• Preparation of debt objectives and strategies to guide the operations of DMO.
2.2
The Legal Framework
Currently, there exist four different but related Acts of Parliament governing public debt management in Kenya, namely: the External Loans & Credits Act (Cap 422), Internal Loans Act (Cap 420), Guarantee Loans Act Cap 461 and the Central Bank of Kenya Act (Cap 491).
The External Loans & Credits Act empowers the Minister for Finance to negotiate the terms and conditions for contracting external loans and credits for the country. The current ceiling for the stock of external debt is Ksh 500,000 million, which was set by Parliament in 2000 and is subject to review. The Act requires the Minister for Finance to report to Parliament details of any new borrowing.
The Internal Loans Act empowers the Minister for Finance to borrow on behalf of Government directly from the domestic market through issuance of Treasury bills and bonds. The Act allows the Government access to an overdraft at the CBK when there is a mismatch between revenue receipts and expenditures. However, to check inflationary pressures resulting from use of the overdraft facility, the CBK Act limits the overdraft level to 5 percent of the latest audited Government revenue.
Guaranteed borrowing by Government enterprises and local authorities is contracted under the Guarantee Loans Act. The current ceiling for guaranteed borrowing as set by Parliament in 1993 is Ksh 80,000 million. Parliamentary approval is required for issuance of a Guarantee to a public enterprise and local authority.
2.3
Debt Management Objectives
The Government borrows mainly to cover its financing requirements. In addition, the Government borrows from the IMF for balance of payments purposes. The ad hoc strategy of the Government has been to borrow as much as possible from external lenders on concessional terms while domestic borrowing is only used to cover the remaining resource gap.
The strategy ensures that the debt portfolio is divided into two distinct sub-portfolios from a cost and risk perspective. External debt is long term in nature and is characterised by low interest rates while domestic debt is relatively short term with higher interest rates. The emerging risks on the debt portfolio are mainly related to the currency exposure for the foreign debt and the rollover risk on the domestic debt.
Although not documented, the ad hoc debt management strategy of the Government is as outlined in Box 1.
Box 1: Debt Management Strategy
• Ensure that both the level and the rate of growth of Kenya’s public debt are fundamentally sustainable over time.
• Seek more debt relief on a bi-lateral basis to release resources to core poverty programs in the Economic Recovery Strategy framework. Debt for development swaps option will be encouraged.
• The Government will contract new concessional foreign loans from multilateral and bilateral sources. Such foreign borrowing must have a grant element of at least 35 percent and will be used to finance core poverty programs.
• In projects that cannot be financed by these type of creditors, external borrowing will be contracted from internationally credit rated commercial banks and financial institutions
• The debt portfolio will continually be reviewed and restructured to minimise debt-servicing costs.
• Domestic borrowing and monetary policies will be closely coordinated so as to ensure that the government raises required resources from the financial market without destabilising interest rates and consequently crowding out the private sector.
• Efforts will be made to lengthen Treasury bond maturity to promote development of the capital markets.
• Ensure that the outstanding external debt stock is within the limit authorised by Parliament.
2.4
Public Debt Stock
Kenya’s public debt stock increased from Ksh 466,294 million (67.8 percent of GDP) at the end of June 1996 to Ksh 750,025 million (55.6 percent of GDP) at the end of June 2005 (Table 2.1 and Chart 2.1). Domestic debt rose from Ksh 120,355 million (17.5 percent of GDP) to Ksh 315,573 million (23.4 percent of GDP) while external debt rose from Ksh 345,939 million (50.3 percent of GDP) to Ksh 434,453 million (32.2 percent of GDP) during the period. In US dollar terms, however, external debt fell from US$ 6,025 million in 1996 to US$ 5,701 million in 2005. The increase in external debt in shillings terms was due to depreciation of the Kenya shilling against other currencies over the period.
The composition of public debt also changed significantly, with the share of domestic debt increasing from 25.8 percent of total debt at the end of June 1996
to 42.1 percent at the end of June 2005. The proportion of external debt in total debt fell from 74.2 percent to 57.9 percent in the same period. The shift in the composition of debt was mainly attributed to reduced access to external funding. Despite the rise in the stock of debt in the period, the share of overall debt to GDP declined mainly due to a faster growth in GDP compared to the debt.
Table 2.1: Public Debt Stock in Ksh Million (1996-2005)
Jun-96 Jun-97 Jun-98 Jun-99 Jun-00 Jun-01 Jun-02 Jun-03 Jun 04 Jun 05 345,939 307,729 323,339 407,792 395,564 393,978 377,748 407,053 443,157 434,453 Bilateral 127,753 114,084 108,256 147,937 138,553 132,269 129,973 142,593 162,914 157,669 Multilateral 187,812 163,802 179,276 220,192 230,662 228,497 222,452 233,829 260,658 255,784 Commercial Banks 28,996 26,302 34,915 35,799 24,867 29,423 24,031 3,597 2,912 1,776 Export Credit 1,378 3,540 892 3,864 1,481 3,789 1,292 27,034 16,674 19,224 (As a % of GDP) 50.3 42.2 39.9 55.1 50.9 40.7 36.8 39.2 36.6 32.2 (As a % of total debt) 74.2 65.9 65.3 70.1 65.7 65.0 61.5 58.4 59.1 57.9 DOMESTIC 120,355 159,077 171,730 174,305 206,127 211,813 235,991 289,377 306,235 315,573 (As a % of GDP) 17.5 21.8 21.2 23.6 26.5 21.9 23.0 27.9 25.3 23.4 25.8 34.1 34.7 29.9 34.3 35.0 38.5 41.6 40.9 42.1 GRAND TOTAL 466,294 466,806 495,070 582,097 601,691 605,791 613,739 696,430 749,392 750,025 (As a % of GDP) 67.8 64.0 61.1 78.7 77.4 62.6 59.8 67.1 62.0 55.6
S ources: Treasury & Central Bank of Kenya
EXTERNAL
(As a % of total debt)
Chart 2.1: Public Debt Stock (1996-2005)
0.00 50000.00 100000.00 150000.00 200000.00 250000.00 300000.00 350000.00 400000.00 450000.00 A m o u s n t i n K sh M illio n
Jun-96 Jun-97 Jun-98 Jun-99 Jun-00 Jun-01 Jun-02 Jun-03 Jun 04 Jun 05
Ex te rna l Dome stic
Source: Treasury and Central Bank of Kenya
During the last decade, a large proportion of external loans were used to finance roads, water and sewerage, energy, education and health projects and programmes. The IDA, African Development Bank Group and the European Investment Bank remained the major multilateral creditors while Japan, France and Germany were the leading bilateral creditors over the same period. External commercial loans were used to finance security related projects.
2.5
Debt Relief Initiatives
A debtor country facing debt-servicing difficulties seeks debt relief. Creditors on a voluntary basis may also grant debt relief. The relief takes the form of waivers, bilateral or commercial debt rescheduling and conversions.
Despite the rising debt stock, recent DSA indicate that Kenya’s debt is sustainable in the long run. Thus, the country does not qualify for debt relief under HIPC and MDRI. Both the HIPC and the MDRI debt relief initiatives seek to deliver deeper relief beyond what is currently offered under the Paris Club rescheduling framework. The two initiatives are meant for countries whose debt burdens are unsustainable and cannot be resolved by the various debt rescheduling packages (options) available under the Paris Club.
Over the last ten years, Kenya has received debt relief in various forms:
(i) Under the Paris Club, Kenya has rescheduled arrears and debt flows as follows:
• In 2000 and 2004, Kenya rescheduled, under the Paris Club, debt arrears and flows amounting to US$ 650 million, effectively receiving 50 percent debt relief in present value (PV) terms. Under the Paris Club rescheduling, ODA debt is repaid over 20 years including 10 years grace period at below market interest rates while non-ODA debt is repaid over 15 years including 5 years grace period at commercial interest rates.
• China, Finland and Netherlands opted to cancel debts amounting to US$ 30 million instead of rescheduling the debt under the Paris Club in the same period.
(ii) The Government is negotiating with the Government of Italy for deeper debt relief through a debt-for-development swap. The arrangement will entail cancellation of an equivalent of US$43 million of Paris Club rescheduled ODA debt on condition that the funds are channeled towards poverty alleviation programs.
Although Kenya could have received deeper relief of up to 67 percent under the
Naples Terms, this would have worsened the country’s credit risk rating,
undermining the ability of the Government (including Kenya’s private sector) to access credit in the international financial markets at competitive terms. Furthermore, some creditors may not be willing to offer additional resources in form of “new loans” to countries seeking relief beyond Houston Terms. The
Government intends to build on the debt-for-development swap framework as one option of financing the Millennium Development Goals.
2.6
Debt Service
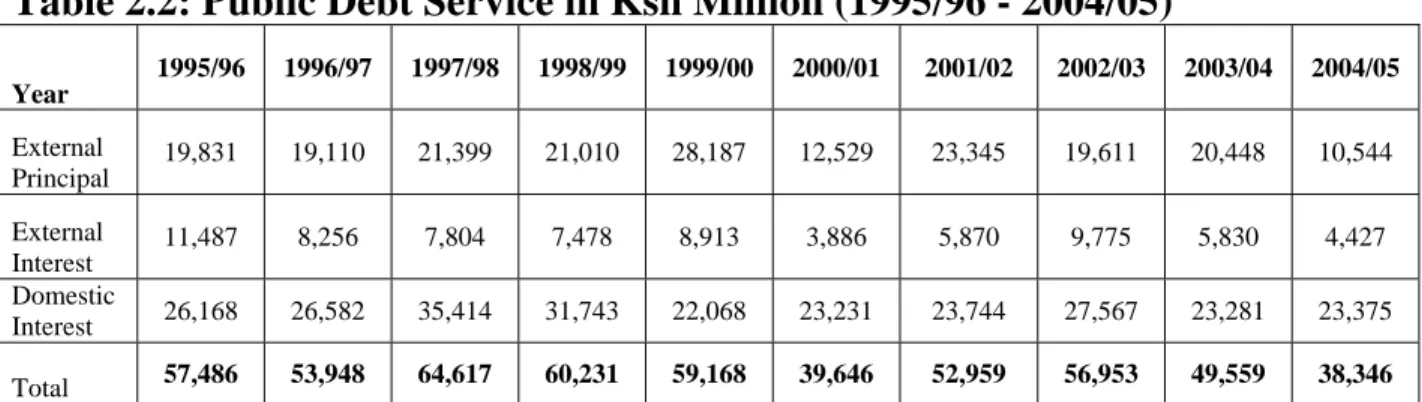
Kenya’s overall debt service1 declined by Ksh 19,140 million (33.3 percent), from Ksh 57,487 million in the fiscal year 1995/96 to Ksh 38,346 million in the fiscal year 2004/05 (Table 2.2 and Chart 2.2). Expressed as a ratio of total Government revenue, the debt service fell from 39.5 percent to 13.2 percent during the period. Interest payments on domestic debt decreased from Ksh 26,168 million to Ksh 23,375 million during the period while external debt service fell from Ksh 31,319 million to Ksh 14,971 million. This was attributed to a reduction in external borrowing and the impact of 2004 Paris Club debt rescheduling. Furthermore, the Government did not achieve the domestic borrowing target for the fiscal year 2004/05. Instead, there was a Ksh 6,672 million net repayment of domestic debt.
Table 2.2: Public Debt Service in Ksh Million (1995/96 - 2004/05)
Year 1995/96 1996/97 1997/98 1998/99 1999/00 2000/01 2001/02 2002/03 2003/04 2004/05 External Principal 19,831 19,110 21,399 21,010 28,187 12,529 23,345 19,611 20,448 10,544 External Interest 11,487 8,256 7,804 7,478 8,913 3,886 5,870 9,775 5,830 4,427 Domestic Interest 26,168 26,582 35,414 31,743 22,068 23,231 23,744 27,567 23,281 23,375 Total 57,486 53,948 64,617 60,231 59,168 39,646 52,959 56,953 49,559 38,346
Source: Treasury and Central Bank of Kenya
1
Includes principal and interest repayments on external debt and interest payments on domestic debt
Chart 2.2: Public Debt Service in Ksh Million (1995/96-2004/05) -5,000 10,000 15,000 20,000 25,000 30,000 35,000 40,000 1995/96 1996/97 1997/98 1998/99 1999/00 2000/01 2001/02 2002/03 2003/04 2004/05 K S h M illi on
EXTERNAL PRINCIPAL EXTERNAL INTEREST DOMESTIC INTEREST
Source: Treasury and Central Bank of Kenya
The proportion of the interest payments to the stock of domestic debt has generally been declining since the fiscal year 1997/98 due to a steady decline in interest rates (Chart 2.3 and 2.4). The structure of debt service has been changing. The external debt service accounted for 54.5 percent of the total debt service in 1995/96 compared with domestic interest, which accounted for 45.5 percent. At the end of June 2005, the proportion of external and domestic debt service in total debt service stood at 39.0 percent and 61.0 percent respectively.
Chart 2.3: 91- Day Average Treasury Bill Interest Rate (1996 - 2005)
0 . 0 5 . 0 1 0 . 0 1 5 . 0 2 0 . 0 2 5 . 0 3 0 . 0 Ju n-96 Dec -96 Ju n-97 Dec -97 Ju n-98 Dec -98 Ju n-99 Dec -99 Ju n-00 Dec -00 Ju n-01 Dec -01 Ju n-02 Dec -02 Ju n-03 Dec -03 Ju n-04 Dec -04 Ju n-05 Dec -05 Rate (p ercen t)
Chart 2.4: Ratio of Domestic Interest Payments to Domestic Debt Stock (1996 - 2005) 0.00 0.05 0.10 0.15 0.20 0.25
Jun-96 Jun-97 Jun-98 Jun-99 Jun-00 Jun-01 Jun-02 Jun-03 Jun 04 Jun 05
D o m e s tic Interes t/D omes tic D e bt
Source: Central Bank of Kenya
2.7
Disbursements
As shown in Table 2.3, donor disbursements through project and programme loans were quite erratic between the fiscal years 1999/00 and 2004/05. For instance, except for 2000/01 and 2003/04, there were no disbursements of programme loans during the period. The large receipt of donor funding in the fiscal year 2000/01 is largely attributed to Ksh 4,382 million loans for financing drought. The decline in disbursements since the fiscal year 2000/01 was attributed to unpredictability of funding from the development partners. This is attributed to slippage in reforms and low absorption capacity.
Table 2.3: Disbursements (Ksh Million)
1996/97 1997/98 1998/99 1999/00 2000/01 2001/02 2002/03 2003/04 2004/05
Project Cash Loans 2,805 2,180 1,625 2,830 8,719 2,898 2,191 2,285 3,741 Programme Loans 1,131 249 344 - 4,045 - - 5,993 -Project A-I-A 8,540 11,473 10,231 6,020 5,323 7,133 5,276 3,361 3,497
Total 12,476 13,902 12,200 8,850 18,087 10,031 7,467 11,639 7,238 Source: Treasury
2.8
Concessionality of External Debt
The concessionality of a loan is determined by the maturity period, the grace period and the interest rate. The Government external debt strategy is to contract loans with a grant element of at least 35 percent. The current structure of Kenya’s external debt shows that a large proportion is owed to multilateral and bilateral creditors on highly concessional terms. The longer maturity and grace period, and the below market interest rates on loans from multilateral and bilateral agencies is ideal for financing projects in the social sectors with longer payback periods.
The concessional nature of the country’s external borrowing is also evident from Table 2.4. The average terms of new commitments for Kenya deteriorated slightly between 1996 and 2005. New commitments had a maturity of about 32.5 years down from 36.3 years, an interest rate of 1.3 percent up from 0.8 percent, and a grace period of about 8.6 years down from 9.3 years.
Table 2.4: Average Terms of New Commitments
1996 2005
Interest rate (percent) 0.8 1.3
Maturity (years) 36.3 32.5
Grace period (years) 9.3 8.6
Grant element (percent) 77.1 74
Source: Treasury
2.9
Publicly Guaranteed Debt
A parastatal or public enterprise requires prior authority from the parent Ministry and Treasury to contract new borrowing. The Guarantee (Loans) Act (Cap 461) governs the issuance of Government guarantee to State Corporations (Parastatals) and local authorities. All Government guarantees must be authorised by Parliament. The current ceiling for Government guaranteed borrowing, as set by Parliament in 1993 is Ksh 80,000 million.
2.10
Domestic Debt
Government domestic borrowing from the fiscal years 1995/96 to 2004/05 was mainly through Government securities, overdraft at the CBK and advances from commercial banks. Government securities comprised of Treasury bills, Treasury bonds and long-term stocks. During the period, Treasury bills were issued in maturities of 91 days and 182 days, which were non-tradable in the secondary market. Treasury bonds, on the other hand were issued in maturities of between one and ten years, and were tradable in the secondary market. The types of bonds
issued in the period were zero coupon, floating rate, fixed coupon discounted, special floating rate, special fixed rate, and fixed rate bonds.
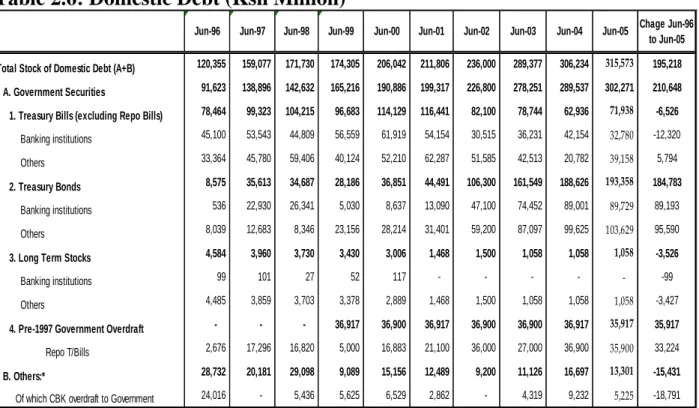
As shown in Table 2.6, domestic debt increased from Ksh 120,355 million in June 1996 to Ksh 315,573 million in June 2005. This represented an increase of Ksh 195,218 million or a growth of 162.2 percent in domestic debt during the period. The stock of Government securities increased by Ksh 210,648 million or 229.9 percent during the period from Ksh 91,623 million to Ksh 302,271 million. Other forms of domestic debt which include Government overdraft at the CBK, clearing items, advances from commercial banks and tax reservation certificates, decreased by Ksh 15,431 million during the period to stand at Ksh 13,301 million from Ksh 28,732 million. In particular, the level of Government overdraft at the Central bank declined by 78.2 percent during the period to Ksh 5,225 million from Ksh 24,016 million.
The stock of Treasury bills (excluding Repos) decreased by Ksh 6,526 million or 8.3 percent from Ksh 78,464 million in June 1996 to Ksh 71,938 million in June 2005. Similarly, outstanding Government long-term stocks fell by Ksh 3,526 million during the period to stand at Ksh 1,058 million at the end of June 2005. However, the stock of Treasury bonds increased by Ksh 184,783 million or 2,154.9 percent in the period to stand at Ksh 193,358 million at the end of June 2005 from Ksh 8,575 million at the end of June 1996.
Government Stocks are long-term debt instruments with a period to maturity ranging from 5 to 40 years. The first issues of Government Stocks were on September 16th 1980, in attempt to lengthen maturity structure of domestic debt. Interest rates were fixed and payable semi-annually and ranged from 6.0 percent to 11 percent per annum for 5-year and 40-year stocks respectively. The instrument was not tradable, and therefore illiquid and less attractive to investors. During the period under review, there were no new issues of Government long-term stocks.
In May 2001, the Government initiated steps to restructure public domestic debt and develop the domestic debt markets. The purpose was two-fold: First, to restructure domestic debt from the short-dated Treasury bills to the long-dated Treasury bonds in order to reduce the risks associated with short-term borrowing. As a result, the stock of Treasury bills (excluding Repos) declined from Ksh 116,441 million in June 2001 to Ksh 71,938 in June 2005 while the Treasury bonds portfolio rose from Ksh 44,491 million to Ksh 193,358 million in the same period. This led to a complete shift of the ratio of Treasury bills to bonds from 76:24 in May 2001 to 30:70 in June 2005. In addition, the maturity profile of Government securities rose from 3 months in May 2001 to 2 years 2 months in June 2005. Secondly, to develop a secondary market for Government securities.
It was envisaged that the secondary market for Government securities would promote financial resource mobilization for both the public and private sector through the financial market.
Reflecting on the success of the Government bond issuance programme, the volume of Treasury bonds traded at the Nairobi Stock Exchange increased tremendously from Ksh 5,217 million in the fiscal 2000/01 to Ksh 15,137 million in the fiscal year 2004/05.
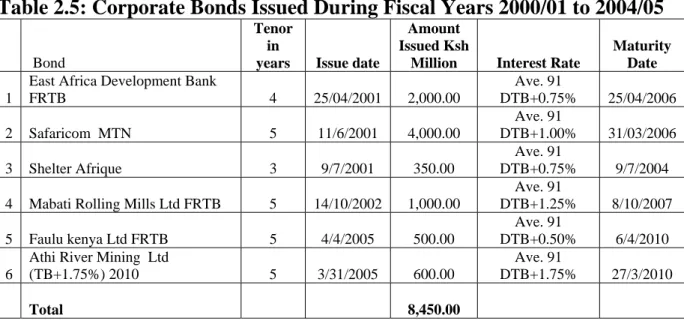
In addition, as shown in Table 2.5, more institutions successfully issued corporate bonds through the financial market to finance their activities in the period under review. As at end of June 2005, outstanding corporate bonds stood at Ksh 8,100 million
Table 2.5: Corporate Bonds Issued During Fiscal Years 2000/01 to 2004/05 Bond
Tenor in
years Issue date
Amount Issued Ksh
Million Interest Rate
Maturity Date
1
East Africa Development Bank
FRTB 4 25/04/2001 2,000.00 Ave. 91 DTB+0.75% 25/04/2006 2 Safaricom MTN 5 11/6/2001 4,000.00 Ave. 91 DTB+1.00% 31/03/2006 3 Shelter Afrique 3 9/7/2001 350.00 Ave. 91 DTB+0.75% 9/7/2004
4 Mabati Rolling Mills Ltd FRTB 5 14/10/2002 1,000.00 Ave. 91 DTB+1.25% 8/10/2007 5 Faulu kenya Ltd FRTB 5 4/4/2005 500.00 Ave. 91 DTB+0.50% 6/4/2010 6
Athi River Mining Ltd
(TB+1.75%) 2010 5 3/31/2005 600.00 Ave. 91 DTB+1.75% 27/3/2010 Total 8,450.00
Source: Nairobi Stock Exchange
A weak fiscal framework in the early 1990s led to excessive borrowing by the Government from the CBK through the overdraft facility. The larger overdraft had inflationary effects and CBK was forced to mop the resulting excess liquidity at high interest rates to contain run-away inflation. In 1996, the CBK Act was amended to limit direct borrowing by the Government from the CBK to 5 percent of the most recent audited Government revenues. This legislature measure was meant to establish a cap on Government borrowing from CBK and to strengthen the latter’s independence in the conduct of monetary policy. Government overdraft from CBK declined dramatically from Ksh 24,016 in end June 1996 to an average of Ksh 5,000 million over the last 10 years (Table 2.6).
Table 2.6: Domestic Debt (Ksh Million)
Jun-96 Jun-97 Jun-98 Jun-99 Jun-00 Jun-01 Jun-02 Jun-03 Jun-04 Jun-05 Chage Jun-96 to Jun-05 Total Stock of Domestic Debt (A+B) 120,355 159,077 171,730 174,305 206,042 211,806 236,000 289,377 306,234 315,573 195,218
A. Government Securities 91,623 138,896 142,632 165,216 190,886 199,317 226,800 278,251 289,537 302,271 210,648 1. Treasury Bills (excluding Repo Bills) 78,464 99,323 104,215 96,683 114,129 116,441 82,100 78,744 62,936 71,938 -6,526
Banking institutions 45,100 53,543 44,809 56,559 61,919 54,154 30,515 36,231 42,154 32,780 -12,320 Others 33,364 45,780 59,406 40,124 52,210 62,287 51,585 42,513 20,782 39,158 5,794
2. Treasury Bonds 8,575 35,613 34,687 28,186 36,851 44,491 106,300 161,549 188,626 193,358 184,783
Banking institutions 536 22,930 26,341 5,030 8,637 13,090 47,100 74,452 89,001 89,729 89,193 Others 8,039 12,683 8,346 23,156 28,214 31,401 59,200 87,097 99,625 103,629 95,590
3. Long Term Stocks 4,584 3,960 3,730 3,430 3,006 1,468 1,500 1,058 1,058 1,058 -3,526
Banking institutions 99 101 27 52 117 - - - - - -99 Others 4,485 3,859 3,703 3,378 2,889 1,468 1,500 1,058 1,058 1,058 -3,427
4. Pre-1997 Government Overdraft - - - 36,917 36,900 36,917 36,900 36,900 36,917 35,917 35,917
Repo T/Bills 2,676 17,296 16,820 5,000 16,883 21,100 36,000 27,000 36,900 35,900 33,224
B. Others:* 28,732 20,181 29,098 9,089 15,156 12,489 9,200 11,126 16,697 13,301 -15,431
Of which CBK overdraft to Government 24,016 - 5,436 5,625 6,529 2,862 - 4,319 9,232 5,225 -18,791 *Others includes Government overdraft at the CBK, clearing items awaiting transfer to PMG, commercial bank advances and tax reserve certificates
3.
PUBLIC DEBT DEVELOPMENTS (2005-2006)
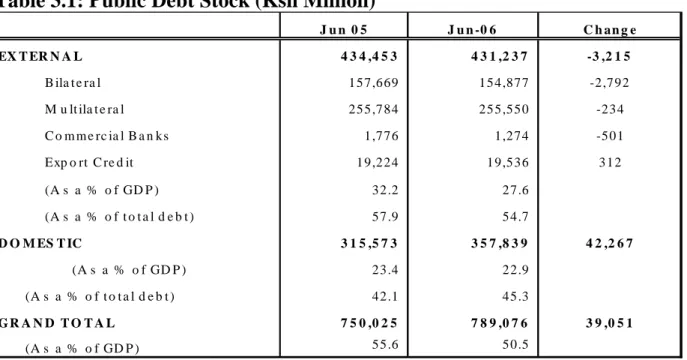
Kenya’s public debt stock increased by Ksh 39,051 million in the fiscal year 2005/06 to stand at Ksh 789,076 million (50.5 percent of GDP) compared with Ksh 750,025 million (55.6 percent of GDP) at the end of the fiscal year 2004/05 (Table 3.1). Domestic debt rose from Ksh 315,573 million (23.4 percent of GDP) to Ksh 357,839 million (22.9 percent of GDP) while external debt declined from Ksh 434,453 million (32.2 percent of GDP) to Ksh 431,237 million (27.6 percent of GDP) during the period. Despite the rise in the stock of debt in the period, the ratio of overall debt to GDP declined mainly due to faster growth in GDP.
The share of domestic debt in the overall debt increased from 42.1 percent of total debt at the end of June 2005 to 45.3 percent at the end of June 2006 while the proportion of external debt fell from 57.9 percent to 54.7 percent in the same period. The shift in the composition of debt was mainly attributed to reduced access to external funding and increased domestic borrowing to finance the deficit.
Table 3.1: Public Debt Stock (Ksh Million)
J u n 0 5 J u n -0 6 C h an g e 4 3 4 ,4 5 3 4 3 1 ,2 3 7 -3 ,2 1 5 B ila t e ra l 157,669 154,877 -2,792 M u lt ila t e ra l 255,784 255,550 -234 C o m m e rc ia l B a n ks 1,776 1,274 -501 Exp o rt C re d it 19,224 19,536 312 (A s a % o f GD P ) 32.2 27.6 (A s a % o f t o t a l d e b t ) 57.9 54.7 D O M ES T IC 3 1 5 ,5 7 3 3 5 7 ,8 3 9 4 2 ,2 6 7 (A s a % o f GD P ) 23.4 22.9 42.1 45.3 G R A N D T O T A L 7 5 0 ,0 2 5 7 8 9 ,0 7 6 3 9 ,0 5 1 (A s a % o f GD P ) 55.6 50.5 S o u r ce s : T r e a s u ry & C e n t r a l B a n k o f K e n y a EX T ER N A L (A s a % o f t o t a l d e b t )
3.1
EXTERNAL DEBT
3.1.1
External Debt Stock
External debt declined by Ksh 3,215 million or 0.7 percent from Ksh 434,453 million at the end of June 2005 to Ksh 431,237 million at the end of June 2006 (Table 3.1). Similarly, the proportion of external debt in GDP fell from 32.2 percent to 27.6 percent in the period while that of external debt to total debt fell from 57.9 percent to 54.7 percent. However, in US dollar terms, the debt stock increased from USD 5,701 million to USD 5,837 million due to the appreciation of the Kenya shilling against the US dollar.
As shown in Table 3.1, external debt owed to multilateral and bilateral creditors stood at Ksh 255,550 million and Ksh 154,877 million respectively at the end of June 2006. This represented 59.3 percent and 35.9 percent of total external debt respectively at the end of June 2006 (Chart 3.1b) as compared to 58.9 percent and 36.3 percent for the previous year (Chart 3.1a). During the period, the debt owed to commercial creditors amounted to Ksh 1,274 million or 0.3 percent of the total external debt. Suppliers’ credits amounted to Ksh 19,536 million or 4.5 percent of total external debt at the end of June 2006.
Chart 3.1 a: External Debt Stock by Creditor Category J U N E 2 0 0 5 B i l a t e r a l 3 6 . 3 % M u l t i l a t e r a l 5 8 . 9 % C o m m e r c i a l 0 . 4 % S u p p l i e r s c r e d i t s 4 . 4 % Source: Treasury
Chart 3.1 b: External Debt Stock by Creditor Category J U N E 2 0 0 6 B i l a t e r a l 3 5 . 9 % S u p p l i e r s c r e d i t s 4 . 5 % C o m m e r c i a l 0 . 3 % M u l t i l a t e r a l 5 9 . 3 % Source: Treasury
As shown in Chart 3.2, IDA was the largest multilateral creditor to Kenya (47.4 percent), followed by the African Development Bank Group (6 percent) and the European Investment Bank (3.1 percent). On the hand Japan (18.4 percent) was the leading bilateral lender at the end of June 2006 followed by France (4.3 percent) and Germany (3.2 percent)
Chart 3.2: External Debt by Major Creditor (end June 2006)
Others 17.6% Germany 3.2% France 4.3% Japan 18.4% EIB 3.1% IDA 47.4% ADB 6.0% Source: Treasury
3.1.2
Currency Structure of External Debt
External debt was held in 14 different currencies as at June 2006. These were the Canadian dollar, Danish Kroner, Euro, Indian Rupee, Kenya shilling, Kuwaiti Dinar, Pound Sterling, Saudi Riyal, Swedish Kroner, Swiss Franc, US dollar, Korean Won, Japanese Yen, and Chinese Yuan. The Euro, US dollar, Japanese
Yen and Sterling Pound comprised the largest proportion of the external debt (Chart 3.3).
The currency structure remained virtually unchanged during the fiscal year 2005/06. The share of external debt held in Euros declined marginally from 35 percent at the end of June 2005 to 34 percent at the end of June 2006 while the share of the debt held in US dollars increased from 31 percent to 32 percent in the same period. The proportion of debt held in Japanese Yen and Sterling Pound remained unchanged from the end June 2005 position of 27 percent and 6 percent respectively. However, the currency composition of external debt at the end of the period is not a reflection of a debt management strategy.
Chart 3.3: External Debt by Currency
Sterling Pound 6.0% Others 1.0% US dollar 32.0% Euro 34.0% Japanese Yen 27.0% Source: Treasury
3.1.3
Maturity Structure
Kenya’s external debt is mainly long-term, with about 97 percent having a maturity of over 10 years as at the end of June 2005 and June 2006. Approximately 3 percent of the external debt portfolio had a maturity of less than 10 years during the period (Chart 3.4a and 3.4b). These developments are consistent with the Government’s strategy of borrowing on concessional terms.
Chart 3.4a: External Debt by Maturity J u n e 2 0 0 5 1 - 5 Y e a r s 0 . 4 % 5 - 1 0 Y e a r s 2 . 7 % O v e r 1 0 Y e a r s 9 6 . 9 % Source: Treasury
Chart 3.4b: External Debt by Maturity J u n e 2 0 0 6 O v e r 1 0 Y e a r s 9 7 . 4 % 1 - 5 Y e a r s 0 . 2 % 5 - 1 0 Y e a r s 2 . 4 % Source: Treasury
3.1.4
Concessionality
The largest proportion of external debt was contracted on Official Development Assistance (ODA) concessional terms. The factors determining the concessionality of a loan include interest rates, loan maturity, and grace period. As shown in Table 3.2, there was a general improvement in interest rate and average maturity terms between June 2005 and June 2006. However, at the end of the fiscal year, the debt portfolio reflected a reduction in the average grace period due to new bi-lateral loans with relatively short grace period.
Table 3.2: Average Terms for Outstanding External Loans
Terms June 2005 June 2006
Interest rate (percent) 1.3 0.8
Maturity (Years) 32.5 36.1
Grace Period (Years) 8.6 8.1
Grant Element (percent) 74 81.4
Source: Treasury
The average interest rate dropped from the previous year’s average of 1.3 percent as at end June 2005 to 0.8 percent at the end of June 2006. The average maturity lengthened by 3.6 years from 32.5 years to 36.1 years in the same period. However, the average grace period on loans fell from 8.6 years at the end of June 2005 to 8.1 years at the end of June 2006.
The overall impact of these developments was an increase in the level of concessionality of the external debt portfolio with the average grant element on loans from 74 percent at the end of June 2005 to 81.4 percent at the end of June 2006. All external loans contracted during the period had a minimum grant element of 35 percent. During the period, the Government did not contract any new commercial loans.
3.1.5
External Debt Service
Total external debt service decreased from Ksh 14,971 million (4.9 percent of revenue) in the fiscal year 2004/05 to Ksh 12,875 million (4.1 percent of revenue) in the fiscal year 2005/06 (Table 3.3). The decline was mainly in principal repayments, which decreased from Ksh 10,544 million to Ksh 9,229.5 million in the same period. Interest payments also decreased from Ksh 4,421 million to Ksh 3,645.4 million during the period.
The substantial decline in external debt service was caused by the Government’s decision to defer debt service payments due to some external commercial creditors pending resolution of audit findings by the Controller & Auditor General.
Table 3.3: External Debt Service in Million Ksh (2004/05 - 2005/06)
Multilateral Bilateral Commercial Total
Jun-05 Jun-06 Jun-05 Jun-06 Jun-05 Jun-06 Jun-05 Jun-06
Principal Repayments 7,235 7,236.7 2,505 1,547.5 804 445.3 10,544 9,229.5 Interest Payments 2,627 2,337.4 1,417 1,226.5 383 81.6 4,427 3,645.4 Total 9,862 9,574.1 3,922 2,774.0 1,187 526.9 14,971 12,874.9 Source: Treasury
3.1.6
Disbursements
As shown in Table 3.4, donor disbursements through project loans and programme loans increased by Ksh 1,750 million from Ksh 7,238 million in the fiscal year 2004/05 to Ksh 8,988 million in the fiscal year 2005/06. During the period, programme loans increased from none to Ksh 1,572 million while project loans increased from Ksh 7,238 million to Ksh 7,416 million.
Table 3.4: External Debt Disbursements in Million Ksh (2004/05 - 2005/06)
2 0 0 4 /0 5 2 0 0 5 /0 6 C h a n g e P r o jec t C a s h L o a n s 3 ,7 4 1 2 ,7 8 8 - 9 5 3 P r o gr a m m e L o an s - 1 ,5 7 2 1 ,5 7 2 P r o jec t A - I - A 3 ,4 9 7 4 ,6 2 8 1 ,1 3 1 T o t a l 7 ,2 3 8 8 ,9 8 8 1 ,7 5 0 Source: Treasury
It suffices to note that although there was an improvement in disbursement, the amount was way below the annual target. The amount disbursed of Ksh 8,988 million was only 57.1 percent of the target disbursement of Ksh 15,741 million. Similarly, in the previous year, out of the targeted amount of Ksh 12,978 million, only Ksh 7,298 million (56 percent) was disbursed. The low absorption of donor funds is one of the critical issues to be addressed in the proposed Kenya External Aid Policy2.
3.1.7
Government Guaranteed Loans
The outstanding publicly guaranteed debt as at 30th June 2006 was Ksh 43,555 million. The amount comprised of Ksh 25,197 million owed to external creditors while Ksh 18,358 million was owed to a local creditor (National Bank of Kenya). Table 2.5 below summarizes the outstanding publicly guaranteed debt. In 2004, the Government issued a guarantee of Ksh 7,356 million to Kenya Electricity
2
Generating Company Ltd for a borrowing from the Japan Bank for International Cooperation to finance the Sondu Miriu II Hydroelectric power project.
Table 2.5: Publicly Guaranteed Debts as at 30th June 2006
Parastatal Creditor
Outstanding
Guarantee (Ksh Mn)
1 Nairobi City Council USA 533.78
2 Telkom Kenya Italy & Japan 6,533.85
3 Tana & Arthi River Development Authority Japan 2,498.25
4 East Africa Portland Cement Japan 3,105.56
5 Kenya Electricity Generating Company Ltd Japan 12,525.48
6 Various National Bank of Kenya 18,358.41
Total 43,555.33
Source: Treasury
3.2
DOMESTIC DEBT
3.2.1
Stock of Domestic Debt
Government domestic debt increased by Ksh 42,266 million in the fiscal year 2005/06 to stand at Ksh 357,839 million at the end of June 2006 from Ksh 315,573 million at the end of June 2005. This represents a growth of 13.4 percent in the debt during the period. As shown in Table 3.5, the rise in the debt was attributed to increases of Ksh 22,838 million and Ksh 25,000 million in the stock of Treasury bills and Treasury bonds respectively during the period. However, these increases were partly offset by decreases of Ksh 5,203 million and Ksh 368 million in other forms of domestic debt and the pre-1997 Government overdraft respectively. The Government overdraft at the Central Bank decreased from Ksh 5,225 million at the end of June 2005 to Ksh 5,202 million at the end of June 2006 which was within the prevailing statutory limit of Ksh 11,323 million based on the fiscal year 2003/04 audited Government revenue.
Table 3.5: Domestic Debt (Ksh Million)
During the fiscal year 2005/06, the domestic borrowing programme was very successful as Treasury bills and bonds auctions realised average over-subscriptions of 36.8 percent and 41.6 percent, respectively. The success of the domestic borrowing programme followed improved liquidity conditions in the market which ensured stability of interest rates throughout the fiscal year, and improved investor confidence in the Government securities market.
3.2.2
Composition of Domestic Debt by Instrument
The stock of Treasury bills (excluding Repos) increased from Ksh 71,938 million at the end of June 2005 to Ksh 94,776 million at the end of June 2006 while Treasury bonds increased significantly from Ksh 193,358 million to Ksh 218,357 million in the same period. Consequently, the proportion of Treasury bills in total domestic debt increased from 22.8 percent to 26.8 percent in the same period (Chart 3.5a and 3.5b). However, the proportion of Treasury bonds in total domestic debt fell slightly from 61.3 percent to 61.0 percent during the same period.
The proportion of domestic debt held in the Government overdraft declined from 1.7 percent at the end of June 2005 to 1.5 percent at the end of June 2006. Similarly, other forms of domestic debt fell from 13.9 percent to 10.7 percent in the same period. The proportion of debt held in long-term stocks remained unchanged at 0.3 percent, as there were neither new issues nor redemptions during the fiscal year 2005/06.
Chage Jun-05 to Jun-06
Amount % Amount %
Total Stock of Domestic Debt (A+B) 315,573 100.0 357,839 100.0 42,266 A. Government Securities 302,271 95.8 349,740 97.7 47,469 1. Treasury Bills (excluding Repo Bills) 71,938 22.8 94,776 26.5 22,838
Banking institutions 32,780 10.4 47,035 13.1 14,255
Others 39,158 12.4 47,741 13.3 8,582
2. Treasury Bonds 193,358 61.3 218,357 61.0 25,000
Banking institutions 89,729 28.4 100,149 28.0 10,420
Others 103,629 32.8 118,208 33.0 14,579
3. Long Term Stocks 1,058 0.3 1,058 0.3 0
Banking institutions - 0.0 - 0.0 0
Others 1,058 0.3 1,058 0.3 0
4. Pre-1997 Government Overdraft 35,917 11.4 35,549 9.9 -368
Repo T/Bills 35,900 11.4 35,532 9.9 -368
B. Others:* 13,301 4.2 8,099 2.3 -5,203
Of which CBK overdraft to Government 5,225 1.7 5,202 1.5 -23
*Others includes Government overdraft at the CBK, clearing items awaiting transfer to PMG, commercial bank advances and TRCs
Source: Central Bank of Kenya
Chart 3.5a: Composition of Domestic Debt by Instrument (June 2005) O v e r d r a f t 1 . 7 % L o n g t e r m S t o c k s 0 . 3 % O t h e r s 1 3 . 9 % T r e a s u r y b o n d s 6 1 . 3 % T r e a s u r y b i l l s ( E x c l u d i n g R e p o s ) 2 2 . 8 %
Chart 3.5b: Composition of Domestic Debt by Instrument (June 2006)
O v e r d r a f t 1 . 5 % L o n g t e r m S t o c k s 0 . 3 % O t h e r s 1 0 . 7 % T r e a s u r y b o n d s 6 1 . 0 % T r e a s u r y b i l l s ( E x c l u d i n g R e p o s ) 2 6 . 5 %
Source: Central Bank of Kenya
In order to develop a liquid and efficient domestic debt market, the Government continued to implement the policy to lengthen the maturity profile of Government debt instruments by issuing more long-term bonds. Although, the ratio of Treasury bills to Treasury bonds changed from 27:73 in June 2005 to 30:70 at the end of June 2006, the average maturity of domestic debt increased from 1.9 years at the end of June 2005 to 2.2 years at the end of June 2006.
The effects of stable interest rates and lengthened maturity of Government instruments translated into increased activities at the NSE. The volume of Treasury bonds traded at NSE increased by 154 percent from Ksh 15,135 million in the fiscal year 2004/05 to Ksh 38,487 million in the fiscal year 2005/06.
3.2.3
Interest Rates on Government Securities
Over the 12 months period under review, Treasury Bills average interest rate declined. However, there was a temporary upward pressure in December 2005
and January 2006. The 91-day Treasury bill average rate fell by 226 basis points from 8.573 percent in July 2005 to 6.312 percent in end June 2006. Over the same period, the 182-day Treasury bill average rate interest fell by 214 basis points from 9.067 percent to 6.920 percent.
Chart 3.6: Weekly Treasury bill Rates (2004-2006)
1 . 0 2 . 0 3 . 0 4 . 0 5 . 0 6 . 0 7 . 0 8 . 0 9 . 0 1 0 . 0 1/5/2004 2/5/2004 3/5/2004 4/5/2004 5/5/2004 6/5/2004 7/5/2004 8/5/2004 9/5/2004 10/5/2004 11/5/2004 12/5/2004 1/5/2005 2/5/2005 3/5/2005 4/5/2005 5/5/2005 6/5/2005 7/5/2005 8/5/2005 9/5/2005 10/5/2005 11/5/2005 12/5/2005 1/5/2006 2/5/2006 3/5/2006 4/5/2006 5/5/2006 6/5/2006 Rate P e rcent 9 1 - D a y s a v e r a g e i n t e r e s t r a t e 1 8 2 - D a y s i n t e r e s t r a t e
Source: Central bank of Kenya
The yields on the longer dated Government securities reflected market expectation. Annex 8 shows yields on the 2 to 10 year Treasury bonds issued during the financial year ended June 2006. The Government securities trading yield curve shows a normal ascending shape reflecting that the yields rise with longer maturities (Chart 3.7)
Chart 3.7: Government of Kenya Securities Trading Yield Curve (30th June 2006)
3.2.4
Domestic Debt by Holder
As indicated in Table 3.7, commercial banks holdings of domestic debt increased to 41.8 percent at the end of June 2006 compared with 38.9 percent at the end of June 2005. Similarly, the proportion of domestic debt held by non-bank entities increased from 44.2 percent to 45.3 percent during the period. The higher proportion of debt held by non-bank entities is a positive development as it reflects continued deepening of the Government securities market with increased diversification of investor base.
However, over the period under review, the proportion of domestic debt held by non-resident investors fell from 2.1 percent to 1.4 percent.
Table 3.7: Domestic Debt by Holder (Ksh Million)
Source: Central Bank of Kenya
3.2.5
Treasury Bills
As shown in Table 3.8, the stock of Treasury bills holdings by commercial banks increased from Ksh 31,863 million at the end of June 2005 to Ksh 47,034 million at the end of June 2006. This represented an increase from 44.3 percent to 49.6 percent in the proportion of commercial banks holdings of Treasury bills during the period. Similarly, holdings by insurance companies and Parastatals increased during the period.
In the fiscal year 2005/06, the share of 91-day Treasury bills in outstanding Treasury bills and bonds decreased from 16.1 percent at the end of June 2005 to 12.0 percent at the end of June 2006 (Table 3.9). On the other hand, the proportion of the 182-day Treasury bills increased to 18.2 percent from 11.0 percent in the same the period. This is consistent with Government strategy to lengthen the maturity structure of the debt.
Jun-02 % Jun-03 % Jun 04 % Jun 05 % Jun-06 %
Change Jun-05 to Jun-06 Banks 120,800 51.2 160,179 55.4 181,512 59.3 169,529 53.7 190,762 53.3 21,234 Central Bank 42,800 18.1 45,289 15.7 50,774 16.6 46,618 14.8 41,289 11.5 -5,329 Commercial Banks 78,000 33.1 114,889 39.7 130,738 42.7 122,911 38.9 149,473 41.8 26,562 Non-banks 104,400 44.2 119,984 41.5 120,688 39.4 139,542 44.2 162,029 45.3 22,488
Non-bank Financial Institutions 2,800 1.2 3,077 1.1 3,190 1.0 2,129 0.7 1,400 0.4 -729 Other Non-bank Sources 101,600 43.1 116,907 40.4 117,498 38.4 137,412 43.5 160,629 44.9 23,217
Non-residents 10,800 4.6 9,214 3.2 4,035 1.3 6,502 2.1 5,047 1.4 -1,455 Total 236,000 100.0 289,377 100.0 306,234 100.0 315,573 100.0 357,839 100.0 42,267
Table 3.8: Outstanding Treasury Bills by Holder (Ksh million) H o ld e r s A m o u n t % A m o u n t % A m o u n t % B a n k in g I n s t it u t io n s 4 2 , 1 5 4 6 7 . 0 3 2 , 7 8 0 4 5 . 6 4 7 , 5 6 0 5 0 . 2 C e n t r a l B a n k 2 0 . 0 7 0 . 0 1 0 . 0 C o m m . B a n k s 4 1 , 0 2 1 6 5 . 2 3 1 , 8 6 3 4 4 . 3 4 7 , 0 3 4 4 9 . 6 N B F I s 1 , 1 3 1 1 . 8 9 1 0 1 . 3 5 2 5 0 . 6 I n s u r a n c e C o m p a n ie s 4 , 8 9 2 7 . 8 7 , 6 6 5 1 0 . 7 1 1 , 0 3 7 1 1 . 6 P a r a s t a t a ls 4 , 9 2 4 7 . 8 6 , 9 0 7 9 . 6 1 1 , 2 4 0 1 1 . 9 O f w h ic h : N S S F 8 7 4 1 . 4 9 0 0 . 1 6 0 0 0 . 6 B u ild in g S o c ie t ie s - - 1 8 0 0 . 3 5 4 0 0 . 6 P e n s io n F u n d s 3 1 9 0 . 5 5 3 8 0 . 7 6 0 9 0 . 6 O t h e r s 1 0 , 6 4 7 1 6 . 9 2 3 , 8 6 8 3 3 . 2 2 3 , 7 9 0 2 5 . 1 T o t a l * 6 2 , 9 3 6 1 0 0 . 0 7 1 , 9 3 8 1 0 0 . 0 9 4 , 7 7 7 1 0 0 . 0 * E x c l u d e s r e p u r c h a s e o r d e r b i l l s S o u r c e : C e n t r a l B a n k o f K e n y a J u n e 2 0 0 5 J u n e 2 0 0 4 J u n e 2 0 0 6
Table 3.9: Outstanding Treasury bills and Bonds by Tenor (Ksh Million)
3.2.6
Treasury Bonds
Treasury bonds holdings by commercial banks increased from Ksh 88,509 million at the end of June 2005 to Ksh 100,149 million at the end of June 2006. As shown in Table 3.10, this was equivalent to an increase in the proportion of Treasury bonds held by commercial banks from 45.8 percent to 45.9 percent during the period. Similarly, holdings by non-bank financial institutions, corporate entities and individuals increased from Ksh 104,849 million to Ksh 118,208 million in the same period.
The largest share of outstanding Treasury bonds as at end June 2006 was in 2-year Treasury bonds, which accounted for 12.7 percent of the stock of Treasury bills and bonds compared with 9.3 percent at the end of June 2005. The proportion of one-year Treasury bonds in outstanding Treasury bills and bonds
Tenor Jun-2004 % Jun-2005 % Jun-2006 %
91-DAY 29,497 11.7 42,761 16.1 37,632 12.0 182-DAY 33,439 13.3 29,177 11.0 57,144 18.2 1-YEAR 9,343 3.7 30,953 11.7 1,000 0.3 2-YEAR 28,237 11.2 24,686 9.3 39,738 12.7 3-YEAR 44,817 17.8 27,898 10.5 31,255 10.0 4-YEAR 26,520 10.5 26,160 9.9 26,287 8.4 5-YEAR 23,086 9.2 22,740 8.6 28,391 9.1 6-YEAR 17,909 7.1 20,434 7.7 33,105 10.6 7-YEAR 8,558 3.4 10,330 3.9 13,566 4.3 8-YEAR 11,969 4.8 11,969 4.5 15,287 4.9 9-YEAR 9,555 3.8 9,555 3.6 12,615 4.0 10-YEAR 8,634 3.4 8,634 3.3 17,113 5.5 Total 251,562 100.0 265,296 100.0 313,134 100.0