FUZZY REASONING BASED EVOLUTIONARY ALGORITHMS APPLIED TO DATA MINING
A Dissertation
Submitted to the Graduate Faculty of the
North Dakota State University of Agriculture and Applied Science
By Min Chen
In Partial Fulfillment of the Requirements for the Degree of
DOCTOR OF PHILOSOPHY
Major Department: Computer Science
May 2015
North Dakota State University
Graduate School
Title
Fuzzy Reasoning based Evolutionary Algorithms Applied to Data Mining
By
Min Chen
The Supervisory Committee certifies that this disquisitioncomplies with North Dakota State
University’s regulations and meets the accepted standards for the degree of
DOCTOR OF PHILOSOPHY SUPERVISORY COMMITTEE: Dr. Simone A. Ludwig Chair Dr. Saeed Salem Dr. Changhui Yan Dr. Maria Alfonseca-Cubero Approved: 05/04/2015 Dr. Brian M. Slator
ABSTRACT
Data mining and information retrieval are two difficult tasks for various reasons. First, as the volume of data increases tremendously, most of the data are complex, large, imprecise, uncertain or incomplete. Furthermore, information retrieval may be imprecise or subjective. Therefore, comprehensible and understandable results are required by the users during the process of data mining or knowledge discovery. Fuzzy logic has become an active research area because its capability of handling perceptual uncertainties, such as ambiguity or vagueness, and its excellent ability on describing nonlinear system.
The study of this dissertation is focused on two main paradigms. The first paradigm focuses on applying fuzzy inductive learning on classification problems. A fuzzy classifier based on discrete particle swarm optimization and a fuzzy decision tree classifier are implemented in this paradigm. The fuzzy classifier based on discrete particle swarm optimization includes a discrete particle swarm optimization classifier and a fuzzy discrete particle swarm optimization classifier. The discrete particle swarm optimization classifier is devised and applied to discrete data. Whereas, the fuzzy discrete particle swarm optimization classifier is an improved version that can handle both discrete and continuous data to manage uncertainty and imprecision. A fuzzy decision tree classifier with a feature selection method is proposed, which is based on the ideas of mutual information and genetic algorithms.
The second paradigm is fuzzy cluster analysis. The purpose is to provide efficient approaches to identify similar or dissimilar descriptions of data instances. The shapes of the clusters is either hyper-spherical or hyper-planed. A fuzzy c-means clustering approach based on particle swarm optimization, which clustering prototype is hyper-spherical, is proposed to automatically determine the optimal number of clusters. In addition, a fuzzy c-regression model, which has hyper-planed clusters, has received much attention in recent literature for nonlinear system identication and has been successfully employed in various areas. Thus, a fuzzy c-regression model clustering algorithm is applied for color image segmentation.
ACKNOWLEDGMENTS
I am very grateful to take this opportunity to thank Dr. Simone A. Ludwig, Dr. Saeed Salem, Dr. Changhui Yan and Dr. Maria A. Alfonseca-Cubero for serving on my graduate committee. First, I would like to express my greatest appreciation to my major advisor, Dr. Simone A. Ludwig. Not only did she guide me through the dissertation process, but also taught me the overall process of doing research. Everyone should be a fortunate as I was to have an advisor such as her. I cannot thank her enough for the supervision, encouragement and inspiration in developing the theory, conducting the experiment, publishing papers, and writing this dissertation. She has shown me the joys of teaching, rewards of research and importance of life, and for this I thank her.
I would like to also thank Dr. Saeed Salem for serving on my graduate committee. I have always enjoyed discussing many aspects of this research with him and look forward to future discussions. He have dedicated many hours on supporting my graduate study and providing helps on my professional developments.
I would like to thank Dr. Changhui Yan and Dr. Maria A. Alfonseca-Cubero for serving on my graduate committee. With all of the other commitments to the university, both dedicated time to take part in my dissertation research and provided valuable insight into the completion of my dissertation.
Finally, I would like to thank my family, friends for their support, understanding, and encour-agement that I have the opportunity to pursue my Ph.D.. I certainly wasn’t the easiest person to be around during the last year while I worked on this research and completed my dissertation. I want to thank Di Wang for his unwavering support allowed me the time to complete this dissertation. I am appreciative of my mother, Xiongjuan Wen, for her love, sacrifice, and support. Without her support, this work may never have been completed.
DEDICATION
TABLE OF CONTENTS
ABSTRACT . . . iii
ACKNOWLEDGMENTS . . . iv
DEDICATION . . . v
LIST OF TABLES . . . x
LIST OF FIGURES . . . xii
1. INTRODUCTION . . . 1
1.1. Data Mining . . . 1
1.2. Swarm Intelligence . . . 2
1.3. Fuzzy Rule Classification . . . 3
1.3.1. Fuzzy Decision Tree . . . 4
1.4. Fuzzy Clustering . . . 5
1.5. Motivation and Problem Statement . . . 6
1.6. Contributions . . . 8
1.7. Dissertation Overview . . . 10
2. A FUZZY DISCRETE PARTICLE SWARM OPTIMIZATION CLASSIFIER FOR RULE CLASSIFICATION . . . 12
2.1. Related Work . . . 12
2.2. Proposed Approaches . . . 14
2.2.1. Discrete Particle Swarm Optimization with Local Strategy . . . 15
2.2.2. Definition of Overall Fitness . . . 17
2.2.4. DPSO-LS Classifier . . . 18
2.2.5. FDPSO-LS Classifier . . . 20
2.3. Experiments and Results . . . 23
2.3.1. Experimental Setup . . . 24
2.3.2. Results of the DPSO-LS Approach . . . 24
2.4. Comparison and Results of DPSO-LS and FDPSO-LS for Discrete Data Sets 28 2.5. Results of FDPSO-LS Approach for Continuous Data Set . . . 30
2.6. Summary . . . 33
3. FUZZY DECISION TREE USING SOFT DISCRETIZATION AND A GENETIC ALGORITHM BASED FEATURE SELECTION METHOD . . . 35
3.1. Related Work . . . 35
3.2. Fuzzy Decision Tree Classifier . . . 36
3.2.1. Preprocessing Phase . . . 38
3.3. Experiments and Results . . . 41
3.3.1. Experimental Setup . . . 41
3.3.2. Experimental Results . . . 42
3.4. Summary . . . 46
4. PARTICLE SWARM OPTIMIZATION BASED FUZZY CLUSTERING APPROACH TO IDENTIFY OPTIMAL NUMBER OF CLUSTERS . . . 48
4.1. Related Work . . . 48
4.2. Fuzzy C-Means and Particle Swarm Optimization . . . 50
4.2.2. Particle Swarm Optimization . . . 51
4.3. Proposed Approach . . . 52
4.3.1. Particle Encoding . . . 52
4.3.2. Velocity Encoding . . . 52
4.3.3. Decoding . . . 53
4.3.4. Clustering Validation Techniques . . . 53
4.4. Experiments and Results . . . 57
4.4.1. Experimental Setup . . . 57
4.4.2. Datasets . . . 57
4.5. Experimental Study . . . 58
4.5.1. Use of Synthetic Data . . . 58
4.5.2. Use of Real-World Data . . . 61
4.5.3. Visualization of Clustering Results . . . 62
4.6. Summary . . . 65
5. COLOR IMAGE SEGMENTATION USING FUZZY C-REGRESSION MODEL . . 67
5.1. Related Work . . . 67
5.2. Proposed Approach . . . 71
5.2.1. CIE-L*A*B* Color Space . . . 71
5.2.2. Fuzzy C-Regression Model Clustering . . . 71
5.3. Clustering Validation Techniques . . . 74
5.4. Experiments and Results . . . 75
5.6. Experimental Study . . . 75
5.6.1. Comparison of cluster performance in *A*B space . . . 75
5.6.2. Comparison using different validity indices . . . 76
5.6.3. Comparison with MSE and PSNR . . . 78
5.6.4. Comparison on segmentation results . . . 88
5.7. Summary . . . 88
6. CONCLUSION AND FUTURE WORK . . . 90
6.1. Conclusions . . . 90
6.2. Future Work . . . 92
LIST OF TABLES
Table Page
1. Parameters and their values of the DPSO and DPSO-LS algorithms. . . 25
2. Data sets used for the experiments. . . 25
3. Average accuracy of DPSO and DPSO-LS for 100 iterations. . . 26
4. Average rule size of all algorithms. . . 27
5. Average weighted TPRs (%) of all algorithms. . . 27
6. Average weighted FPRs (%) of all algorithms. . . 28
7. Average weighted precision (%) of all algorithms. . . 28
8. Average accuracy of DPSO-LS and FDPSO-LS for 100 iterations. . . 28
9. Average rule size of DPSO-LS and FDPSO-LS for 10 runs. . . 29
10. Average weighted TPRs of DPSO-LS and FDPSO-LS for 10 runs. . . 30
11. Average weighted FPRs of DPSO-LS and FDPSO-LS for 10 runs. . . 30
12. Average weighted precision of DPSO-LS and FDPSO-LS for 10 runs. . . 31
13. Datasets used for the proposed fuzzy rule-based system using DPSO-LS. . . 31
14. Average accuracy of FURIA and FDPSO-LS for 100 iterations. . . 32
15. Average rule size of FDPSO-LS and FURIA. . . 33
16. Average weighted TPRs of FDPSO-LS and FURIA. . . 33
17. Average weighted FPRs of FDPSO-LS and FURIA. . . 34
18. Average weighted precision of FDPSO-LS and FURIA. . . 34
20. Datasets used for experiments. . . 43
21. Average weighted TPR (%) of all algorithms. . . 44
22. Average weighted FPR (%) of all algorithms. . . 44
23. Average weighted precision (%) of all algorithms. . . 44
24. Parameters and their values of the proposed algorithm. . . 57
25. Datasets used for the experiments. . . 58
26. Index values with varyingcusing pinwheel data set. . . 60
27. Reconstruction error with varyingcusing transfusion data set. . . 64
28. Nine different indices using the proposed algorithm. . . 65
29. Mapping using the proposed algorithm. . . 66
30. Parameters and their values of the FCM, GK, and FCRM algorithms . . . 76
31. FCM, GK, and FCRM using three different indices (PC, PE and MPC) . . . 76
32. FCM, GK, and FCRM using three different indices (PC, PE and MPC) . . . 77
33. Best cluster number of FCM, GK and FCRM using PC, PE and MPC . . . 78
34. MSE (×104) using FCM with different cluster number . . . 79
35. MSE (×104) using GK with different cluster number . . . 80
36. MSE (×104) using FCRM with different cluster number . . . 81
37. PSNR using FCM with different cluster number . . . 82
38. PSNR using GK with different cluster number . . . 83
LIST OF FIGURES
Figure Page
1. Processes of DPSO-LS based classifiers. . . 19
2. An example of fuzzy partition. . . 21
3. Fuzzy inference process. . . 23
4. Accuracy of all algorithms. . . 26
5. Accuracy comparison of DPSO-LS and FDPSO-LS. . . 29
6. Accuracy comparison of the proposed FDPSO-LS and FURIA. . . 32
7. A fuzzy discretization process. . . 38
8. AUC of J48 and J48-P. . . 45
9. AUC of REPTree and REPTree-P. . . 46
10. AUC of FURIA and FURIA-P. . . 46
11. AUC of FDT and FDT-P. . . 47
12. Synthetic data set . . . 59
13. Kmeans using 3 different validity indices . . . 59
14. K-medoid using 3 different validity indices . . . 60
15. FCM using 9 different validity indices . . . 61
16. GK using 9 different validity indices . . . 62
17. FPSO using 9 different validity indices . . . 63
18. Data sets using PCA projection, CSM and FSM, respectively. . . 64
1. INTRODUCTION
In this current information age, a tremendous expansion in the volume of data is seen that is being generated and stored. It is possible to collect, store, transfer and combine huge amounts of data at very low costs. However, only a small amount of the data has been used. It turns out to be very difficult to exploit information in the data in an intelligent way. The primary reasons includes the volumes of data are too large to manage, the data structures are too complicated to be analyzed and there is a lack of tools that can efficiently and effectively analyze and reveal valuable knowledge that is hidden.
The need to understand large, complex, information-rich data sets is common to all fields of studies. The objective of the field of knowledge discovery and data mining is the discovery of knowledge that is not only correct, but also comprehensible. This chapter briefly describes the background to the research topics investigated in this dissertation, brief descriptions of the background are introduced in Section 1.1-1.4. The motivation of the work is discussed in Section 1.5. The contributions of the work is listed in Section 1.6 and the structure of the dissertation is described in Section 1.7.
1.1. Data Mining
Data mining is called exploratory data analysis, among other things. It is an analytic pro-cess designed to explore data. Data mining aims to search for consistent patterns or systematic relationships between variables. It then validates the findings by applying the detected patterns to new subsets of data [1]. It is a statistical analysis process which can identify the clusters along with collection of data. Data mining can be achieved by classification, association, prediction, sequential pattern, similar time sequences and clustering [2].
The data mining tasks can be classified as unsupervised or supervised learning. Unsupervised learning focuses on finding patterns describing the data that can be interpreted. On the other hand, supervised learning involves using some features or fields of the data set to predict unknown or future values of interest.
The two primary goals of data mining can be classified as prediction and description [3].
Prediction involves using some features or fields of the data set to predict unknown or future
values of interest, whereas description focuses on finding patterns describing the data that can be interpreted by humans. Several data mining techniques using prediction and description have emerged that include classification, clustering, regression, dependence modeling, etc.
The classification technique is used to discover a predictive learning function that classifies a data item into several predefined classes. It is also known as supervised classification, whereby given class labels are ordered to objects in the data collection. In general, classification approaches use a training set in which all objects are already associated with their corresponding class labels. The classification algorithm then learns from the training set data and builds a model. This model is then used to classify unseen data and to assign a class label to each data item.
1.2. Swarm Intelligence
Swarm Intelligence (SI) is a field of computer science, which is inspired by the behavior of real swarms, flocks, insect colonies to design and study efficient computational methods for solving problems [4]. Two main areas of swarm intelligence are Ant Colony Optimization (ACO) and Particle Swarm Optimization (PSO). Ant colony optimization [5] is inspired by the real ants finding shortest paths from their nest to the food sources. Ants mark their paths to the food sources via a pheromone trail along their way. Other ants can be led to the food source by the pheromone traces.
The coordinated search of food for bird flocking can be modeled with simple rules for information sharing between individuals of the swarm. Based on the analogy of the behavior of flocks of birds, Kennedy and Eberhart [6] developed a method for function optimization referred to as particle swarm optimization. A particle swarm optimization algorithm includes a population of particles denoted as the swarm. Each individual is called a particle that represents a location in the problem space. Each particle starts at a random location with a velocity and searches for the optimum of a given objective function by moving through the search space. The movements
of each particle depends on its velocity and the positions where good solutions have already been found by the particle, named as personal best, or by other particles in the swarm, called global best. Particle swarm optimization is a population-based optimization tool which is mainly applied to solve various function optimization problems. Compare to Genetic Algorithm (GA) and Simu-lated Annealing (SA), the main strength of PSO is the fast convergence. Typically, each particle keeps track of the coordinates in the search space, which are associated with the personal best and the global best it has found so far. In each iteration, the velocity of the PSO algorithm is changed towards the personal and global best with some random component. Though the main use of PSO is for continuous function optimization, an increasing number of works have investigated the use of discrete PSO to be applied to more complex discrete problems.
1.3. Fuzzy Rule Classification
Rule discovery is an important classification method that has been attracting a significant amount of researchers in recent years. It uses a set of IF-THEN rules to classify a class or category in a natural way. A rule consists of antecedents and a consequent. The antecedents of the rule consist of a set of attribute values and the consequent of the rule is the class which is predicted by that rule.
One possible application of fuzzy logic in data mining is the induction of fuzzy rules to interpret the underlying data linguistically. Fuzzy logic can improve the classification system by using fuzzy sets to define overlapping class definitions [7]. The interpretability of the results can be improved and more insight into the classifier structure and decision making process is provided by the application of fuzzy IF-THEN rules [8]. Fuzzy rules are linguistic IF-THEN constructs that have the general form “IF A THEN C”, where A and C are collections of propositions and postpositions containing linguistic variables. A is called the antecedent, and C is the consequent of the rule. In effect, the tolerance for imprecision and uncertainty is exploited through granulation in soft data compression by using linguistic variables and fuzzy IF-THEN rules [8]. In this respect, fuzzy logic has the feature of mimicking the essential ability of the human mind to summarize data
and focus on decision-relevant information. In a more explicit form, theithrule has the following
form:
IFxi1 ∈Am1 AND .. ANDxij ∈Anj THENci ∈Cik (1.1)
wherexij denotes thejth attribute of theithrule. Amj denotes themth antecedent value of thejth
attribute.ciis the consequent of theithrule.
1.3.1. Fuzzy Decision Tree
Decision Tree (DT) mining is one of the frequently used classification methods that specify the sequences of decisions that need to be made accompanied by the resulting recommendation. DT mining typically uses a top-down strategy, and the measure of information gain is used as a “goodness” criterion. DTs are intrinsic multi-class learners that scale comparatively well, some-times even outperforming other state-of-the-art methods especially when they are used as part of an ensemble method [9, 10]. DTs are comprehensible and interpretable and can handle different types of attributes (e.g., numerical and categorical) [11]. Popular methods of decision trees are ID3 [12], C4.5 [13] and CART [14], which generate a tree structure through recursively partitioning the attribute space until the whole decision space is completely partitioned into a set of non-overlapping subspaces [15], which is also called hard discretization. Soft discretization on the other hand is when the decision space is partitioned into a set of overlapping subspaces. The classical crisp discretization can cause low classification accuracy since it can not analyze noisy data using crisp cut points. Furthermore, crisp discretization can lead to misclassification of new objects, which are close to the separating boundary between decision classes [16].
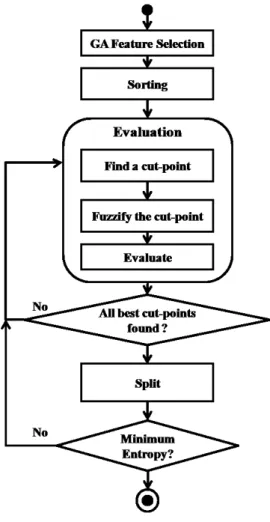
Researchers have attempted to combine some elements of symbolic and sub-symbolic ap-proaches to decision tree induction. The fuzzy approach is one of such extensions. Due to its ability of handling vagueness, ambiguity and reduction of complexity, fuzzy logic [7],[8] has been widely applied in dealing with problems of uncertainty, noise, and inexact data. A DT induction method using fuzzy set theory, in other words, Fuzzy Decision Tree (FDT), is becoming
an increasingly popular method to solve classification problems. FDT, like classical DT, uses the top-down strategy. In order to find the best so called “cut-point”, FDT is based on soft discetization and follows the DT run recursively on each partition until the best cut point is found.
1.4. Fuzzy Clustering
Clustering analysis is one of the popular approaches and has been widely used in data mining. Clustering analysis is a process to identify groups or clusters based on some similarity measures. Most clustering algorithms can be categorized into two popular techniques known as hierarchical and partitional clustering. The output of the hierarchical clustering is a tree showing a sequence of clusters with each cluster being a partition of the data set. Hierarchical clustering does not specify the number of clusters, and the output is independent of the initial condition. However, the hierarchical clustering is static, i.e., the data points assigned to a cluster cannot be reassigned to another cluster. In addition, hierarchical clustering will fail to separate overlapping clusters due to the lack of information regarding the global shape or size of the clusters. On the other hand, partitioned clustering requires a fixed number of clusters to be specified a priori. Objective functions such as square error function are used as a criteria in the optimization process of the data partitioning. Partitioned clustering uses an iterative process to optimize the cluster centers, as well as the number of clusters. However, it is a challenge to find the “optimum” number of clusters since it always requires prior knowledge about the data. The advantages of hierarchical algorithms are the disadvantages of the partitional algorithms and vice versa.
The goal of clustering involves the task of dividing data points into homogeneous groups such that the data points in the same group are as similar as possible and data points in different groups are as dissimilar as possible [17, 2]. The importance of clustering is documented in pattern recognition [18], machine learning, image analysis [19], information retrieval, etc. Depending on whether a data point belongs to a single cluster or several clusters with different membership degrees, clustering methods can be categorized as either hard clustering [20, 21] or fuzzy clustering [22]. Each data point of the data set belongs to exactly one cluster in hard clustering. Fuzzy set
theory which was proposed by Zadeh [7] in 1965 is used to describe the membership degrees in fuzzy cluster analysis. Therefore, each data point of the data set belongs to two or more clusters with a membership degree between 0 and 1. Due to the capacity of handling uncertainty and vagueness, the potential of fuzzy clustering to reveal the underlying structures in data with regard to similarities or dissimilarities among them can be exploited [23].
One of the widely used methods in fuzzy clustering is Fuzzy C-Means clustering (FCM) [24]. The FCM method attempts to partition a data set into a collection of c fuzzy groups. It finds a cluster center in each group such that the intra-distance within the group is minimized and the inter-distance between each group is maximized. All of the fuzzy clustering methods that have been applied recently mostly use an extension of the FCM algorithm. As we have discussed before, partitional clustering suffers from the following two drawbacks:
• The number of clusters needs to be specified in advance. Furthermore, it requires prior knowledge or ground truth of the data.
• In most cases, data points in overlapping areas can not be categorized correctly.
1.5. Motivation and Problem Statement
Fuzzy logic and fuzzy set theory which were proposed by Zadeh [7, 8], have been widely used in pattern recognition and fuzzy reasoning. Fuzzy logic, which works with reasoning rules, is very close to the human way of thinking. Unlike classical logic, fuzzy logic allows us to define values without specifying a precise value, which is not possible in classical logic.
In addition, fuzzy set theory makes it possible that an object can belong to one or more sets with a certain degree. The interpretations of membership degrees are in terms of similarity, preference, and uncertainty. In other words, the use of membership degrees can state how similar an object is to a prototypical one, indicate preferences between suboptimal solutions to a problem, and model uncertainty about the true situation. Generally, fuzzy reasoning is close to human reasoning. The solution obtained using fuzzy approaches are easy to understand and to apply.
Specially, fuzzy systems are the method of choice when linguistic, vague, or imprecise information has to be modeled.
As data is accumulated at an unimaginable rate from a very wide variety of sources, the difficulty of efficient analysis of the large amount of data is growing. Data mining, which is a part of the Knowledge Discovery in Databases, is one of the main solutions for this problem. Soft computing [25] techniques such as fuzzy theory, soft set, evolutionary algorithms and neural networks have been successfully applied to data mining. Soft computing uses hybridization of several computing paradigms such as fuzzy logic, neural networks and genetic algorithm. Soft computing is more suitable for real world problems due to its tolerance of imprecision and the ability of solving real world problems in reasonably less time. Fuzzy logic, which is one of the principal constituents of soft computing, provides a useful mechanism for data mining or knowledge discovery.
The main motivation of this research can be summarized as follows.
1. Fuzzy rule-based classification is one of the most popular approaches used for classification problems. The key motivation for capturing data behavior in the form of fuzzy rules is that fuzzy rules are easy to understand, verify, and extend. The fuzzy rule-based system is comprehensible because each fuzzy rule is linguistically interpretable. However, it is a challenge to automatically generate fuzzy rules from the data. In order to keep the resulting rule base small and comprehensible, both classification performance and interpretability are important. For this purpose, a PSO algorithm is used to develop a fuzzy classifier in an iterative approach.
2. Fuzzy Decision Trees enable the user to take into account imprecise description or het-erogeneous values in data mining. The key feature of FDT is the interpretability. The rules obtained by FDT make it easier for the user to interact with the system. FDT have been extensively used in recent years. However, feature selection in FDT is very
compu-tationally expensive since joint entropy has to be calculated requiring the estimation of the joint probability distributions. In order to reduce the computational complexity, a variable selection based on genetic algorithm is proposed to address the combinatorial checking of the variables.
3. Contrary to fuzzy-ruled based classification and fuzzy decision tree methods, fuzzy cluster-ing is an unsupervised learncluster-ing technique. Unlike traditional clustercluster-ing, a point is assigned to a single cluster. The use of fuzzy set theory allows a point to be assigned to two or more clusters. The Fuzzy C-means algorithm is one of the popular methods applied in fuzzy clustering. However, the number of clusters in fuzzy c-means needs to be specified in advance. A clustering approach based on Particle Swarm Optimization that automatically determines the optimal number of clusters is proposed.
4. Due to the variety and complexity of images, image segmentation is still a very challenging research topic. Various techniques have been introduced for object segmentation and feature extraction. Although fuzzy c-means can partition the fuzzy space efficiently, it does not take linearity of the divided data into consideration. In contrast, the fuzzy c-regression model clustering algorithm with hyperplane-shaped cluster prototypes returns results that have much more explanatory power, especially due to its multivariate nature. An unsuper-vised approach using the fuzzy c-regression model is applied and proposed for color image segmentation.
1.6. Contributions
This dissertation makes several contributions towards fuzzy logic and hybrid algorithms combined with Particle Swarm Optimization, and Fuzzy Decision Tree in solving data classifi-cation or clustering analysis problems. The contributions are:
1. A Particle Swarm Optimization based discrete classification implementation with a local search strategy (DPSO-LS) was devised and applied to discrete data. In addition, a fuzzy
DPSO-LS (FDPSO-LS) classifier is proposed for both discrete and continuous data in order to manage imprecision and uncertainty. Experimental results reveal that DPSO-LS and FDPSO-LS outperform other classification methods in most cases based on rule size, True Positive Rate (TPR), False Positive Rate (FPR), and precision, showing slightly improved results for FDPSO-LS.
2. A Fuzzy Decision Tree (FDT) classifier that is based on soft discretization was proposed and applied on feature selection. However, the data contains many redundant or irrelevant features. These features provide no useful information in any context. In order to improve the model interpretability and enhance the generalization, a Genetic Algorithm (GA) based feature selector is applied. The performance evaluation conducted has shown that our FDT classifier obtains in some cases higher values than other decision tree and fuzzy decision tree approaches based on measures such as true positive rate, false positive rate, precision and area under the curve.
3. A clustering approach based on Particle Swarm Optimization is proposed. This approach au-tomatically determines the optimal number of clusters using a threshold vector that is added to the particle. The algorithm starts by partitioning the data set randomly within a preset maximum number of clusters in order to overcome the fuzzy c-means shortcoming of the predefined cluster count. A reconstruction criterion is applied to evaluate the performance of the clustering results of the proposed algorithm. The experiments conducted show that the proposed algorithm can automatically find the optimal number of clusters.
4. A Fuzzy C-Regression Model (FCRM) has been proposed whose prototype is hyper-planed and can either be linear or nonlinear allowing for better cluster partitioning. Thus, this chapter implements FCRM and applies the algorithm to color segmentation using Berkeley’s segmentation database. The results show that FCRM obtains more accurate results compared to other fuzzy clustering algorithms.
1.7. Dissertation Overview
This dissertation is a paper-based version, where each chapter has been derived from papers published during the Ph.D. work. This is an overview of the remaining chapters of this dissertation: In Chapter 2, a fuzzy discrete particle swarm optimization classifier for rule classification is discussed. This chapter is derived from the publications:
• Min Chen and Simone A. Ludwig, “A Fuzzy Discrete Particle Swarm Optimization Clas-sifier for Rule Classification.” International Journal of Hybrid Intelligent Systems: Special Issue on NaBIC 2012.
• Min Chen and Simone A. Ludwig, “Discrete Particle Swarm Optimization With Local Search Strategy for Rule Classification.” Proceedings of the Fourth World Congress on Nature and
Biologically Inspired Computing (IEEE NaBIC’12), November 2012, Mexico City, Mexico.
In Chapter 3, a fuzzy decision tree using soft discretization is proposed and a Gentic Algo-rithm based feature selection method is discussed. This chapter is derived from the publication:
• Min Chen and Simone A. Ludwig, “Fuzzy Decision Tree using Soft Discretization and a Genetic Algorithm based Feature Selection Method.” Proceedings of the Fifth World
Congress on Nature and Biologically Inspired Computing (IEEE NaBIC’13), August 2013,
Fargo, ND, USA.
In Chapter 4, a novel fuzzy clustering using automatic particle swarm optimization is pro-posed and discussed. This chapter is derived from the publication:
• Min Chen and Simone Ludwig, “Particle Swarm Optimization based Fuzzy Clustering Ap-proach to Identify Optimal Number of Clusters.” Journal of Artificial Intelligence and Soft
Computing Research , 2014.
In Chapter 5, fuzzy c-regression model clustering whose prototype is hyper-planed is applied in color image segmentation using Berkeley’s segmentation database.
• Min Chen and Simone A. Ludwig, “Color Image Segmentation Using Fuzzy C-Regression Model.” Submitted to International Journal of Fuzzy Systems.
2. A FUZZY DISCRETE PARTICLE SWARM OPTIMIZATION
CLASSIFIER FOR RULE CLASSIFICATION
The need to deduce interesting and valuable information from large, complex, information-rich data sets is common to many research fields. Rule discovery or rule mining uses a set of IF-THEN rules to classify a class or category in a comprehensible way. Besides the classical ap-proaches, many rule mining approaches use biologically-inspired algorithms such as evolutionary algorithms and swarm intelligence approaches. In this chapter, a Particle Swarm Optimization based discrete classification implementation with a local search strategy (DPSO-LS) was devised and applied to discrete data sets. In addition, a fuzzy DPSO-LS (FDPSO-LS) classifier is proposed for both discrete and continuous data sets in order to manage imprecision and uncertainty. A Pittsburgh approach based particle swarm optimization is adopted and applied in classification rule mining.
The remainder of the chapter is arranged as follows. Section 2.1 describes related work. The proposed two approaches DPSO-LS and FDPSO-LS are introduced and described in Section 2.2. The experimental setup and results of the two approaches are demonstrated in Section 2.3. Finally, conclusions and future work are discussed in Section 2.6.
2.1. Related Work
Related work in classification rule mining using biology-inspired algorithms mainly include evolutionary algorithms and swarm intelligence approaches. Genetic algorithm based concept learning uses either the Pittsburgh approach or the Michigan approach [26]. For the Pittsburgh approach, every individual in the GA is a set of rules that represents a complete solution to the learning problem. For the Michigan approach, each individual represents a single rule that provides only a partial solution to the overall learning task.
Genetic algorithm based concept learning has been widely used for rule mining. In [26], a genetic algorithm based algorithm is proposed to discover comprehensive IF-THEN rules. It uses a flexible chromosome encoding where each chromosome corresponds to a classification rule. In
addition, a hybrid decision tree/genetic algorithm is used to discover small disjunct rules in [27]. A decision-tree algorithm is used to classify examples belonging to large disjuncts, while a new genetic algorithm is designed for classifying examples belonging to small disjuncts.
Evolutionary approaches for automated discovery of censored production rules, augmented production rules and comprehensible decision rules are introduced in [28, 29, 30], respectively. The proposed GA-based approaches, similarly, use a flexible chromosome encoding, where each chromosome corresponds to an augmented production rule, a comprehensible decision rule or a censored production rule. An Evolutionary Multiobjective Optimization (EMO) algorithm is used to search for a large number of non-dominated fuzzy rule-based classifiers in [31].
With regards to swarm intelligence approaches, a classification algorithm called Ant-Miner, first introduced in [32], has been successfully applied to rule classification problems. PSO is another approach inspired by nature. However, most of the swarm intelligence algorithms for rule classification are based on the Michigan approach ([33, 34]).
Related work in fuzzy classification rule mining using the biology-inspired algorithms mainly include evolutionary algorithms and swarm intelligence approaches. GA is a popular evolutionary algorithm, which has been employed for the learning of fuzzy rules. GAs have been applied to learn both antecedent and consequent of fixed or varying number of fuzzy rules [35, 36, 37]. Also, GAs have been combined with other techniques like neural networks [38], Kalman filters [39], hill climbing [40], and fuzzy clustering [38]. EMO algorithms, which generate a family of equally valid solutions, have been introduced in [41].
Ant Colony Optimization (ACO), one of the swarm intelligence techniques, has been suc-cessfully used to extract rule based classification systems. In [42], ACO is used to extract fuzzy IF-THEN rules for the diagnosis of diabetes. A combination of ACO and fuzzy set theory, named FACO-Miner, is applied to learn a set of fuzzy rules from labeled data in a parallel manner in [43]. An improved ACO technique using fuzzy inference rules is applied to image classification and analysis in [44].
With respect to PSO, a Pittsburgh-based PSO fuzzy system for knowledge acquisition is introduced in [45]. A modified PSO, called Mutation PSO (MPSO), is built and used to obtain an optimal fuzzy rule-base. The algorithm generated a compact fuzzy rule base that works efficiently for medical diagnosis problems [46]. In [47], a case study of intrusion detection using a PSO approach for evolutionary fuzzy rule learning is proposed. It is capable of detecting known intrusive behavior in a computer network with an acceptable performance.
PSO has been proven to be able to achieve a faster convergence than the GA algorithm [45]. It has been experimentally shown that the PSO algorithm scales well and is not highly sensitive to the population size [45]. As far as the authors’ knowledge is concerned, due to the lack of flexibility of the Pittsburgh approach [48], the Pittsburgh-based PSO algorithm on rule classification is rarely used in literature. On the other hand, in order to avoid premature convergence of particles, the Michigan approach usually requires some changes in the definition of the PSO algorithm to repel a particle from its neighbor [48]. In addition, the Michigan approach aims to optimize each rule’s quality individually, and does not take the interaction between other rules into account [33]. In [45], the knowledge acquisition with a Pittsburgh-based swarm-intelligence approach is introduced. A learning strategy of a fuzzy-rule-based meta-scheduler is analyzed and compared with other scheduling strategies. In our study, similarly, we propose a Pittsburgh-based swarm-intelligence method, however, we improve the classification by applying a local strategy to address PSO’s convergences problem. Furthermore, in order for the method to handle imprecision and vagueness in data sets fuzzy logic is employed.
2.2. Proposed Approaches
Two classifiers are proposed and investigated: a DPSO-LS classifier and a fuzzy DPSO-LS classifier (abbreviated as FDPSO-LS). The DPSO-LS classifier is designed to classify discrete data sets. As we have mentioned above, the use of linguistic variables and fuzzy IF-THEN rules exploits the tolerance for imprecision and uncertainty. In this respect, we extend the DPSO-LS classifier to a fuzzy DPSO-LS (FDPSO-LS) classifier, which can classify both discrete and continuous data
sets. In this section, we first describe the DPSO-LS algorithm followed by a detailed description of the FDPSO-LS classifier.
2.2.1. Discrete Particle Swarm Optimization with Local Strategy
PSO was introduced by Eberhart and Kennedy [6] and is based on the analogy of the behavior of flocks of birds or schools of fish. Although the PSO algorithm was proposed for continu-ous space problems, however, many real-world data sets use categorical data, and therefore, we considered this within our classification task formulation. In classical PSO, swarm individuals are called particles, and the population is called the swarm. Each particle has its own position, velocity and historical information. The particles fly through the search space by using their own as well as their neighbors’ historical information to steer toward the local or global optima.
In particular, a discrete PSO approach (DPSO-LS) for the classification rule mining problem is proposed. A Rule Base (RB) as a whole represents a ‘particle’. Each RB is denoted as a matrix, where each row describes a classification rule. The rules are IF-THEN rules consisting of conjunctive antecedents and one consequent. Hence, theithparticle is presented as follows:
Pi = ai 1,1 ai1,2 ... ai1,n ci1 ai 2,1 ai2,2 ... ai2,n ci2 ... ... ... ... ... ai m,1 aim,2 ... aim,n cim (2.1) whereai
mnrepresents thenthantecedent in themthrule of theithparticle.cimis themthconsequent
of theithparticle. mis the number of rules, andn is the number of antecedents. Thus, a particle
consists ofmrules, where each rule hasnantecedents and 1 consequent.
The values of every antecedent are enumerated consecutively starting from 1. In this work, an antecedent has 3 discrete values, it will be enumerated as {1,2,3}. In this way, 0 means the antecedent is ignored. Thus, a rule with all its antecedents having a value of 0 is not allowed. In
addition, the constraints of the swarm position updating process need to be considered since the particle might fly outside the solution space:
aij,k ∈[0, N Fin], j ∈ {1,2, ..., m} (2.2)
k ∈ {1,2, ..., n} (2.3)
cij ∈[1, N Fout] (2.4)
whereN FinandN Foutrepresent the number of discrete values for an antecedent and a consequent,
respectively. Theithparticle’s velocity matrix is denoted as follows:
Vi = vi 1,1 v1i,2 ... v1i,n v1i,n+1 vi 2,1 v2i,2 ... v2i,n v2i,n+1 ... ... ... ... ... vi m,1 vm,i 2 ... vim,n vm,ni +1 (2.5) wherevi
j,k ∈[Vmin, Vmax],j ∈ {1,2, ..., m}, and the velocity matrix has the same dimension as the
position matrix. Vmin andVmax are the minimum and maximum values allowed for the velocity,
respectively. More specifically, we use a change vectorV~i, which is the change vector for the ith
particle with the same dimension as the velocity matrix.
~ Vi = ˆ vi 1,1 ˆv1i,2 ... ˆv1i,n vˆ1i,n+1 ˆ vi 2,1 v2i,2 ... v2i,n v2i,n+1 ... ... ... ... ... ˆ vi m,1 vˆm,i 2 ... vˆim,n vˆm,ni +1 (2.6)
The values ofV~i are randomly assigned to 1, 2 and 3, where 1, 2 and 3 are denoted as three
the local best position (P best). 2 is denoted as the direction of the particle’s movement from the current position to the global best position (Gbest). 3 is denoted as the direction of the particle’s movement from the current position to another position at random within a specified range. The three directions are randomly assigned by following the ratiosω1,ω2, andω3(ω1 < ω2 < ω3). As shown in Equation 2.7, the sum of the ratios should be equal to one. By adopting the concept of change vector, the velocity of the particle can be updated by considering the local best position, global best position and random changes. Precisely, as shown in Equation 2.8, for theithparticle,
V1(t)is the difference between the local best position and the current position, whileV~i consist of
1s, and the rest of the values in the matrix are set to 0. Similarly,V2(t)is the difference between the global best position and the current position, whileV~i consist of 2s. Values ofV3(t)are randomly
assigned within a specified range (see Equation 2.9), while values ofV~i consist of 3s at the same
positions. ⊕denotes a matrix addition.
ω1+ω2+ω3 = 1 (2.7)
V(t+ 1) =V1(t)⊕V2(t)⊕V3(t) (2.8)
V3(t)∈[Vmin, Vmax] (2.9)
After the velocity has been calculated, the particle’s position can be computed as follows:
P(t+ 1) =P(t)⊕V(t+ 1) (2.10)
2.2.2. Definition of Overall Fitness
We propose a rule selection method where the number of classification rules included in each rule set is fixed to a predefined number. That is, each rule set with a specific number of rules (a
rule base) is a particle. Thus, the overall fitness function of the rule set can be defined as follows:
F(S) = Accuracy(Coverage) = N CP(S)
|S| (2.11)
whereN CP(S)is the number of instances that have been correctly classified in the data setS, and |S|is the number of instances in the data setS.
2.2.3. Local Mutation Strategy
Since PSO, in general, can easily get stuck in local optima, a local strategy need to be devised that is run after a certain number of iterations has elapsed. In particular, the local strategy that was devised for DPSO-LS makes use of mutation. The proposed local strategy refines the worst rule of the best rule base, i.e., the global best position, in order to improve the overall performance every 20 iterations. Thus, for each selected worst rule, we mutate one value of the antecedent randomly within the constraints to see whether it improves the overall performance or not. If it improves the performance, we stop and replace the worst rule with the new rule. Otherwise, we continue mutating randomly until we have found a new rule or until we have mutated a maximum of 10 times.
The equation to measure the quality of every rule uses the Laplace-corrected precision [33] equation, which is given as:
f = 1 +T P
1 +T P +F P (2.12)
whereT P is the number of True Positives, andF P is the number of False Positives. The equation is also used to prune the rules for which thef value is less than 0.1.
2.2.4. DPSO-LS Classifier
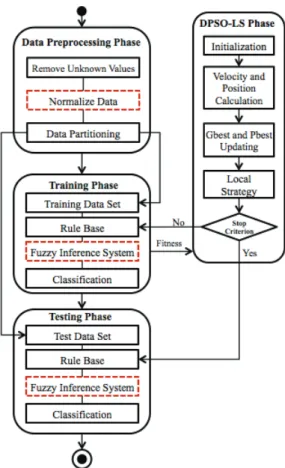
The proposed algorithm includes four main phases: data preprocessing phase, training phase, DPSO phase and testing phase. As shown in Figure 1, the DPSO-LS classifier includes all the solid rectangles and excludes the red dashed rectangles (these are only used for FDPSO-LS). The four phases are described respectively as follows.
Figure 1. Processes of DPSO-LS based classifiers.
1. Data Preprocessing Phase
In this phase, firstly, we need to remove instances that have unknown values since the proposed system cannot handle these values. It is also known that the proposed system can only handle numerical data, if the class labels are non-numerical data, we convert it into numeric values. Then, the data set is randomly partitioned into 10 folds. 9 folds of the data is training data, which is used in the training phase, and 1 fold of the data is testing data, which is used in the testing phase.
2. DPSO-LS Phase
In this phase, the swarm is initialized. The velocity and position of each particle in the swarm are calculated. GBestandP bestas described above are calculated, and their values
are updated after the velocity and position have been updated accordingly. A local strategy is applied every 20 iterations. If the stopping criterion has not been met, GbestandP best are forwarded to the training phase to calculate the overall fitness (see Equation 2.11), and individual fitness (see Equation 2.12). The DPSO-LS is stopped when the maximum number of iterations is met. The finalGbestis forwarded to the testing phase.
3. Training Phase
A rule base which is forwarded by the DPSO-LS phase is used to classify the train-ing data set. The overall fitness and individual fitness are calculated accordtrain-ingly and are forwarded to the DPSO-LS.
4. Testing Phase
The finalGbestforwarded by the DPSO-LS phase is used to classify the testing data set, and the experimental measures are calculated.
2.2.5. FDPSO-LS Classifier
A modified classifier, called fuzzy DPSO-LS classifier (FDPSO-LS), is implemented for both discrete and continuous data sets. A fuzzy partition with a simple fuzzy grid is adopted. Fuzzy set theory and the concept of linguistic variables, which were proposed by Zadeh [7, 8], have been widely used in pattern recognition and fuzzy reasoning. The use of the simple fuzzy partition method on classification rule discovery has been introduced in [37]. Applications on the fuzzy rule generation for control problems were proposed in [49]. Moreover, several fuzzy approaches for partitioning a pattern space were discussed in [50, 51].
Specially, an example of using the simple fuzzy partition method is showing in Figure 2, each attribute can be partitioned into three linguistic terms (denoted as L = low, M = medium, H = high). Triangular membership functions are used for the linguistic terms. In the proposed method, each linguistic term is viewed as a candidate 1-dimension fuzzy grid. Considering a two-class
classification problem as in Figure 2, two antecedents with three membership functions can be partitioned into 9 grids on a 2-dimension plane. The closed circles and open circles denote the pattern in class 1 and class 2, respectively.
Figure 2. An example of fuzzy partition.
However, in the case of ann-dimensional classification problem, where each dimension has mlinguistic terms, the possible number of rules is mn. As the number of rules rises, an efficient
algorithm that can automatically find the fuzzy rules is important and necessary.
Normally, several rules of the rule base are fired in the fuzzy rule classification system. The predicted class for a given instance is determined by the membership degree of the input variables.
Specifically, for each classk,
βClass k = arg max
k X 1≤i≤n Y 1≤j≤m µij (2.13)
whereµij is the input membership degree of the ith rule of thejth antecedent. The class that has
the largestβ value is selected as the predicted class. Moreover, unlike the DPSO-LS classifier, the rule that has the smallestβvalue is chosen as the worst rule.
As shown in Figure 1, FDPSO-LS has similar processes as DPSO-LS, however, all the rectangles are used. The four main phases of data preprocessing, training, DPSO-LS and testing are similar to DPSO-LS. In the data preprocessing phase, besides the removal of unknown values and data partitioning processes, a data normalization process is used to normalize continuous data. Each column of the data set is normalized between 0 and 1 using Equation 2.14:
Xi =
Xi−Xmin
Xmax−Xmin
(2.14) whereXi is theith value of the column. Xmin is the minimum value of the column, andXmax is
the maximum value of the column. The data set is partitioned into 10 folds. 9 folds of the data are used as the training data set, and the remainder is used as the test data set for the implementation.
The DPSO-LS phase is the same as for the DPSO-LS classifier. However, in the training and testing phases, a fuzzy inference process is added for the fuzzy reasoning process. The Fuzzy Inference System (FIS) is a popular computing system based on the concepts of fuzzy set theory, fuzzy if-then rules, and fuzzy reasoning. It has been successfully applied to a wide variety of fields, such as automatic control, data classification, expert systems, decision analysis, etc. Due to its multidisciplinary nature, FIS is known by numerous other names. However, we only concentrate on the concept of the fuzzy IF-THEN rules.
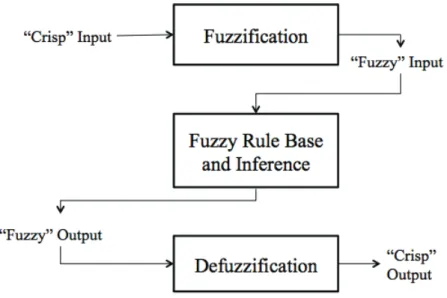
The basic structure of a fuzzy inference process consists of three modules: fuzzification, fuzzy rule base and inference, and defuzzification. As shown in Figure 3, a crisp input is taken,
the fuzzification module coverts the crisp input into a fuzzy input using the fuzzy set theory. In the second module, fuzzy rules are contained in a rule base and a reasoning mechanism that performs the inference procedure is included. Finally, a method of defuzzification to extract a crisp output that represents a fuzzy set is needed by the third module. Due to the way outputs are determined, there are two types of inference systems: Mamdani and Sugeno. Mamdani’s fuzzy inference system was among the first control systems built using fuzzy set theory, which was proposed in 1975 by Ebrahim Mamdani [52]. Sugeno, or Takagi-Sugeno-Kang, was introduced in 1985 [53]. It is similar to the Mamdani method in many respects, however, the main difference between Mamdani and Sugeno is that the Sugeno output membership functions are either linear or constant. In this approach, only the Mamdani style of defuzzification is considered.
Figure 3. Fuzzy inference process.
2.3. Experiments and Results
As mentioned above, the experiments are conducted for three approaches: DPSO (with-out local strategy), DPSO-LS and FDPSO-LS. The experimental setup for both approaches are described in the following subsection followed by the description of the experimental results of
both approaches. The results of DPSO-LS and FDPSO-LS are listed, respectively, followed by a comparison.
2.3.1. Experimental Setup
The experiments of the two approaches are conducted on a number of data sets taken from the UCI repository [54]. The experiments of the two approaches are evaluated on an ASUS desktop (Intel(R) Dual Core I3 CPU @3.07 GHz, 3.07 GHz) Matlab Version 7.13. All measurements of the two approaches are tested 10 times using 10-fold cross validation [60]. Each data set is divided into 10 random partitions. Nine partitions of the data set are used as the training data, and one partition is selected as the test data.
2.3.2. Results of the DPSO-LS Approach
As far as the performance evaluation is concerned for the proposed DPSO-LS algorithm, a comparison with other rule classification algorithms JRip, PART and decision tree algorithm J48 is performed. These three algorithms have been implemented in WEKA (Waikato Environment for Knowledge Analysis) [60]. The algorithms are summarized as follows:
• JRip is a RIPPER rule learning algorithm [55]. JRip is based on association rules with
re-duced error pruning (REP), and integrates rere-duced error pruning with a separate-and-conquer strategy. It is a very common and effective technique found in decision tree algorithms.
• PART is created by Frank and Witten [56] for a partial decision tree. PART combines the
separate-and-conquer strategy of RIPPER with the decision tree. It works by building a rule and removing its cover until all the instances are covered.
• J48 is a decision tree implementation induced by the C4.5 algorithm, which is developed by
Quinlan [13]. It learns decision trees for the given data by constructing them in a top-down way.
Table 1 shows the parameters and their values used for our DPSO, DPSO-LS and FDPSO-LS algorithms. Usually, a large swarm size requires less iterations to reach convergence in PSO. In
Table 1. Parameters and their values of the DPSO and DPSO-LS algorithms. Parameters Values Swarm Size 25 Maximum Iteration 100 (ω1,ω2,ω3) (0.2, 0.3, 0.5) [Vmin,Vmax] [-1, 1]
our proposed algorithm, the swarm size is chosen as 25, and the maximum number of iterations for each run is set to 100. The description of the selected data sets used are summarized in terms of number of attributes, number of instances and number of classes as shown in Table 2. The 6 data sets are listed alphabetically, where data set Breast-L and Breast-W are abbreviations for Ljubljana
Breast Cancer and Wisconsin Breast Cancer, respectively.
Table 2. Data sets used for the experiments.
Data Set Attributes Instances Classes
Balance-scale 4 625 3 Breast-L 9 286 2 Breast-W 9 699 2 Car 6 1728 4 Lymphography 18 146 4 Tic-Tac-Toe 9 958 2
Measured are the rule size, the weighted average True Positive Rates (TPRs) and False Positive Rates (FPRs), as well as the precision.
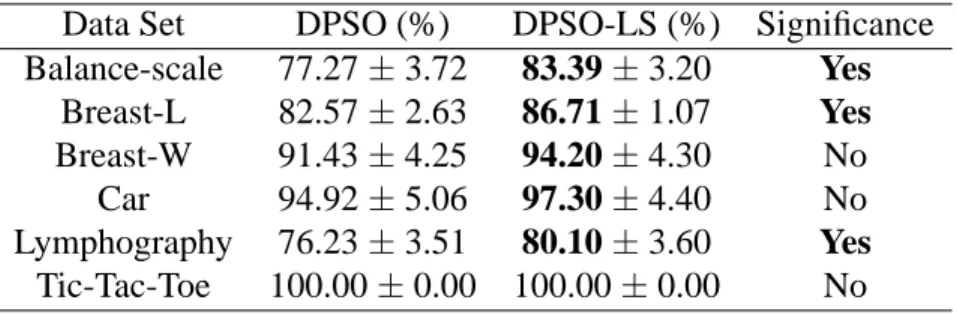
As we mentioned before, the DPSO can easily get stuck in local optima. In order to see the performance improvements of the local strategy, we compare DPSO (without local strategy) with DPSO-LS (with local strategy) by running them 10 times for 100 iterations each. The average accuracy of the 10 runs is listed in Table 3. A corresponding two-tailed Student’s t-test with a significance level of 5% is applied. The results show that the proposed DPSO-LS can achieve better accuracy in all cases. However, DPSO-LS only shows significant improvements in 3 of 6 cases.
Table 3. Average accuracy of DPSO and DPSO-LS for 100 iterations. Data Set DPSO (%) DPSO-LS (%) Significance Balance-scale 77.27±3.72 83.39±3.20 Yes Breast-L 82.57±2.63 86.71±1.07 Yes Breast-W 91.43±4.25 94.20±4.30 No Car 94.92±5.06 97.30±4.40 No Lymphography 76.23±3.51 80.10±3.60 Yes Tic-Tac-Toe 100.00±0.00 100.00±0.00 No
In Figure 4, we see the accuracy of DPSO-LS compared to DPSO, JRip, PART and J48. Error bars are shown on the histograms of the DPSO-LS and DPSO (for the other algorithms, no variants were reported since they are not captured by WEKA). In most cases, the DPSO-LS algorithm has a higher accuracy. Although the Breast-W data set does not show better results, the values of the other four algorithms are very close.
!" #!" $!" %!" &!" '!!" ()*)+,-./, )*-" (0-)/ 1.2"" (0-)/ 1.3"" 4)0"" 2567891 9:0)78 5" ;<,.; ),.; 9-"" !" # $% &' $()*+( =>[email protected]?" =>?@" AB<7" >CB;" A$&"
Figure 4. Accuracy of all algorithms.
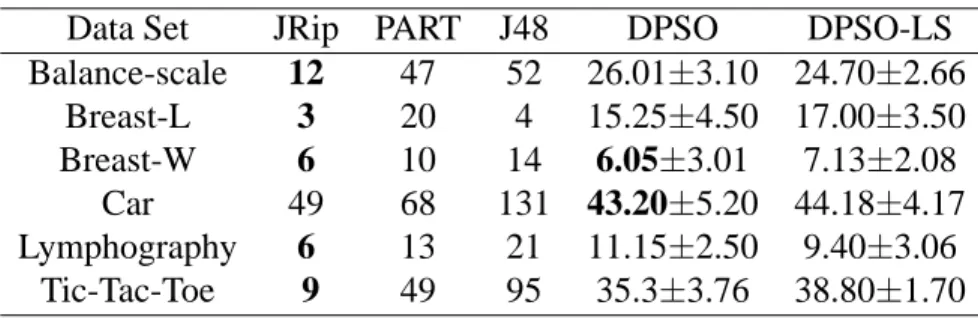
For all rule mining algorithms it is necessary to test the average rule set size to indicate the complexity of the rule set produced by each algorithm. Table 4 lists the size of the rule set required for DPSO, DPSO-LS, JRip, PART, and J48. As shown in the table, the JRip algorithm always requires the least number of rules, while the PART algorithm requires the most number of rules. J48 uses by far the most number of rules with the exception of the Breast-L data set. The number
of rules for the proposed DPSO-LS algorithm is less than the PART algorithm. Both DPSO-LS and DPSO show comparable results in terms of rule size.
Table 4. Average rule size of all algorithms.
Data Set JRip PART J48 DPSO DPSO-LS
Balance-scale 12 47 52 26.01±3.10 24.70±2.66 Breast-L 3 20 4 15.25±4.50 17.00±3.50 Breast-W 6 10 14 6.05±3.01 7.13±2.08 Car 49 68 131 43.20±5.20 44.18±4.17 Lymphography 6 13 21 11.15±2.50 9.40±3.06 Tic-Tac-Toe 9 49 95 35.3±3.76 38.80±1.70
Table 5 lists the average weighted TPR, which is also referred to as sensitivity. As shown in the table, the proposed algorithm, DPSO-LS, scores better than DPSO, JRip, PART and J48 in terms of sensitivity.
Table 5. Average weighted TPRs (%) of all algorithms.
Data Set JRip PART J48 DPSO DPSO-LS
Balance-scale 80.8 87.5 76.6 80.20±3.12 87.40±2.30 Breast-L 71.0 71.3 75.5 81.80±2.22 89.50±3.70 Breast-W 95.4 93.8 94.6 92.36±4.30 97.27±2.10 Car 86.5 95.8 92.4 93.50±3.10 98.84±1.33 Lymphography 77.7 76.4 77.0 73.30±3.26 80.50±4.40 Tic-Tac-Toe 97.8 94.3 84.6 100.00±0.00 100.00±0.00
The weighted average FRPs, which represent 1-Specificity, are listed in Table 6. The FPRs of DPSO-LS are less than the other algorithms except for the Lymphography data set.
The weighted average precision values are compared in Table 7. The precision of the DPSO-LS is always better than DPSO, JRip, PART and J48, showing the largest improvement on the Breast-L data set.
Table 6. Average weighted FPRs (%) of all algorithms.
Data Set JRip PART J48 DPSO DPSO-LS
Balance-scale 16.4 9.7 17.3 15.01±3.25 8.70±2.20 Breast-L 48.9 54.2 52.4 25.80±4.30 16.00±7.20 Breast-W 4.4 8.0 6.4 1.20±0.18 0.50±0.01 Car 6.4 1.6 5.6 5.27±2.30 1.04±0.05 Lymphography 21.6 21 18.7 30.11±5.60 22.00±3.40 Tic-Tac-Toe 3.10 7.6 19.1 0.00±0.00 0.00±0.00
Table 7. Average weighted precision (%) of all algorithms.
Data Set JRip PART J48 DPSO DPSO-LS
Balance-scale 74.5 83.3 73.2 79.95±3.80 85.40±3.20 Breast-L 68.8 68.2 75.2 83.16±3.30 89.50±3.60 Breast-W 95.5 93.8 94.6 92.35±4.10 96.59±2.15 Car 88.1 95.9 92.4 93.76±3.30 99.10±1.20 Lymphography 76.5 76.6 77.6 71.31±5.12 78.57±5.80 Tic-Tac-Toe 97.8 94.2 84.6 100.00±0.00 100.00±0.00
2.4. Comparison and Results of DPSO-LS and FDPSO-LS for Discrete Data Sets
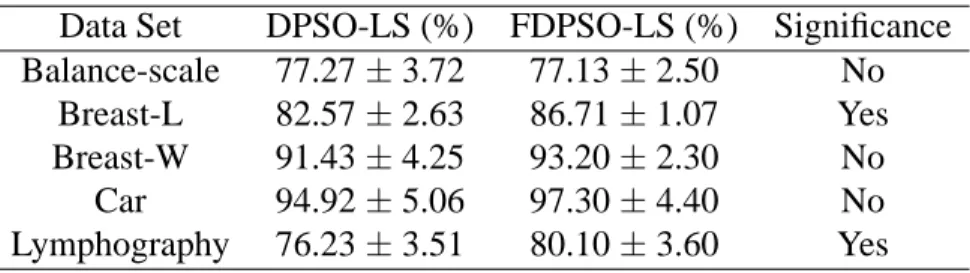
In order to compare the performance of DPSP-LS and FDPSO-LS on discrete data sets, a corresponding two-tailed Student’s t-test with a significance level of5% is applied. As shown in Table 8, only 2 of the 5 data sets show significant improvements.
Table 8. Average accuracy of DPSO-LS and FDPSO-LS for 100 iterations. Data Set DPSO-LS (%) FDPSO-LS (%) Significance Balance-scale 77.27±3.72 77.13±2.50 No
Breast-L 82.57±2.63 86.71±1.07 Yes Breast-W 91.43±4.25 93.20±2.30 No
Car 94.92±5.06 97.30±4.40 No
Lymphography 76.23±3.51 80.10±3.60 Yes
In Figure 5, we see the average accuracy of the DPSO-LS compared to FDPSO-LS. Error bars are shown on the histograms of both the proposed algorithms. In most cases, the proposed
FDPSO-LS algorithm has a higher accuracy. Besides the Balance-scale data set, FDPSO-LS achieves better results for the other four data sets.
Figure 5. Accuracy comparison of DPSO-LS and FDPSO-LS.
In Table 9, the average rule size of DPSO-LS and FDPSO-LS is compared. FDPSO-LS requires less number of rules than DPSO-LS due to the usage of the linguistic variables.
Table 9. Average rule size of DPSO-LS and FDPSO-LS for 10 runs. Data Set DPSO-LS (%) FDPSO-LS (%)
Balance-scale 24.70±2.66 7.12±2.10 Breast-L 17.00±3.50 10.24±3.07 Breast-W 7.13±2.08 7.08±2.30
Car 44.18±4.17 14.12±4.40 Lymphography 9.40±3.06 5.60±3.60
Table 10 shows the average weighted TPR of DPSO and FDPSO-LS. FDPSO-LS does not show improvements compared to DPSO-LS for discrete data sets. FDPSO-LS scores slightly better on 2 out of 5 data sets.
As shown in Table 11, FDPSO-LS has a smaller FPRs in most cases except for the Car data set.
In terms of average weighted precision, FDPSO-LS does not show improvements compared to DPSO-LS on the discrete data sets except for Lymphography as shown in Table 12.
Table 10. Average weighted TPRs of DPSO-LS and FDPSO-LS for 10 runs. Data Set DPSO-LS (%) FDPSO-LS (%)
Balance-scale 87.40±2.30 88.13±3.12 Breast-L 89.50±3.70 86.71±2.70 Breast-W 97.27±2.10 95.7±2.30
Car 98.84±1.33 93.80±3.45
Lymphography 80.50±4.40 83.80±2.60
Table 11. Average weighted FPRs of DPSO-LS and FDPSO-LS for 10 runs. Data Set DPSO-LS (%) FDPSO-LS (%)
Balance-scale 8.70±2.20 1.65±2.80 Breast-L 16.00±7.20 7.42±1.07 Breast-W 5.00±1.20 4.10±2.23 Car 1.04±0.05 5.80±2.18 Lymphography 22.00±3.4 16.50±2.34
Overall, with respect to discrete data sets, FDPSO-LS does not significant good improve-ments in most cases. One reason is that it does not efficiently normalize discrete data sets using liguistic terms. Usually, it causes overfitting and decreases the accuracy. For example, for the Balance-scale data set each attribute has either 3 or 4 discrete values, and FDPSO-LS uses 3 membership functions. When we normalize the attribute values into 3 membership function, the data does not partition well for the attributes having small discrete values.
2.5. Results of FDPSO-LS Approach for Continuous Data Set
As far as the performance evaluation for the proposed FDPSO-LS is concerned, a comparison with other rule classification algorithm FURIA is performed. FURIA is short for Fuzzy Unordered Rule Induction Algorithm which extends the well-known RIPPER algorithm [57]. FURIA learns unordered fuzzy rule sets instead of rule lists. It includes a number of modifications and extensions to deal with uncovered examples.
Table 12. Average weighted precision of DPSO-LS and FDPSO-LS for 10 runs. Data Set DPSO-LS (%) FDPSO-LS (%)
Balance-scale 85.40±3.20 82.10±2.50 Breast-L 89.50±3.60 85.71±3.32 Breast-W 96.59±2.15 96.70±4.30
Car 99.10±1.20 97.30±2.40
Lymphography 78.57±5.80 82.80±3.41
The description of the selected data sets used are summarized in terms of number of at-tributes, number of instances, and number of classes as shown in Table 13. The 5 data sets are listed alphabetically.
Table 13. Datasets used for the proposed fuzzy rule-based system using DPSO-LS.
Data Set Attributes Instances Classes
Breast-W 9 699 2
Glass 10 214 7
Haberman’s Survival 3 306 2
Iris 4 150 3
Pima Indians Diabetes 8 768 2
Measured are also the rule size evolved, the weighted average TPRs and FPRs, as well as the precision.
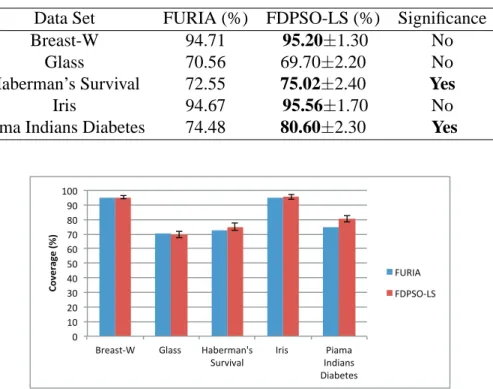
In order to observe the performance, we compared FURIA with FDPSO-LS by running both algorithms 10 times for 100 iterations each. The average accuracy of the 10 runs is listed in Table 14. The corresponding two-tailed Student’s t-test with a significance level of5%was applied. The results show that the proposed FDPSO-LS can achieve better accuracy in most cases except for the glass data set. However, FDPSO-LS only shows significant improvements for 2 of the 5 data sets. In Figure 6, we see the average accuracy of the proposed FDPSO-LS compared to FURIA. Error bars are shown on the histograms of the proposed FDPSO-LS. For most data sets, the proposed LS algorithm has a higher accuracy. Besides, for the glass data set FDPSO-LS obtains higher accuracy for the other data sets.
Table 14. Average accuracy of FURIA and FDPSO-LS for 100 iterations. Data Set FURIA (%) FDPSO-LS (%) Significance
Breast-W 94.71 95.20±1.30 No
Glass 70.56 69.70±2.20 No
Haberman’s Survival 72.55 75.02±2.40 Yes
Iris 94.67 95.56±1.70 No
Pima Indians Diabetes 74.48 80.60±2.30 Yes
!" #!" $!" %!" &!" '!" (!" )!" *!" +!" #!!" ,-./0123" 45/00"" 6/7.-8/9:0" ;<-=>=/5"" ?->0"" @>/8/" ?9A>/90" B>/7.1.0" !"#$%&'$()*+( CDE?F" CB@;G2H;"
Figure 6. Accuracy comparison of the proposed FDPSO-LS and FURIA.
Table 15 lists the size of the rule set required for FDPSO-LS and FURIA. As shown in the table, the number of rules for the proposed FDPSO-LS is less than for the FURIA algorithm for most data sets. The reason is that the proposed FDPSO-LS reduces the rule size since it uses the local strategy. The values after±are standard deviations of the corresponding results.
Table 16 lists the average weighted True Positive Rates (TPRs), which are also referred to as sensitivity. As shown in the table, the proposed algorithm, FDPSO-LS, scores better than FURIA for most data sets in terms of sensitivity except for the Glass data set.
The weighted average FPRs, which represent 1-Specificity, are listed in Table 17. The FPRs of the proposed FDPSO-LS are less than FURIA, which indicates that FURIA has a higher false positive rate.
Table 15. Average rule size of FDPSO-LS and FURIA. Data Set FURIA (%) FDPSO-LS (%)
Breast-W 15 7.12±2.10
Glass 16 9.40±3.20
Haberman’s Survival 4 7.20±2.40
Iris 5 4.00±1.70
Pima Indians Diabetes 5 7.70±2.30
Table 16. Average weighted TPRs of FDPSO-LS and FURIA. Data Set FURIA (%) FDPSO-LS (%)
Breast-W 94.7 95.20±2.13
Glass 70.6 69.50±3.21
Haberman’s Survival 72.5 78.10±2.72
Iris 94.7 94.74±2.33
Pima Indians Diabetes 74.5 81.20±3.11
The weighted average precision values are compared in Table 18. The precision of FDPSO-LS is always better than FURIA, showing the largest improvement on the Haberman’s Survival and Pima Indians Diabetes data sets.
2.6. Summary
In this study, we have proposed two classifiers: DPSO-LS and FDPSO-LS. Both classifiers are based on the proposed DPSO-LS algorithm, which uses a rule base to represent a ‘particle’ that evolves the rule base over time. DPSO-LS is implemented as a matrix of rules, representing IF-THEN classification rules, that have conjunctive antecedents and one consequent. In addition, a local mutation search strategy was incorporated in order to take care of the premature convergence of PSO. The DPSO-LS classifier was applied on discrete data sets based on the IF-THEN classifi-cation rules, while the FDPSO-LS is based on the concept of fuzzy IF-THEN rules and is applied to both discrete and continuous data sets.
Experiments were conducted using 6 discrete data sets and 5 continuous data sets that are taken from the UCI repository. Our DPSO-LS algorithm was compared against DPSO, JRip,
Table 17. Average weighted FPRs of FDPSO-LS and FURIA. Data Set FURIA (%) FDPSO-LS (%)
Breast-W 6.7 4.70±3.23
Glass 13.1 7.80±3.81
Haberman’s Survival 57.3 33.80±5.20
Iris 2.7 2.58±1.20
Pima Indians Diabetes 36.7 23.30±3.70
Table 18. Average weighted precision of FDPSO-LS and FURIA. Data Set FURIA (%) FDPSO-LS (%)
Breast-W 94.7 96.70±2.70
Glass 70.5 70.10±3.20
Haberman’s Survival 69 .0 77.80±3.13
Iris 94.7 95.10±2.40
Pima Indians Diabetes 73.7 80.23±3.61
PART and J48. In addition, FDPSO-LS was compared against FURIA. Measures used were rule size, TPRs, FPRs, and precision. The experimental results revealed that DPSO-LS achieves better performance for most data sets than FPSO-LS applied to discrete data sets. On the other hand, FDPSO-LS obtains better performance when applied to continuous data sets compared to FURIA.