bTUT, Department of Chemistry, Akadeemia tee 15, Tallinn, Estonia
a r t i c l e i n f o Article history:
Received 29 July 2010 Received in revised form 11 December 2010 Accepted 13 December 2010 Available online 7 January 2011 Keywords: Desktop grid Service grid Science gateway Boinc Cloud Drug discovery
a b s t r a c t
Drug design is a challenging and computationally intensive task. Chemists are often faced with handling huge amounts of data as well as with working with huge amounts of computational resources. This paper shows that using the BOINC system as a private, dedicated desktop grid a community, like the EU CancerGrid chemist community, can easily set up its own high-end infrastructure based on available and inexpensive desktop computers. The CancerGrid Computing System described in the paper can easily be adapted for the needs of other user communities having similar infrastructure requirements.
©2011 Elsevier B.V. All rights reserved.
1. Introduction
In computational sciences, where a large quantity of processing capacity is required the usage of grid technology is a solution for building the infrastructure. Creating a computational grid enables its users to access a large number of machines to perform the required calculation. The algorithms themselves, the resources and the way computations are assigned to the resources should be hidden from the users. For this purpose high-level web-interfaces should be provided for the user to perform the assignment of data and algorithms. One of the scientific areas requiring large amount of computational power is chemo informatics for drug discovery processes and chemical technology.
There are several alternative ways to build the required large scale computing infrastructure. In the last decade the most popular alternative was the creation of grid systems. Grid technology enables resource sharing across several administrative domains. It requires a strong partnership among the participating institutions and hence it is particularly useful in scientific research. However, it is not popular when companies are involved where competition is more important than collaboration. The other drawback of this technology for companies is the use of complicated middleware (e.g. gLite, Globus, Unicore, etc.) that is difficult to deploy and
∗Corresponding author. Tel.: +36 13297864; fax: +36 13297864.
E-mail addresses:[email protected](J. Kovács),[email protected](P. Kacsuk), [email protected](A. Lomaka).
maintain requiring large and costly human efforts. Grid technology also requires a strong user involvement that is not desired in a field where non-IT specialists like chemists, biologists and medical doctors should use the infrastructure for drug discovery.
An alternative approach called cloud technology has been recently developed and offered for accessing unlimited resources in a commercial setting. This technology fits companies much better for many reasons. They can outsource the creation and maintenance work of the required infrastructure. Moreover, they can always access the required size of infrastructure in a dynamic, on-demand way and pay only as they use it. The user interface is much simpler than in the case of grid systems and high level services can be easily created for the non-IT specialists. However, when academic partners are also involved in a project the usage of commercial clouds is less attractive since the funding mechanism of academic research currently does not support the infrastructure outsourcing approach.
Consortium members of the EU CancerGrid project have developed a third alternative that could be attractive both for companies and academic institutions when they run joint research projects. This approach is based on the local SZDG (SZTAKI Desktop Grid) package that enables the fast and inexpensive creation of a private desktop grid system from the desktop machines of the partner companies and institutions. It also includes a high level web user interface called as WS-PGRADE based on which the necessary science gateway can be quickly constructed and set up for the non-IT specialists. This science gateway makes the whole infrastructure transparent for the end-users in the same
0167-739X/$ – see front matter©2011 Elsevier B.V. All rights reserved. doi:10.1016/j.future.2010.12.008
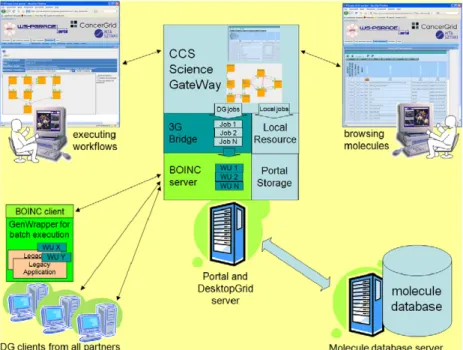
Fig. 1. The CancerGrid computing system.
way as the SaaS services appear in cloud systems. The main advantage of the CancerGrid Computing System (CCS) compared to the use of commercial clouds is that while its resources can easily be expanded similar to clouds it does not require any payment from the participating partners since it uses their existing desktop machines. Its advantage over the grid systems is that the deployment and maintenance of the CCS is much simpler than in the case of typical grid middleware. Once it is established it requires minimal human supervision.
The current paper describes in detail the CancerGrid Computing System including its architecture, the applied drug discovery algorithms and the high level web based graphical interface. The structure of the paper is as follows. Section 2 gives a detailed overview of the architecture and infrastructure of the CCS. Section3describes the QSAR modelling process that is the basis of the drug discovery process. It also introduces the chemical workflows that are the basis of the QSAR modelling process. Section4introduces the CCS science gateway and its two main sets of operations: molecule browsing and QSAR modelling workflow execution. Section5evaluates the CCS and shows our experiences how the system was optimized to solve scheduling related issues. Finally, Section6describes related research.
2. The CancerGrid computing system
The CancerGrid computing system consists of three main components (as shown inFig. 1): the private desktop grid system, the molecule database and the science gateway.
The private desktop grid system is used for processing the jobs, molecule database is for storing molecules and science gateway is the user interface for the chemists. These three components are described in more details in the next subsections.
2.1. Private desktop grid system
The private desktop grid system is used to collect desktop or cluster resources from partner institutions and companies. Partners can connect dedicated and non-dedicated resources to the desktop grid server based on the applied SZDG (SZTAKI Desktop Grid) system. Instead of building a volunteer desktop grid system,
SZDG uses the BOINC technology to create a private desktop grid system for which only the partner institutions can connect their resources. It has several advantages and drawbacks compared to the public BOINC systems like SETI@home, folding @home, etc.
The main advantage is that the system is more secure than a public BOINC system since only trusted resources are allowed to join. It is very important for the participating companies since their algorithms and data are confidential in many cases and hence they prefer a system that is secure over a system that can collect more resources but it is less secure. Since only trusted resources participate in the CCS the redundant computation used in public BOINC system to detect malicious resources are not needed. The redundant computation wastes a lot of resources and hence the private DG concept results in a much better performing desktop grid system than the public BOINC systems. It also alleviates the need of using the many times complex validation procedure of public BOINC systems. Furthermore, the credit system applied in public BOINC systems becomes needless since the resources are collected from the partners to realize their own scientific objectives and hence they are not interested in collecting credits. Similarly, the fancy project web page and PR activities can also be omitted in such private desktop grid systems as the one used in the CCS.
The obvious drawback of the use of a private (or, often called institutional) DG system is that the number of resources that are collected is much smaller than in the case of a public DG system. An important aspect here is the license of the applied software packages. In drug discovery, most of the software packages are commercial ones and their license fee for large number of volunteer resources could be too high.
Comparing the advantages and drawbacks partners of the CancerGrid project voted for the use of a private DG system. The SZDG (SZTAKI Desktop Grid) package is a variant of BOINC tailored to support the building of this kind of private DG systems and hence the project selected SZDG as the basis of the CCS infrastructure.
SZDG has many extensions compared to BOINC. SZDG extends BOINC in several aspects, like: installation/deployment, applica-tion support, security, interfaces. SZDG provides easy-to-deploy software packages, and easy-to-setup project setup facilities. For
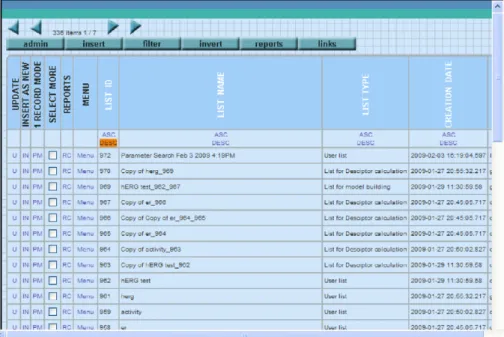
Fig. 2. Molecule database browser.
application support there are several enhancements, like DC-API for developing master/worker applications, or GenWrapper to sup-port the execution of legacy application. On the security side SZDG enhancements cover the utilisation of X.509 certificates for appli-cation trust while the provided virtualisation/sandboxing technol-ogy allows the execution of the application on the client resources in a safer way. Regarding the interfaces, different implementations of the DC-API enables the utilisation of other distributed comput-ing infrastructure (DCI) like Condor and a gateway called 3GBridge has been developed to forward jobs between different DCIs, like gLite, BOINC, XtremWeb and to those supporting BES interface. Finally, the SZDG package also contains improved monitoring fa-cilities. In the following paragraphs, we list the SZDG extensions which are actively used in the CCS. Interested readers can find even more details about SZDG in [1].
DC-API: Instead of using BOINC API SZDG users can develop code in a much easier way by using the DC-API (Distributed Computing API). Another advantage of using the DC-API is that it results in a generic master–worker application that can be used by other type of desktop grid systems not only on BOINC. For example, DC-API based applications can run on XtremWeb and Condor DG systems too, without any modification of the code.
GenWrapper: In order to port legacy applications into SZDG, GenWrapper can be used. It minimizes user effort and makes the porting process extremely straightforward.
WS-PGRADE portal and gUSE: Unlike BOINC, SZDG comes to-gether with a high level graphical user interface. It further simpli-fies the development of SZDG applications for code developer and application execution for end-users. Section4gives more details on the WS-PGRADE portal and gUSE and their use for creating a science gateway for the CCS end-users.
3G Bridge: In order to run parameter sweep applications from WS-PGRADE to SZDG, 3G Bridge connects the WS-PGRADE portal with the SZDG server. Details of the use of 3G Bridge are described in [2].
SZDG monitor: provides a graphical interface through which the SZDG system administrator (or in the current case the CCS system administrator) can observe the operational characteristics and workload of the client desktop machines. It also significantly helped in the development of the CCS scheduler.
2.2. Molecule database
Since the main focus of this paper is on the DesktopGrid related solutions and chemistry applications, the internal details of the implementation of the database are out of the scope of this paper. However, an overview of the user interface will be given in the next few paragraphs.
The chemical components which are to be inspected, analysed, visualised or processed by a chemist user are stored in a central database. The goal of the database are to provide a storage system for the users where they can store, manipulate and search their chemical items easily.
The current setup of the database can handle molecular structures, substructures, descriptors. Each of these components is stored in a relational database where various functionalities are provided for the user and also for the grid when inputs are to be delivered to the computing nodes.
All elements of the database are organised into lists (see
Fig. 2). The basic data element on which a user can perform
different operation is a list. User can create or modify a list into which compounds can be inserted. There are also list operations available like append, merge or subtract. Content of the lists can be manipulated with various operations like delete, move, copy, etc. The database provides searching capabilities as well where the result of a search operation is a new list with the items filtered by the search.
The lists have a ‘‘type’’ property which depends on the purpose of the list the user intends to use it for. To simply store and organise the items a ‘‘User list’’ type is appropriate. When the user would like to prepare a list to be processed by certain algorithms on the Grid, the list with the selected items must be converted appropriately.
All grid-related calculation relates to a certain list. Before launching e.g. descriptor calculation for compounds stored in the database, the items must be organised into a list, should be converted to the appropriate type of list (the type is ‘‘list for descriptor calculation’’ in this case) and pass the list as an input to the selected grid calculation.
The results (e.g. conformers, descriptors) returned by the grid calculation are also uploaded into the database into the same list as was defined as input. The results then can be inspected by
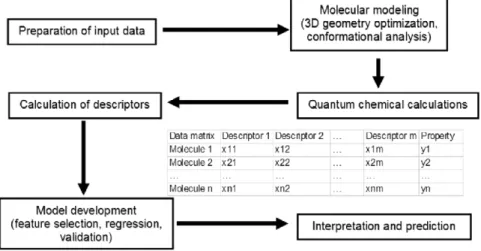
Fig. 3. Flow chart of a QSPR/QSAR analysis.
the user through a special user interface of the database, where visualisation of the structures is also integrated. Otherwise, results can be extracted and downloaded onto the user’s machine. 2.3. The CCS science gateway
The private DG system and molecule database described in Sections2.1and2.2would be enough to use the CancerGrid system based on the native user interface of SZDG and the molecule database. However, those interfaces would be too difficult for the target end-users who are not IT specialists rather biologists, chemists and medical doctors. Therefore, we created a science gateway that exposes those functionalities that are needed for the end-users and hide every other infrastructure detail. It facilitates the integrated usage of SZDG and the molecule database, too. The CCS science gateway will be explained in detail in Section4because understanding its functionalities requires the knowledge of the CCS applications that are described in Section3.
3. Workflows and tools for the QSAR/QSPR modelling process The CCS enables computationally intensive computational chemistry analyses, in particular, QSAR/QSPR. The recent devel-opments in the field of drug discovery have shown an increased application of QSAR models as virtual screening tools to discover biologically active compounds in chemical databases and/or vir-tual chemical libraries [3]. This section describes the methodology in general, tools integrated with CCS and their combination into workflows to address the main tasks in QSAR/QSPR modelling. 3.1. The QSAP/QSPR modelling process
The QSAR/QSPR model development process is considered well understood by the computational chemistry community. However, in practice it is still a rather complicated task since it requires solid understanding in various scientific disciplines and involves the combined application of multiple software programs [4]. The high-level process flow of QSPR/QSAR modelling is summarized in
Fig. 3. It involves cooperation between different software modules such as quantum–chemical calculations, molecular descriptor calculations, and QSAR/QSPR model development [5].
The first step in the QSAR/QSPR model development is the preparation of a relevant data set, which contains a list of chemical structures and associated property or activity values. The molecular modelling step generates the appropriate 3D representation(s) required by all quantum chemical and most molecular descriptor calculation programs [6]. The calculation of
the initial 3D coordinates from 2D coordinates or the equivalent connectivity information is performed by using standard bond lengths and hybridisation states of atoms.
The molecular modelling task will optionally involve computa-tionally intensive conformational search combined with molecular mechanics calculations. The need for conformational analysis is de-pendent on the flexibility of the compounds under study [7]. Most commonly, the lowest energy conformer is used for the QSPR/QSAR analysis. The semi-empirical or ab initio quantum chemical calculations are needed for the calculation of quantum chem-ical descriptors [8]. They expect guess molecular structures in 3D representation and require precise optimization of chemical structures in order to provide a correct description of structural characteristics. Some of the calculated characteristics of molecules are used directly as descriptors, while other output data will be used by the descriptor calculation module to calculate additional molecular descriptors. The next step involves the calculation of the molecular descriptors for which both 2D and 3D represen-tations can be directly used. Once the table with the values of dependent (property or activity) and independent (molecular de-scriptors) variables is prepared, the statistical methods can be applied for the development of the actual mathematical model. The model development process is usually iterative. A number of QSPR/QSAR models are also generated using several different methods and parameters. The results are compared, analysed and the most predictive models are then selected for future deploy-ment. The main assumption behind the QSPR/QSAR predictions is that the properties of a chemical compound are functions of its chemical structure
properties
=
f(
structure).
In order to apply QSPR/QSAR methodology, one must have knowledge about the functional relationship f or know how to approximate it, and a numerical representation of the chemical structure (descriptors).
A variety of statistical structure–property correlation tech-niques can be used for the analysis of experimental data in com-bination with the calculated molecular descriptors. The simplest of the functional relationships is the linear equation
y
=
−
i
aixi
+
b (1)where y is the predicted property, xi-s are the descriptor
val-ues andai and b are adjustable coefficients found by the
least-squares method. A rule of thumb is to use at least 5 times as many molecules in model development as independent variables (de-scriptors) in order to produce reliable results. When linear approx-imation is not valid, one may turn to nonlinear methods. The most
cesses of learning in the cognitive system and the neurological functions of the brain and are capable of predicting new observa-tions from other observaobserva-tions after executing a process of so-called learning from existing data. Many different types of neural network architectures have been developed over the decades with various ‘‘training’’ algorithms [9]. The goodness of the obtained QSPR/QSAR equations can be evaluated and compared by various statistical pa-rameters [10].
All predictive models require validation in order to determine their reliability. Several procedures exist to provide some estimate of how well the model can predict property for new molecules [11]. An important part of model development is the so-called feature selection — QSAR/QSPR models must be reduced to a set of descriptors which is as information rich but as small as possible. Often, models with too many variables lead to bad predictions because of overfitting. Several heuristic strategies are available for descriptor selection in the effective search of the best (most informative) multiparameter correlations in the large space of the natural descriptors.
3.2. Workflows and tools
The predefined workflows in CancerGrid address three main tasks in QSAR modelling: descriptor calculation, model develop-ment and property prediction.
3.2.1. Descriptor calculation
The calculation of descriptors in CancerGrid is carried out in a workflow, which involves multiple pre-processing steps. The con-former generation task is required for the calculation of various molecular descriptors that require 3D molecular geometry. In ad-dition, the semi-empirical quantum chemical calculation task is re-quired for the calculation of quantum-chemical descriptors. The quantum chemical calculation itself requires the 3D coordinates of a molecule on the input. For each input structure, the descriptor calculation workflow (seeFig. 4) produces one or more 3D struc-tures and their respective descriptor values. Conformer generation, quantum chemical calculations and descriptor calculations can be easily parallelized for large structure sets by running them over a grid of computing nodes.
Presently, the command line tool MDC based on the Codessa PRO [12] code has been integrated for the calculation of molecular descriptors. The CMol3D inhouse software has been integrated for the 2D to 3D conversion and conformer generation and the public domain program MOPAC 6 [8] has been integrated for the semi-empirical molecular descriptor calculation. All the software modules are available for both Windows and Linux platforms.
The CMol3D program has been developed for 2D to 3D conversion and conformational search. Random conformations are constructed by means of Stochastic Proximity Embedding
files as input, Mol files as output for 2D to 3D conversion, and structure-data (SD) files as output for conformational search.
MOPAC is a general-purpose semiempirical quantum mechan-ics package for the study of chemical properties and reactions in gas, solution or solid-state. To simplify MOPAC usage and grid in-tegration, a wrapper has been created that forms MOPAC input file from Mol file and deletes temporary files after the calculation is complete.
MDC reads file with a 3D geometry in the Mol format, option-ally the MOPAC output file for quantum chemical descriptor calcu-lation and the MOPAC output file for thermodynamic descriptor calculation, calculates the descriptors and saves their values as a text file. MDC supports Mol files and optionally Mopac output files as input and produces a single text file for each molecule con-taining tab separated descriptor name and value in each line. A helper tool for file conversion has also been implemented to sup-port file format conversions between different applications in the workflows.
3.2.2. Model development
Model development workflow (seeFig. 5) in the CancerGrid system begins with matrix forming step that is carried out with a special command line tool FMT. Model development is performed by the command line tool MDA. Both of these software modules are based on the code of Codessa PRO [12] and available for Windows and Linux platform.
The FMT command line tool has been developed for ma-trix forming, one-dimensional statistical analysis of descrip-tors/properties, elimination of variables based on their variance and missing data deletion or substitution. There are three types of input files for FMT containing descriptor values, property values and optional energy values for Boltzmann averaging, respectively. Missing data treatment in the matrix can be performed according to one of the following standard choices commonly used in prelim-inary data analysis for model development:
•
Descriptor-wise (column-wise) deletion.•
Structure-wise (row-wise) deletion.•
Substitution of missing value by the mean value of available values.•
Substitution of missing value by zero.In addition, descriptors with variances less than a predefined limit will be deleted from the matrix and one-dimensional statistical analysis of the property and descriptors is performed. When multiple values of the same descriptor are provided for a single compound as in the case of 3D descriptors calculated for multiple conformers, FMT saves the averaged or Boltzmann averaged descriptor values in the matrix.
MDA is a general command line tool for QSPR/QSAR model development that takes the matrix of descriptor and property values for the training set compounds as its input and produces one
Fig. 6. Workflow for property prediction.
or more models. Another use of MDA is property prediction given the model and descriptor values. The type of the model(s) and the algorithm by which they are developed depend on parameter settings. Currently supported model types include ordinary least squares, principal component (PCR) and partial least squares (PLS) regressions. For the ordinary least squares model type, the user can select between the single model development with all the descriptors in the matrix and best multilinear regression (BMLR) which is a heuristic strategy for descriptor selection in the effective search of the best (most informative) multiparameter correlations in the large descriptor space. MDA supports input matrices in the form of tab-separated text files and generated models are saved in a single model file with a custom XML based format.
3.2.3. Property prediction
Property prediction workflow (seeFig. 6) in the CancerGrid system is suitable for in silico screening of molecular databases or virtual libraries. It consists of the same descriptor calculation steps as in descriptor calculation workflow, forming one-row matrices for each compound using FMT and prediction of property values with MDA configured to run in the property prediction mode. The matrix forming step is configured similarly as in the previously described model building workflow except that it is run once for each compound without adding experimental property values to the matrix. MDA in the property prediction mode takes a model file and a matrix with descriptor values calculated for the given compound and outputs the predicted property value as a text file.
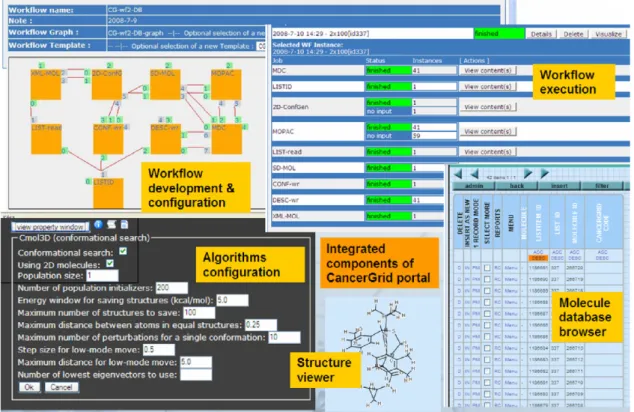
workflow development and execution environment for various grid systems including SZDG. It is deployed on a central server, where the SZDG server is also installed in order to coordinate the execution of the high number of jobs required by the CCS user. The CCS Science Gateway supports two main usage scenarios or views like browsing molecules and executing workflows (seeFig. 1).
The main goal of molecule browsing is to compose the set of molecules for which a certain workflow should be executed. For molecule browsing the user is provided with a user interface where the different chemical elements (molecules, compounds, properties, etc.) can be accessed. These elements are stored in the molecule database and organized into lists. The user can perform various activities on the lists, for example view, build, modify, etc. as described in Section2.2. The elements of the lists can also be inspected one by one if required. Different properties or even 2D or 3D visualization of the molecules can be displayed (see the structure viewer inFig. 7). When a molecule list is composed a predefined workflow can be assigned to it in order to perform a predefined calculation on its elements.
Each workflow is built by the combination of database read–write activities, data converters and chemical software tools. Typical workflow starts with a database read component which results in storing a file containing the molecules to be processed. Then a converter splits the file into as many pieces as many molecules are stored in it. The converted files – storing one molecule in each – are then usually processed by a chemical software tool. After a result returns conversion or different chemical software tools are performed again depending on the function of the workflow. Predefined chemical workflows are listed in Section3. For each such chemical workflow a WS-PGRADE
The jobs are generated and stored by the workflow interpreter of the gUSE high level grid middleware on the portal server. Then jobs are passed to the appropriate submitter based on the type of job. In the current configuration WS-PGRADE/gUSE handles three different job types:
•
short-running jobs: these jobs execute for only a short time (e.g. converters in the workflows), they are assigned to a dedicated local resource on the portal server since they run only for seconds.•
web-service calls: reading data from and writing data to the molecule database by the workflow are implemented by web-service calls.•
long-running jobs: these jobs (chemical software tools) are scheduled to be executed on the SZDG client machines. After submitting a workflow with a given molecule list the gUSE middleware takes care of executing the workflow, managing its files and utilization of the underlying desktop grid. The generated jobs – based on their types – are passed to the appropriate submitters. The submitter is a gUSE service dealing with a concrete resource or a grid middleware. In the CCS Science Gateway there are three submitters, each one configured for a certain type of job. Note, that WS-PGRADE portal is able to submit jobs to other grids (e.g. globus, gLite, Condor, etc.) if required.In the case of computation intensive algorithms, jobs are passed to the SZDG submitter that inserts them into the SZDG server through the 3G Bridge that is running on the SZDG server.
The SZDG server is the central component of the desktop grid storing and coordinating the completion of the workunits. A workunit (WU) represents one piece of work (application, arguments, input files) to be executed by an SZDG client, which poll the server from time to time for work based on user preferences and the server assigns the appropriate amount of work to the client. The client gets the description of a WU and downloads all the necessary (input) files, where executables are downloaded only once for an application referred by the WUs. The SZDG client takes care of scheduling the execution of the WUs on the desktop machine in a way to meet the deadlines of each downloaded WU. When the server detects that the deadline for a WU is missed, the server assigns the WU to another client for execution.
The application binary package also contains the GenWrapper tool [19] (part of the SZDG package), which is a shell interpreter in order to ease the porting of the application binary under SZDG and to enable multiple jobs to be inserted into one WU (if necessary) to increase granularity. GenWrapper executes a predefined shell script which defines things to perform and can invoke the application binary if needed. This is the way how legacy applications can also be executed on desktop grids, which otherwise requires communication with the application (e.g. querying the physical name of files, reporting progress, etc.).
echo "Associating FILE ID($SD_FILE_INDEX.$SINDEX) to OUTPUT INDEX($DINDEX)." tar zcvf "$OUTZIPPREFIX$DINDEX" "$SD_FILE_INDEX.$SINDEX.mol" SINDEX=‘expr $SINDEX + 1’ DINDEX=‘expr $DINDEX + 1’ done cp ${OUTZIPPREFIX}0 OUT-MOLZIP echo "->Output preparation finished."
When a workunit is successfully completed, the result is uploaded and reported to the SZDG server. When the 3G Bridge detects the completion, the result files are uploaded to the CCS science gateway and the workunits are removed from SZDG. Temporary files of the workflow are stored under the gUSE storage while final or permanent results are written back to the molecule database in order to let the user inspect them.
As a summary a typical usage scenario happens in the following way: A user first logs into the portal and goes to the molecule database browser. In that browser, lists of molecules are shown which can be manipulated by the user. When a list of molecules is prepared the user downloads a predefined workflow from the repository, assigns the molecule list to the workflow and configures the parameters of the various chemical tools. A configured workflow is then submitted and its status can be monitored. Results are inserted into the molecule database that can be inspected with the same molecule database browser.
5. Optimisation
Since the number of generated jobs scales over millions (where jobs executed in the grid can be a few hundreds of thousands at a time), the portal requires a grid that is able to handle large amounts of jobs. Based on our experiences, desktop type grids are more appropriate for a large number of parameter study applications and it is much easier to be built by a community, like chemists, than building a service grid (e.g. gLite) requiring IT specialists. Moreover, desktop grid systems having thousands of resources with millions of jobs scale much better on the number of clients and also on the number of jobs.
When having a large number of jobs to execute and a powerful desktop grid, the throughput of the scientific gateway becomes a significant factor. During the development the efficiency of the workflow interpreter, portal storage and the submitter (that delivers the jobs to the grid) was a crucial point. Technical details about the internal structure of the gUSE components are out of scope of this paper, but the lessons we learnt from the CCS is that the throughput is very sensitive to the strategy of handling this enormous number of jobs.
The performance of the current CCS has been inspected during the operation and the analyses show that it is able to dispatch a few million jobs per day including all the coordination
Fig. 8. Diagram created by the CCS monitor.
activities (dependence checking, scheduling, etc.), all preparation (e.g. staging i/o files) and submission for each job. The overall performance of our desktop grid system containing about 200 (dedicated and non-dedicated) cores as an initial setup was enough to reach this limit.
The SZDG monitor attached to CCS has been used to observe the working characteristics and load of the desktop grid client machines and the server itself. Fig. 8shows a snapshot of the SZDG monitor applied for the CCS. There are two measurements displayed on this diagram, where the horizontal axis shows a time scale while the vertical axis denotes the number of workunits. The first display that has a saw-like shape shows the sum of unsent plus in progress workunits i.e. the total number of workunits that are still to be processed by the desktop clients. The second measurement – which is almost equivalent with the horizontal axis – denotes the workunits being processed by the clients. This line shows the number of workunits during the time of computation for four big (
∼
110–130 K) molecule sets.On this diagram, the vertical scaling is automatic and linear, therefore the workunits being processed (
<
1 K) is shown as almost zero compared to the total number of workunits (∼
130 K).During fine tuning of the CCS, we discovered that the overall performance of the desktop grid clients attached to the CCS is sometimes significantly less than the aggregated performance of the individual clients. We have analyzed the system and it turned out that for different reasons under- or over-utilization occurs sometimes in the different scheduling components (gUSE, BOINC server, BOINC client) in the system.
In BOINC when the server runs out of workunits, the clients go to sleep, i.e. communication to the project is deferred, where deferment is exponentially larger with each failed attempt for workunit fetch, however the maximum deferment time is 24 h. When a chemist submits a workflow, it might happen that he/she will detect no progress at all for a long time due to the deferment period of the clients. To shorten the reaction (i.e. the deferment period) of the clients we used the ‘‘
⟨
next_rpc_delay⟩
X
⟨
/ next_rpc_delay⟩
’’ server side configuration parameter. This parameter tells the client to perform the next communication with the server within X seconds regardless of whether it needs work or not. Setting this parameter to e.g. between 60 and 180 s the desktop grid clients will react rapidly when a set of new workunit appears on the server after a long period of inactivity. (Notice that this type of problem typically does not appear in a volunteer BOINC project where there are always available workunits to be processed. However, in a private desktop grid this situation of lacking workunits can be quite frequent.) Since the communication of the clients are randomly initiated between the defined period, the operator must fine tune this parameter considering the size ofthe pool. The more clients are connected to the server, the more chance the server has for new work distribution therefore the bigger maximum deferment period can be allowed for the clients. Another aspect to be considered is how quickly the operator would like to achieve the maximum performance of the overall desktop grid. This is something theXvalue also defines implicitly i.e. this parameter makes sure that withinXs all clients will start processing the workunits.
In BOINC, generating a new workunit includes the definition of the computational requirement (in FLOPS) as well. In CCS there are several chemist type applications from which Cmol3d and Mopac can be parameterised to provide execution time between an extreme range (e.g. from 30 s to an hour). Since, the definition of the execution time cannot be automatically calculated based on the parameters, because there is no exact algorithm for it, we configured a fixed FLOP value representing about an hour-like calculation on an average PC.
Even under these circumstances, we experienced that some PCs download a huge number (
∼
n100) of workunits. The reason was that the desktop grid clients try to fetch an amount of work from the server which is enough even for a whole week, or so and the clients try to keep this amount of work on their side continuously. If some PC behaves like that, some other clients in the desktop grid became empty which slows down the progress of the corresponding workflow in the CCS portal. This is a load-balancing problem. To avoid the situation when some clients aggregate a big amount of workunits, we introduced a server side configuration parameter called⟨
max_wus_in_progress⟩
N
⟨
/max_wus_in_progress⟩
. Adding this parameter to the project configuration, the server does not allow the clients to download more than N pieces of workunits. In our system we set the N to values between 2 and 10, which solved the load-balancing problem. However, we experienced that decreasing this value caused an increase in the network traffic by 5%–10% approximately, due to more often communication by clients, but this traffic did not cause any problem in our configuration.The current CCS infrastructure is built by approximately 200 cores offered by the consortium members of the project. This grid is non-public in order to keep the various data and results confidential. The latest usage shows that the CCS science gateway is mostly used for descriptor calculation and virtual screening where the latter one is the combination of descriptor calculation and property prediction. During our measurements we estimated the processing power of the CCS to perform 100,000 compounds per day for screening. This amount of work would take more than half a year for a standard PC. Taking into account that the resources are heterogeneous concerning their performance, i.e., there are slow, medium speed and fast PCs attached, the performance is very
Altogether, we found that the overall efficiency of the desktop grid is very close to a cluster and the bigger amount of workunits we process the smaller difference in efficiency they have. A detailed comparison of BOINC and Condor can be found in [1].
As a summary we can say that due to the introduction of the new BOINC configuration parameters ‘‘next_rpc_delay’’ and ‘‘max_wus_in_progress’’ we were able to make the whole private BOINC system react nearly as quickly as a managed cluster. The advantage of the private BOINC desktop grid compared to the managed cluster is that the BOINC system is much less expensive in terms of investment and maintenance costs. Moreover, with this fine tuning, the BOINC system was able to significantly decrease the impact of the well-known tail effect (when a small portion e.g. 10% of a set of submitted workunits is delayed by time comparable to the time required to finish the rest e.g. 90% of workunits). Based on our experiences we can say that tail effect turns only up when there are a number of workunits having faulty molecules as input and the retry function generates the tail effect as it can be seen at the end of the third execution plot inFig. 8. Interested readers can find more useful parameters (including the ones mentioned above) for fine tuning BOINC projects on the BOINC Wiki page [20].
6. Related work
Khadka et al. [21] developed a cyber infrastructure that provides an easy-to-use online web portal to VENUS, a popular chemical dynamics simulation program package, to allow people to submit simulation jobs that will be executed computational resources constituting a grid environment. One of the interesting features of the portal is to provide animation of the results for chemical dynamics simulation which can be seen without the need of any additional tool to be installed on the users’ machine. This work and the paper itself focuses on the internals of the web portal, therefore the cluster or grid itself are not detailed.
The ProSim [22] (Protein Molecule Simulation on the Grid) project has successfully created a grid based parameter sweep workflow using the WS P-GRADE portal. The workflow realises a complex user scenario. Firstly, the receptor protein and the glycan are modelled separately and energy minimised with the help of the Gromacs molecular dynamics software. In phase 3, the putative active binding sites involved in the recognition need to be identified using a docking simulation software, such as AutoDock. Finally, molecular dynamics simulations are applied again to dissect the mechanism of recognition (phase 4). This system shows another utilisation of the WS-PGRADE portal on top of the UK NGS and EGEE grids.
The OpenMolGrid [23] system has a similar goal as the CancerGrid system by providing workflow creation and execution on a grid system performing various chemical computations. Both
user interfaces. The system supports molecular modelling, pro-tein–ligand docking and a high-throughput workflow infrastruc-ture for computational chemistry. Nimrod also supports parameter sweep applications and databases similarly to CancerGrid, how-ever the underlying grid middleware is Globus. Workflow exe-cution is not supported by Nimrod itself, but Nimrod has been plugged into various workflow systems like Kepler [26] as a job executor.
Basically, there are two wide-spread approaches can be distin-guished: the first is to provide a scientist-friendly environment where the computation is mainly performed on gLite, Globus, Uni-core or other service grids. These systems listed above are comfort-able for the users, but are weak when related to scalabilities. The other approach is to create a public BOINC project to handle thou-sands or millions of volunteer resources, but is weak related to the user interface for scientific users (and not for those who contribute with resources), who would like to create, deploy and execute their tasks or workflows and would like high-level handling or visuali-sation of their data. The infrastructure behind CancerGrid system combines these two approaches in a way that beyond customisable high-level interface for the scientists it lean on BOINC which han-dles the volunteer resources. However, the CancerGrid system as an example introduces an institutional (non-public) BOINC project as the underlying Grid, which means resources can be considered as trustable ones. An extension towards including non-trustable resources would not cause any problem for BOINC and the Can-cerGrid system.
7. Conclusion
Chemistry is one of the scientific fields which can utilise huge amounts of computational resources by performing various kinds of chemical computations on molecules. The aim of the CCS infrastructure was to serve the chemists in the CancerGrid project with computational resources – for processing their molecules – together with an easy-to-use, high-level web-based scientific gateway.
In the CCS scientific gateway we integrated a database for handling chemical components with browsing, visualisation and manipulation functionalities. In order to perform various com-plex computations on these chemical components, we developed chemist workflows like descriptor calculations, property predic-tion, etc. These predefined workflows can be instantiated from a repository, parameterised, submitted for processing and inspected through the various views of the CCS scientific gateway.
In the CCS infrastructure the processing is performed by a private desktop grid with 200 cores. The desktop grid is based on BOINC and it is fine tuned through server side configuration parameters in a way to make it as similar as possible to a cluster in terms of performance, efficiency and reaction time. CCS is one
actively used by the CancerGrid consortium to help the expert chemists finding new anti-cancer related drugs. A public report about the work performed by the CancerGrid consortium can be found in [27]. CCS is continuously improved based on the users’ feedbacks.
The CCS has some advantages compared to other similar solutions like it is scalable, easily maintainable, it can provide extremely huge computing power, it can be private or public and can be tailored to the needs of any community. By changing the set of workflows, applications underneath and input sources, the CCS infrastructure could easily serve communities from any other scientific areas.
Acknowledgements
The research and development published in this paper is supported by the European Commission under contract numbers LSHC-CT-2006-037559 (FP6 STREP, CancerGrid).
References
[1] Peter Kacsuk, Jozsef Kovacs, Zoltan Farkas, Attila Csaba Marosi, Gabor Gombas, Zoltan Balaton, SZTAKI desktop grid (SZDG): a flexible and scalable desktop grid system, J. Grid Comput. 7 (4) (2009) 439–461.
[2] Z. Farkas, P. Kacsuk, Z. Balaton, G. Gombas, Interoperability of BOINC and EGEE, Future Gener. Comput. Syst. (ISSN: 0167-739X) 26 (8) (2010) 1092–1103. doi:10.1016/j.future.2010.05.009.
[3] A. Tropsha, A. Golbraikh, Predictive QSAR modeling workflow, model applicability domains, and virtual screening, Curr. Pharm. Des. 13 (2007) 3494–3504.
[4] M. Karelson, Molecular Descriptors in QSAR/QSPR, John Wiley & Sons, Inc., New York, USA, 2000.
[5] A.R. Katritzky, V.S. Lobanov, M. Karelson, QSPR: the correlation and quantitative prediction of chemical and physical properties from structure, Chem. Soc. Revs. 24 (1995) 279–287.
[6] A.R. Katritzky, D.C. Fara, R. Petrukhin, D.B. Tatham, U. Maran, A. Lomaka, M. Karelson, The present utility and future potential for medicinal chemistry of QSAR/QSPR with whole molecule descriptors, Curr. Top. Med. Chem. 2 (2002) 1333–1356.
[7] A.R. Leach, Molecular Modelling, Addison Wesley, 1997.
[8] J.J.P. Stewart, Semiempirical molecular orbital methods, In Rev. Comput. Chem. 1 (1990) 45–81.
[9] G. Schneider, P. Wrede, Artificial neural networks for computer-based molecular design, Prog. Biophys. Mol. Biol. 70 (1998) 175–222.
[10] N.R. Draper, H. Smith, Applied Regression Analysis, Wiley, New York, 1966. [11] D.J. Livingstone, Data Analysis for Chemists: Applications to QSAR and
Chemical Product Design, Oxford University Press, Oxford, 1995. [12]http://www.codessa-pro.com/.
[13] H. Xu, D. Izrailev, D.K. Agrafiotis, Conformational sampling by self-organization, J. Chem. Inf. Comput. Sci. 43 (2003) 1186–1191.
[14] T.A. Halgren, MMFF VI. MMFF94s option for energy minimization studies, J. Comput. Chem. 20 (1999) 720–729.
[15] I. Kolossvary, W.C. Guida, Low mode search. An efficient, automated computational method for conformational analysis: application to cyclic and acyclic alkanes and cyclic peptides, J. Am. Chem. Soc. 118 (1996) 5011–5019. [16] G. Chang, W.C. Guida, W.C. Still, An internal coordinate Monte Carlo method
for searching conformational space, J. Am. Chem. Soc. (1989) 4379. [17] R.H. Leary, Global optimization on funneling landscapes, J. Global Optim. 18
(2000) 367–383.
[18] H. Goto, E. Osawa, An efficient algorithm for searching low-energy conformers of cyclic and acyclic molecules, J. Chem. Soc. Perkin Trans. 2 (1993) 187–198.
(2008) 10–15.
[22] Hans Heindl, Tamas Kiss, Gabor Terstyanszky, Noam Weingarten, Babak Afrough, Pamela Greenwell, ProSim: development of a user-friendly molecular modelling package, in: Martin G. Hicks, Carsten Kettner (Eds.), Proceedings of the International Beilstein Symposium on Glyco-Bioinformatics: Bits ‘n’ Bytes of Sugars, October 4th–8th, 2009, Potsdam, Germany, Beilstein-Institut zur Forderung der Chemischen Wissenschaften, ISBN: 9783832527198, 2010, pp. 61–85.
[23] Uko Maran, Sulev Sild, Iiris Kahn, Kalev Takkis, Mining of the chemical information in GRID environment, Future Gener. Comput. Syst. 23 (1) (2007) 76–83.doi:10.1016/j.future.2006.04.018. ISSN 0167-739X.
[24] N. Jacq, et al., Grid-enabled virtual Screening against malaria, Journal of Grid Computing 6 (1) (2007)doi:10.1007/s10723-007-9085-5. 29-432008, Springer Netherlands.
[25] W. Sudholt, K.K. Baldridge, D. Abramson, C. Enticott, S. Garic, C. Kondric, D. Nguyen, Application of grid computing to parameter sweeps and optimizations in molecular modeling, Future Gener. Comput. Syst. 21 (1) (2005) 27–35.doi:10.1016/j.future.2004.09.010. Jan. 2005.
[26]http://Kepler.ecoinformatics.org/,http://www.Kepler-project.org/. [27] Attila Udvardi, László Skultéty, Accelerating cancer research with the help
of biotechnology: the case of CancerGrid (public report of the CancerGrid project),http://www.gki.hu/docs/gki_cancergrid.pdf.
József Kovácswas born in 1975 in Budapest, Hungary. He is a Senior Research Fellow at the Laboratory of Parallel and Distributed Systems (LPDS) at the Computer and Automation Research Institute of the Hungarian Academy of Sciences. He got his B.Sc. (1997), M.Sc. (2001) and Ph.D. (2008). In the meanwhile he was continuously involved in numerous national, international and European (Esprit, FP5, FP6, FP7) research projects. From 2002 he was doing research on the field of parallel checkpointing techniques in grids and later on in the field of DesktopGrid computing. From 2006 he is the leader of the DesktopGrid team of LPDS. He is the author and co-author of more than 40 scientific papers.
Peter Kacsukis the Head of the Laboratory of Parallel and Distributed Systems in MTA SZTAKI Computer and Automation Research Institute of the Hungarian Academy of Sciences. He received his M.Sc. and university doctorate degrees from the Technical University of Budapest in 1976 and 1984, respectively. He received the kandidat degree (equivalent to Ph.D.) from the Hungarian Academy in 1989. He habilitated at the University of Vienna in 1997. He received his professor title from the Hungarian President in 1999 and the Doctor of Academy degree (D.Sc.) from the Hungarian Academy of Sciences in 2001. He has been a part-time full professor at the Cavendish School of Computer Science of the University of Westminster and the Eötvös Lóránd University of Science Budapest since 2001. He has published two books, two lecture notes and more than 200 scientific papers on parallel computer architectures, parallel software engineering and Grid computing. He is co-editor-in-chief of the Journal of Grid Computing published by Springer
Andre Lomaka (born in 1975) is a Senior Research Scientist at Tallinn University of Technology. He received his Ph.D. on molecular design at the University of Tartu, Estonia, in 2003. His research has dealt with QSAR/QSPR and the development of the respective computer software.