A System for Dynamic Server Allocation in Application Server Clusters
A.P. Chester, J.W.J. Xue, L. He, S.A. Jarvis,
High Performance Systems Group,
Department of Computer Science,
University of Warwick, Coventry, CV4 7AL, UK.
{
apc, xuewj2, liganghe, saj
}
@dcs.warwick.ac.uk
Abstract
Application server clusters are often used to service high-throughput web applications. In order to host more than a single application, an organization will usually pro-cure a separate cluster for each application. Over time the utilization of the clusters will vary, leading to variation in the response times experienced by users of the applications. Techniques that statically assign servers to each appli-cation prevent the system from adapting to changes in the workload, and are thus susceptible to providing unaccept-able levels of service. This paper investigates a system for allocating server resources to applications dynamically, thus allowing applications to automatically adapt to vari-able workloads. Such a scheme requires meticulous sys-tem monitoring, a method for switching application servers between server pools and a means of calculating when a server switch should be made (balancing switching cost against perceived benefits).
Experimentation is performed using such a switching system on a Web application testbed hosting two applica-tions across eight application servers. The testbed is used to compare several theoretically derived switching poli-cies under a variety of workloads. Recommendations are made as to the suitability of different policies under differ-ent workload conditions.
1. Introduction
Large e-business and e-commerce infrastructures often require multiple applications and systems. For each of these applications a separate resource must be allocated. The al-location of resources is normally conducted at the design phase of a project, through the process of capacity plan-ning. In planning for the capacity of a system it is important to have a minimal QoS, which should represent the lowest level of acceptable service for the system. A system archi-tecture is then developed to enable the application to
sup-port the QoS requirements.
It is possible to consider such an environment as a set of servers which is manually partitioned into clusters, with each cluster dedicated to serving requests for a specific ap-plication.
Internet services are subject to enormous variation in demand, which in an extreme case can lead to overload-ing. During overload conditions, the service’s response time may grow to an unacceptable level, and exhausting the re-sources in this way may cause the service to behave errat-ically or even crash [18]. Due to the huge variation in de-mand, it is difficult to predict the workload level at a certain point in time. Thus, allocating a fixed number of servers is insufficient for one application when the workload level is high, whereas it is wasted resource for the remaining appli-cations while the workload is light. Therefore, it is desirable that a hosting centre switch servers between applications to deal with workload variation over time.
Initial research in the area of dynamic server allocation has proven to be mostly theoretical, with results being pro-vided through simulation [14]. The motivation for this work is to examine the potential for dynamic server allocation in real-world application hosting environments.
The specific contributions of this paper are:
• To report on the development of a real-world testbed for evaluating techniques for dynamically allocating servers to applications;
• To implement three server switching policies which
have been theoretically derived;
• To evaluate the three implemented policies within a practical setting under a variety of workloads, and re-port on the pros and cons of each.
The remainder of this paper is organized as follows: Sec-tion 2 reports on related work, describing the applicaSec-tion environments and theoretically derived switching policies. Section 3 gives an overview of the system architecture and describes the performance characteristics of an application
server. Section 4 describes the process of switching servers between applications. Section 5 provides details of the ex-perimental parameters. Section 6 demonstrates the results obtained from the system. In section 7 we draw our conclu-sions from the results and describe the further work that we will be undertaking based on our findings.
2 Related Work
Performance optimization for single application server architectures have been extensively studied [4, 5, 7, 8, 10, 11, 13, 17, 18]. [4, 8, 13] focus on request scheduling strategies for performance optimization. In [11], the authors use priority queues to offer differentiated services to differ-ent classes of request to optimize company revenue. They assign different priorities to different requests based on their importance. [10] studies the methods for maximising prof-its of the best-effort requests and the QoS-demanding re-quests in a web farm, however, they assume a static work-load arrival rate in the paper. Work in [7, 17] uses pro-visioning techniques to achieve Service Level Agreements (SLA). This research uses analytical models to explore sys-tem capacity and allocate resources in response to work-load changes to obtain guaranteed performance. Other work in [5, 18] uses admission control schemes to deal with over-loading and achieve acceptable performance metrics. [5] uses session-based admission control to avoid loss of long sessions in web applications and guarantee QoS of all re-quests, independent of a session length. [18] presents a set of techniques for managing overloading in complex, dy-namic Internet services and is evaluated using a complex web-based email service. The work in this paper focus on the scenario where multiple applications are running simul-taneously in an Internet hosting centre.
Recent work [9, 12] also studies performance optimiza-tion for multiple applicaoptimiza-tions in Internet service hosting centres, where servers are partitioned into several logical pools and each logical pool serves a specific application. They address the server switching issue by allowing servers to be switched between pools dynamically. [12, 14] con-sider different holding costs for different classes of requests, and try to mininise the total cost by solving a dynamic pro-gramming equation. The authors in [9] define a revenue function and use M/M/m queues to derive performance met-rics in both pools and try to maximise the total revenue.
The work in this paper is different from [9, 12, 14] in the following respects: an actual testbed is used in our eval-uations, and thus (i) the application is not synthetic, (ii) the supporting infrastructure demonstrates the subtleties of a real-world platform, and (iii) the switching policies are implemented, feed actual system parameters, and are sub-sequently evaluated on a real workload.
3 System Overview
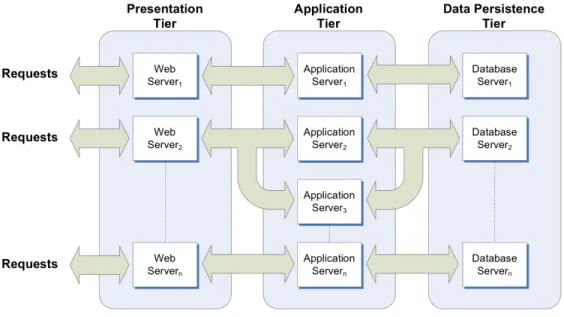
In this paper we consider an environment consisting of multiple applications which is deployed across a set of servers. Each of the applications considered has an iden-tical system architecture. Modern Web application infras-tructures are based around clustered, multi-tiered architec-tures. Figure 1 shows multiple hosted Web applications based upon the “best possible” architecture as described in [16].
The first tier in the architecture is thepresentation tier. This comprises the client-facing web servers that are used to host static content and route requests to an available appli-cation server. Theapplication tier is comprised of a static allocation of application servers which process dynamic re-quests from the clients, using the data persistence tier as ap-propriate. Thedata persistence tieris normally comprised of a Relational DataBase Management System (RDBMS) or a legacy system which is used for the purpose of perma-nent data storage.
In the case of a single application it is common for the presentation tier to schedule tasks across a dedicated cluster of application server machines. Strategies for re-quest scheduling in both commercial and open-source prod-ucts are generally variations on the Weighted Round Robin (WRR) strategy. The WRR approach allows for different proportions of requests to be dispatched to different appli-cation servers and, in so doing, allows some degree of sup-port for heterogeneous server environments by allocating a higher proportion of the workload to application servers with more capacity.
Applications that require a state to be maintained throughout a user session present a significant problem for WRR strategies, as multiple requests may not be redirected to the same server. To this end several strategies have been developed to handle this scenario. Session affinityensures that subsequent requests are all processed by the same appli-cation server, thus ensuring that state is maintained through-out a user session. Drawbacks to this approach are dis-cussed in [8] and include severe load imbalances across the application cluster due to the unknown duration of a request at the time of dispatching it to the application server, and a lack of session failover due to the single application server providing a single point of failure to the session. It is also possible for the client to store the state of the session, re-submitting it with each request. Using this approach any available application server is able to process the user’s re-quest. Similarly the data persistence tier may be used to store session data which also enables all application servers to service all requests, however this comes at the expense of increased database server/cluster utilization. These ap-proaches are evaluated in [3]. In this paper user session data is stored on the application server that processes the initial request. Further requests are then forwarded to the
same server for processing.
The multiple application environment we consider is captured by figure 1. The diagram represents the architec-ture fornseparate applications. The main difference from
the single application architecture is the conceptual view of the setof application servers. In our multiple application environment any of the servers available may be allocated to any of the applications either statically or dynamically. In this paper we are concerned with the allocation of servers at the application tier. Each application requires a dedicated presentation and data persistence tier.
3.1 Server Performance
In [6] it is demonstrated that the throughput of an appli-cation server is linked to the number of concurrent users. While a system is under a light load with few concurrent users, the throughput of the server can increase in a near linear fashion as there is little contention for resources. As the number of concurrent users increases, the contention for system resources increases, which in turn causes the rise in throughput to decrease. The point at which the addition of further clients does not result in an increase in throughput is the saturation point,Tmax.
From this it would follow that for a cluster ofn
appli-cation servers, the maximum theoretical throughput of the cluster would beΣTmaxfor a heterogeneous cluster. This
may be simplified to nTmax for a cluster of homogenous
servers. These theoretical throughputs are rarely achieved in practice due to the additional overheads of scheduling and redirecting requests across the cluster.
4 Server Switching
If we consider that each application hosted across the set of servers provides a service to the business (depending on the SLAs), some of the hosted applications are more im-portant than others in terms of revenue contribution to the service provider.
Most Internet applications are subject to enormous vari-ations in workload demand. During a special event, the vis-its to some on-line news applications will increase dramati-cally, the ratio of peak load over light load can therefore be considerable. System overloading can cause exceptionally long response times for requests or even errors, caused by the timing out of client requests and connections dropped by the overloaded application. At the same time, the through-put of the system would decrease significantly [6].
Therefore, it is desirable to switch servers from a lightly loaded application to a higher loaded application in re-sponse to workload change. In such cases, it is important to balance the benefits of moving a server to an applica-tion against the negative effects on the reduced pool and the switching cost.
The mechanism for switching servers, and the costs of the switch are discussed in section 4.1. The switching poli-cies implemented within this paper are given in section 4.2.
4.1 The Switching Process
Several different scenarios for server switching are pre-sented in the literature [9, 14]. In [9] it is proposed that the set of servers are shared amongst a single application, which is partitioned according to different levels of QoS. In this case, the simplest approach to reallocating a server would be remove it from an entry point serving one request stream, and add it to the entry point for the assigned pool. This negates the need to undeploy and redeploy the applica-tion, which provides a considerable reduction in switching cost. The switching process for this scenario is given in al-gorithm 1.
Algorithm 1 Switching algorithm for single application QoS requirements
1: forApplicationAi, in applicationsA1..ndo
2: LetSibe servers required forAi
3: LetASibe an application server belonging toAi
4: LetWibe a Web Server belonging toAi
5: whileSi!=0do
6: ifSi>0then
7: forAminAi+1...n do
8: ifSm<0then
9: StopWmdispatching requests toASi
10: Wait for pending requests to complete 11: Switch server fromAmtoAi
12: AllowWito dispatch requests toASi
13: end if 14: end for 15: else
16: forAminAi+1...n do
17: ifSm>0then
18: StopWidispatching requests toASi
19: Wait for pending requests to complete
20: Switch server fromAitoAm
21: AllowWmto dispatch requests toASi
22: end if 23: end for 24: end if 25: end while 26: end for
There is a cost associated with switching a server from one application to another. The cost of a switch is derived from the duration of the switch, and can be considered as the degradation of the throughput in the environment whilst a server is unable to service requests for any application as it switches.
Figure 1. Multiple application architecture.
4.2 Switching Policies
A switching policy is defined as an algorithm that when provided information on the current state of the system makes a decision on moving to another state. When doing this the policy must analyze the potential improvement in QoS against the cost of performing the server switch. There are several examples of switching policies in the literature [9, 14]. Some of these policies are executed as a result of each arrival or departure of a request; while others are ex-ecuted after a fixed time period and use statistics gathered over a time window to inform the switching decision. A policy may also consider request arrivals as beingonoroff, which is dictated by any arrivals in a given time period. The work presented in [14] describes four possible switching policies, three of which are implemented in this paper:
• The Average Flow Heuristicuses information on the arrival and completion rates of requests for each ap-plication in order to make a switching decision. This heuristic averages arrivals over the duration of the ex-periment and does not consider the distinct on/off pe-riods for each application. Doing this requires that a weighted average arrival rate is calculated; this is shown in algorithm 2. Algorithm 4 is then used with the calculated average arrival rates.
• TheOn/Off Heuristicattempts to consider the “bursty” nature of requests to each application. To do this it classifies each application’s requests as being on or off,
Algorithm 2Calculating the reduced arrival rate for the Av-erage Flow Heuristic
Input: Arrival rateλ
Job stream on ratem
Job stream off raten
Output: Average arrival rateλ!
return λ×m m+n
and switches servers accordingly. To account for the on and off periods in the job streams, the arrival rate is calculated as in algorithm 3; algorithm 4 is then used to calculate a new server allocation.
Algorithm 3 Calculating the arrival rate for the On/Off Heuristic
Input: Arrival rateλ
Job stream on periodm
Output: New Arrival rateλ!
ifm=truethen
return λ
else return 0 end if
• The Window Heuristicuses statistics gathered over a sliding window of time to calculate arrival and com-pletion rates for each application within a time win-dow. In so doing, the policy ignores the presence of
any off periods in the time window. This algorithm is shown in algorithm 6.
Algorithm 4Server Allocation Algorithm Input: Current server allocationS1, S2
Arrival Rates,λ1, λ2 Completion Rates,µ1, µ2 Queue Lengthsq1, q2 Switches in progressw1,2, w2,1 Switch Rater1,2, r2,1 Job costsc1, c2 Switch costssc1,2, sc2,1
Output: New server allocation,S!
1, S2!
1: Lettc1, tc2be total costs for each job queue
2: tc1, tc2←0
3: Letbdcbe best decision cost 4: bdc← ∞
5: ifµ1= 0andµ2= 0then
6: return error 7: end if 8: forsinS1do
9: tc1 ← Call Algorithm 5 with parameters
s, S, λ1, µ1, w2,1, r2,1, q1
10: tc2 ← Call Algorithm 5 with parameters
s, S, λ2, µ2, w1,2, r1,2, q2 11: if(c1×tc1+c2×tc2+sc1,2×s)< bdcthen 12: S! 1← −s 13: S! 2←s 14: end if 15: end for 16: forsinS2do
17: tc1 ← Call Algorithm 5 with parameters
s, S, λ1, µ1, w2,1, r2,1, q1
18: tc2 ← Call Algorithm 5 with parameters
s, S, λ2, µ2, w1,2, r1,2, q2 19: if(c1×tc1+c2×tc2+sc2,1×s)< bdcthen 20: S!1←s 21: S! 2← −s 22: end if 23: end for 24: return S! 1, S2!
5 Experimental Platform
In this paper we present our investigations into the single application with multiple QoS requirements, as found in [9]. Our experimental platform is based on the architecture shown in figure 1. In the presentation tier we use a cus-tom Web server to dispatch requests onto the application servers via round robin scheduling. The glassfish J2EE ap-plication server running on a Java 1.6 JVM was selected for
Algorithm 5Total Cost Algorithm Input: Switched serverss
Server AllocationS Arrival rateλ Completion rateµ Switches in Progresswm,n Switch raterm,n Queue Lengthq
Output: Total Cost,tc 1: ifq >0then
2: ifλ <S −s+wm,n×µ1then
3: Letstbe an array of sizewm,n+ 1
4: foriinwm,ndo
5: sti← (wm,n−1i)×rm,n
6: end for 7: stwm,n← ∞ 8: tc1= 0
9: Letvqbe the virtual queue length
10: vq←q
11: forjinwm,n+ 1do
12: ifvq >0then
13: Letxbe the rate at which the queue drains 14: x←vq+ (λ−(S−s+j)×µ)×stj 15: ifx≥0then 16: tc←tc+ 0.5×(vq+x)×stj 17: vq ←x 18: else 19: tc←tc+ 0.5×λ−(S−s−+vqj)×µ×vq 20: vq ←0 21: end if 22: end if 23: end for 24: else 25: tc← ∞ 26: end if 27: else 28: tc←0 29: end if 30: return tc
the application runtime environment. The application server was tuned in accordance with the manufacturer’s published guidelines to improve performance [15]. For the data per-sistence tier the Oracle 10g relational database system was chosen, which is representative of production systems that one might find in the field.
The hardware for the Web servers consists of two dual Intel Xeon 2.0GHz servers with 2GB of RAM. For the application servers, a server pool of eight homogeneous servers is used. The servers all use dual Intel Xeon 2.0 GHz processors and had 2GB RAM installed. They are con-nected via a 100 Mbps ethernet network. The web servers
Algorithm 6Window Policy Algorithm Input: Current server allocationS1, S2;
Arrival Rates,λ1, λ2
Completion Rates,µ1, µ2
Job costs,c1, c2
Output: New server allocation,S!
1, S2!
1: Letbdcbe best decision cost 2: bdc← ∞ 3: n1= (s1+c1s,c2)2×c1 4: n2= (s1+s2)−n1 5: foriinS1+S2do 6: ρ1= i×λµ11 7: ρ2= (S1+Sλ2−2i)×µ2 8: ifρ1<1andρ2<1then
9: Letcbe cost of the switch
10: c= c1×ρ1 1−ρ1 + c2×ρ2 1−ρ2 11: ifc < bdcthen 12: bdc←c 13: n1=i 14: n2= (S1+S2)−i 15: end if 16: end if 17: end for 18: S1! =n1−S1 19: S! 2=n2−S2 20: return S! 1, S2!
for each application were comprised of the same hardware. The database servers were all configured as dual Intel Xeon 3.0Ghz CPU servers with 2GB RAM and were connected to the network via a gigabit ethernet connection.
The application used for the testing of the system was Daytrader [2], an open-source version of IBM’s perfor-mance benchmark Trade. This application was chosen as it is representative of a high throughput Web application. The work presented in [1] suggests adopting an exponential distribution with a mean of seven seconds as a reasonable “think time” for the trade application.
To generate dynamic workloads a custom load genera-tion system was developed. This allows specified load to be generated for predetermined durations, which allowed us to monitor the reaction of the switching system under repeatable changes in workload. We used three workloads for our experiments. The first workload (shown in table 1) remained static throughout the entire duration of the experi-ment. This workload consisted of 1075 simultaneous client sessions, 875 for a1 and 200 for a2. The second
work-load consisted of one thousand client sessions, which were initially divided between the applications and were altered during the execution of the experiment. This allowed us to observe the reaction of each policy under a consistent
environment. This workload is shown in table 2. The fi-nal workload was the most dynamic, changing every 20 seconds, which caused the workload to switch within the switching interval. This workload is shown in table 3. Un-der this workload there are 1250 client session distributed across the applications.
To host the switching system, an additional node was added to the architecture in figure 1. This was done to en-sure that the additional overheads of the system were not added to any of the existing system components.
Although the time taken to switch a server varies, and is in part dependent on the queue of pending requests allocated to the server, we have found that the average time taken to switch a server between pools is approximately 4 seconds1.
Theswitching intervalis the time between executions of the switching policy. In this experiment the switching inter-val selected was thirty seconds, as this allowed a complete switch of all servers from one pool to the other, if such be-havior was required by any of the switching policies.
In the experiments we configure the two applications with different costs to represent the differences in QoS re-quirements. Thejob costsfor our experiments are consid-ered to be the costs for holding a job. Such a definition allows a value to be attached to a queue of waiting jobs. For our experimentsa1has a holding cost 25% higher than that ofa2, making jobs fora1a higher priority thana2as they are more expensive to hold.
6 Results
The overhead of the system is measured by calculating the maximum throughput of a single server directly, and then measuring the maximum throughput of the server re-quests that are forwarded from the Web server. We measure the throughput for each case at a variety of loads as shown in figure 2. It can be observed that the throughput for the system is significantly higher than that of the direct connec-tions. The throughput curves for both connection types fit closely with the typical performance curves seen in [6].
The response time for the direct requests increases dra-matically after 100 clients, while the response time for the redirected requests remains constant. The authors believe that this is due to connections between two fixed points (the Web server and the application server) being cached at the Web server, reducing startup costs for each connection.
6.1 Experiment One
In this experiment the workload is fixed for each appli-cation for the duration of the experiment. The load on each application is shown in table 1.
1The range of switching times obtained throughout the experiments
Table 1. Workload one Timestep
T1 T2 T3 T4 T5 T6 T7 T8
Duration (mins) 1 1 1 1 1 1 1 1
Clients Application 1 (Application 2 (a1) 875 875 875 875 875 875 875 875
a2) 200 200 200 200 200 200 200 200
Table 2. Workload two Timestep
T1 T2 T3 T4 T5 T6 T7 T8
Duration (mins) 1 1 1 1 1 1 1 1
Clients Application 1 (Application 2 (a1) 800 800 600 600 400 400 200 200
a2) 200 200 400 400 600 600 800 800
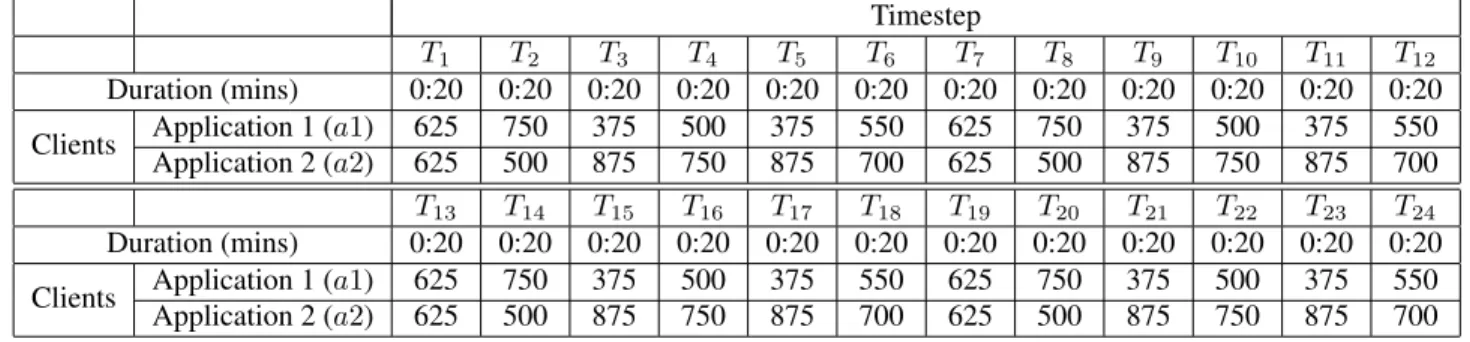
Table 3. Workload three Timestep
T1 T2 T3 T4 T5 T6 T7 T8 T9 T10 T11 T12
Duration (mins) 0:20 0:20 0:20 0:20 0:20 0:20 0:20 0:20 0:20 0:20 0:20 0:20 Clients Application 1 (Application 2 (a1) 625 750 375 500 375 550 625 750 375 500 375 550
a2) 625 500 875 750 875 700 625 500 875 750 875 700
T13 T14 T15 T16 T17 T18 T19 T20 T21 T22 T23 T24
Duration (mins) 0:20 0:20 0:20 0:20 0:20 0:20 0:20 0:20 0:20 0:20 0:20 0:20 Clients Application 1 (Application 2 (a1) 625 750 375 500 375 550 625 750 375 500 375 550
a2) 625 500 875 750 875 700 625 500 875 750 875 700
The baseline for this experiment is provided by using a static allocation of four servers to each application, and measuring the response times under the prescribed work-load. The response times for the static allocation are shown in figure 3. The additional load upona1 results in higher
response times as the servers are more heavily loaded than the servers fora2.
The initial response times are significantly higher than the latter ones. This is due to the optimization of the ap-plication within the apap-plication server, as the Java virtual machine optimizes frequently used components. The ap-plication server also acts dynamically to improve perfor-mance by increasing the number of database connections as required in order to service more requests. In this paper the application is the same for both pools, so the servers are optimized when they are switched between the pools. As a result we use the first minute as a warm-up period for the servers, and do not used the values in our calculations.
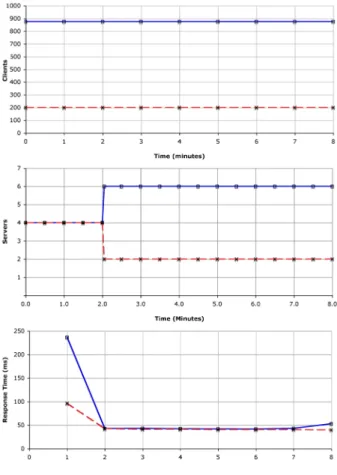
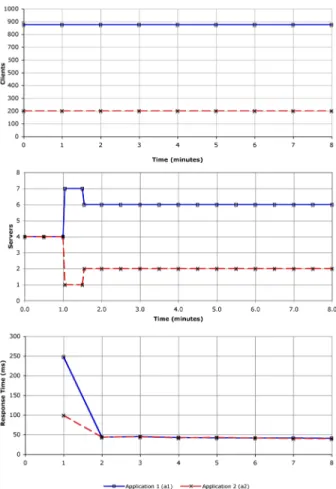
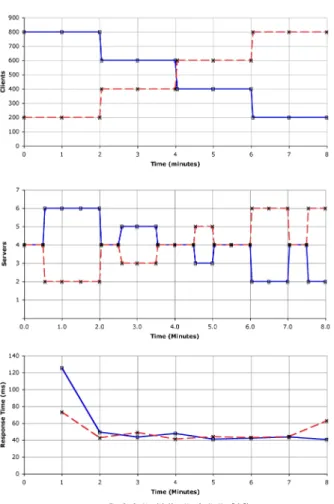
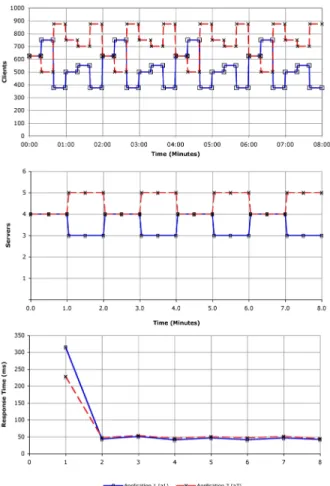
After finding a baseline form the static allocation, each to the three policies were tested against the workload. The results for the three policies for this workload are given in figures 4, 5 and 6. The figures are set out as follows: the top graph represents the workload for each application. The
middle graph shows the server allocation throughout the ex-periment, and the bottom graph shows the response time for each of the applications. The graphs are aligned such that thex-axis is the same on all three graphs.
The results for the Average Flow policy (table 4) show a 27.38% improvement in response time fora1and a decrease
of 5.05% for a2. Figure 4 shows that the policy switched
two servers froma2toa1after two minutes. The difference
in throughput (see table 5) is less than 0.4%, and is consid-ered to be a side effect of the stochastic think time used for the clients in the workload.
The On/Off policy results are shown in figure 5. The policy reacted faster than the Average flow policy, switching two servers froma2toa1after the first switching interval.
Although the server reacted faster than the Average Flow policy, the response times for a1 were improved by less. The On/Off policy improved the response time for a1 by 23.38%. The response time fora2was increased by a larger percentage than the Average Flow policy, which is due to the earlier switching of servers.
The Window policy performs best on the given work-load. The results for this policy are shown in figure 6. The policy reduces the average response times fora1by 30.20%
Figure 2. Direct Server Throughput vs. Redi-rected Throughput.
Figure 3. Experiment one application re-sponse times for a static server allocation.
and increases the response time fora2by 7.69%. The
win-dow policy performs four switches in the early stages of the experiment before remaining at a steady allocation of six servers fora1and two servers fora2.
The effects on throughput of switching servers between the pools are minimal, and may be considered as
side-Figure 4. Average Flow policy results under workload one.
effects of the distribution of client think times used during the experiment. The throughput of the applications does not increase as the workload does not rise during the ex-periment, which provides no opportunity for throughput to demonstrate a significant improvement.
6.2 Experiment Two
This experiment uses the workload in table 2. In this experiment the load on a1 is initially high and decreases
throughout the experiment, while the load ona2starts low
and then increases.
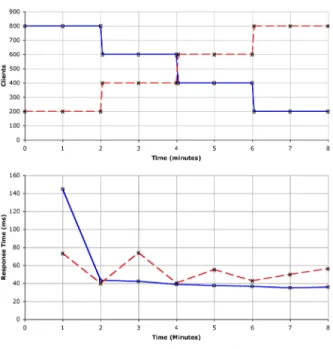
A baseline is provided by statically allocating four servers to each of the two applications. The response time for the application workload shown in table 2, over a period of eight minutes, is shown in figure 7.
After finding a baseline from the static server allocation, each of the three policies were measured against the same workload. The results of the three policies are shown in figures 8, 9 and 10.
Table 4. Comparison of policy response time against static allocation under workload one. Mean response time (ms)
Static Average Flow On/Off Window
a1 60.60 44.01 (-27.38%) 46.43 (-23.38%) 42.30 (-30.20%) a2 38.99 40.96 (5.05%) 42.40 (8.75%) 41.99 (7.69%)
Table 5. Comparison of policy throughput against static allocation under workload one. Mean throughput (requests/second)
Static Average Flow On/Off Window
a1 133.48 133.90 (0.31%) 132.11 (-1.03%) 134.02 (0.40%)
a2 28.95 29.02 (0.24%) 28.99 (0.14%) 29.14 (0.66%)
Figure 5. On/Off policy results under work-load one.
in figure 8. When compared to the static allocation (see ta-bles 6 and 7) the policy gives a 3.21% decrease in response time fora1and a 1.95% improvement fora2. Both applica-tions’ throughputs are decreased by around 1% during the
Figure 6. Window policy results under work-load one.
experiment.
Increases in response times fora2after two minutes and four minutes are attributed to the removal of a server from the pool. The large increase at seven minutes is a
combi-Figure 7. Response times for static server al-location under workload two.
nation of a server allocation of four servers and a rise in workload. The response time reduces at eight minutes after a server is added to the pool.
The On/Off policy results are shown in figure 9. The On/Off policy increases the response time for a1 by
10.96%, but it reduces the response time fora2by 2.61%. When compared to the Average Flow policy, this policy im-proves the response times fora2in the last two minutes of the experiment as it switches a server sixty seconds earlier.
The Window policy (see figure 10) switched signifi-cantly more than the two previous policies. The response times for the Window policy show both the biggest increase fora1and the largest decrease fora2. The Window policy
makes 14 switches over the duration of the experiment.
6.3 Experiment Three
The workload used in experiment three is shown in table 3. The workload changes at twenty second intervals, which is shorter than the switching interval.
The baseline for the workload in experiment three was found by observing the performance of a static allocation of servers. The results for the static allocation are shown in figure 11.
The Average Flow policy showed the best performance for this workload, improving the total response time for the applications by 22.84%. The policy performs four server
Figure 8. Average Flow policy results under workload two.
switches over the course of the experiment.
The On/Off policy improved the performance ofa1 by
7.36% and a2 by 12.65%. The policy switches the most
servers at one interval, switching four at 4:30 in the experi-ment and performs fourteen switches throughout the exper-iment.
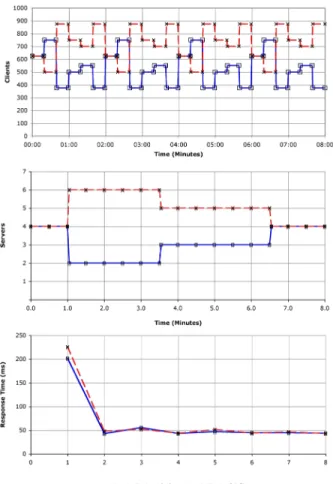
The Window policy switches servers in a cyclic pattern, which is synchronized with the workload, with a 2 minute period. The policy does not significantly improve the re-sponse time fora1(see table 8) but it improves the response time ofa2by 13.16%.
6.4 Analysis
In this paper we have tested three switching policies (Average Flow, On/Off and Window) under three differ-ent workload conditions (static, proportional and rapidly changing). Our results show that:
• if the workload remains static for long durations all policies deliver significant performance improvements
Table 6. Comparison of policy response time against static allocation under workload two. Mean response time (ms)
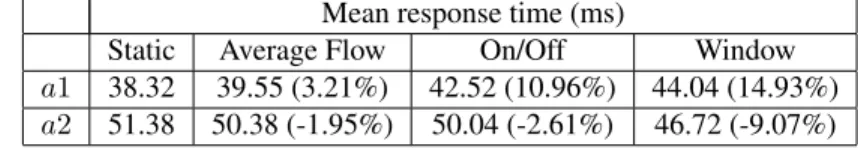
Static Average Flow On/Off Window
a1 38.32 39.55 (3.21%) 42.52 (10.96%) 44.04 (14.93%) a2 51.38 50.38 (-1.95%) 50.04 (-2.61%) 46.72 (-9.07%)
Table 7. Comparison of policy throughput against static allocation under workload two. Mean throughput (requests/second)
Static Average Flow On/Off Window
a1 70.06 69.36 (-1.00%) 70.15 (0.13%) 69.78 (-0.40%)
a2 82.90 82.03 (-1.05%) 83.07 (0.21%) 82.77 (-0.16%)
Table 8. Comparison of policy response time against static allocation under workload three. Mean response time (ms)
Static Average Flow On/Off Window
a1 49.21 45.71 (-7.11%) 45.59 (-7.36%) 49.19 (-0.04%)
a2 55.48 46.75 (-15.74%) 48.46 (-12.65%) 48.18 (-13.16%)
Table 9. Comparison of policy throughput against static allocation under workload three. Mean throughput (requests/second)
Static Average Flow On/Off Window
a1 79.75 79.56 (-0.24%) 79.64 (-0.14%) 81.10 (1.69%) a2 110.73 111.94 (1.09%) 110.77 (0.04%) 111.40 (0.61%)
Figure 9. On/Off policy results under work-load two.
for the heavily loaded application (23-30%). In our ex-periment the Window policy shows the best improve-ment in response time (30%);
• workloads which change in a proportional manner ob-tain improvements for the application that increases in load. The results for the application that decreases in load are worse than the static allocation because servers are removed as the workload decreases causing response times to rise. The Window policy provides the largest improvement (9%) for this workload.
• rapidly changing (with respect to the switching inter-val) workloads show improvements for both applica-tions under all policies. The Average Flow policy shows the largest combined decrease in application re-sponse times (22%);
• the use of switching policies in these experiments has no significant negative impact upon the throughput of the system. In the worst case the system overhead
(re-Figure 10. Window policy results under work-load two.
duced throughput) is less than 2% (for the Window policy under workload three).
The experiments in this paper indicate that the use of switching policies offer the potential for significant im-provements in application response times. Under each of the workloads the a specific policy is identified as provid-ing the best results. We are explorprovid-ing ways to dynamically select which policy to use, based upon identifying charac-teristics of the workloads ahead of time.
7 Conclusion and Further Work
In this paper we have developed a switching system that is representative of a real world commercial hosting envi-ronment. We have implemented three theoretically derived switching polices as found in [14]. After implementing the three policies we have evaluated their respective per-formance within our testbed and identified the best policies for our specific application given some sample workloads.
Figure 11. Application response times for a static allocation under workload three.
There is a significant amount of research to be done in this area. In our experiments we used a fixed switching in-terval of thirty seconds which was appropriate for our exper-iments. This figure was derived through consideration of the switching duration of the specific application that we used for our experiments. In the case of experiment three where the workload changes more frequently than the switching interval it may be possible to improve performance further by switching more frequently. Further investigations will focus on analyzing the switching duration.
The results for each policy shown here are derived from a number of fixed workloads. In the short term we plan to investigate a variety of workload patterns, and identify poli-cies which are most effective under specific workloads. The switching interval (which was fixed for our experiments) will be analyzed in conjunction with the workload patterns to consider its overall effect on the system.
In the longer term we will look to enhance the switch-ing system by identifyswitch-ing known workload patterns in an application’s workload trace and selecting the most appro-priate policy from our experimentation. The identification of the workload patterns is also expected to determine the appropriate dynamic switching interval, allowing the most effective switching interval to be selected given known or predicted workload patterns.
Figure 12. Average Flow policy results under workload three.
Acknowledgments
This work is supported in part by the UK Engineering and Physical Science Research Council (EPSRC) contract number EP/C538277/1.
References
[1] Y. An, T. Kin, T. Lau, and P. Shum. A scalability stucy for websphere application server and db2 universal database. Technical report, IBm, 2002.
[2] The Apache Software Foundation,
http://cwiki.apache.org/GMOxDOC12/daytrader.html. Daytrader.
[3] D. A. Bacigalupo, J. W. J. Xue, S. D. Hammond, S. A. Jarvis, D. N. Dillenberger, and G. R. Nudd. Predicting the effect on performance of container-managed persistence in a distributed enterprise application. Inproc. 21st IEEE In-ternational Parallel and Distributed Processing Symposium (IPDPS’07). IEEE Computer Society Press, March 2007.
Figure 13. On/Off policy results under work-load three.
[4] S. A. Banawan and N. M. Zeidat. A Comparitive Study of Load Sharing in Heterogeneous Multicomputer Systems. In the 25th Annual Simulation Symposium, pages 22–31, 1992. [5] L. Cherkasova and P. Phaal. Session Based Admission Con-trol: a Mechanism for Peak Load Management of Commer-cial Web Sites. IEEE Transactions on Computers, 51(6), jan 2002.
[6] G. Cuomo. A methodology for performance tuning. Tech-nical report, IBM, 2000.
[7] P. P. D. Villela and D. Rubenstein. Provisioning servers in the application tier for e-commerce systems.ACM Transac-tion on Internet Technology, 7(1):7, 2007.
[8] K. Dutta, A. Datta, D. VanderMeer, H. Thomas, and K. Ramamritham. ReDAL: An Efficient and Practical Re-quest Distribution Technique for Application Server Clus-ters.IEEE transactions on Parallel and Distributed Systems, 18(11):1516–1527, 2007.
[9] L. He, W. J. Xue, and S. A. Jarvis. Partition-based Profit Op-timisation for Multi-class Requests in Clusters of Servers. In the IEEE International Conference on e-Business Engineer-ing, 2007.
Figure 14. Window policy results under work-load three.
[10] Z. Liu, M. Squillante, and J. Wolf. On Maximizing Service-level-agreement Profits. ACM SIGMETRICS Performance Evaluation, 29:43–44, 01.
[11] D. Menasce, V. A. F. Almeida, and et al. Business-oriented Resource Management Policies for e-Commerce Servers. Performance Evaluation, 42:223–239, 2000.
[12] J. Palmer and I. Mitrani. Optimal and heuristic policies for dynamic server allocation. Journal of Parallel and Dis-tributed Computing, 65(10):1204–1211, 2005.
[13] N. G. ShiVaratri, P. Krueger, and M. Shingal. Load Dis-tribution for Locally Distributed Systems. IEEE Comupter, 8(12):33–44, December 1992.
[14] J. Slegers, I. Mitriani, and N. Thomas. Evaluating the opti-mal server allocation policy for clusters with on/off sources. In Fourth European Performance Engineering Workshop, EPEW 2007, Berlin, Germany, 2007.
[15] Sun Microsystems, Inc.Sun Java System Application Server 9.1 Performance Tuning Guide, 2007.
[16] K. Ueno, T. Alcott, J. Blight, J. Dekelver, D. Julin, C. Pfannkuch, and T. Sheih. Websphere scalability: Wlm and cliustering, using websphere application server ad-vanced edition (ibm redbook). Technical report, IBM, September 2000.
[17] B. Urgaonkar, P. Shenoy, A. Chandra, and et al. Dy-namic Provisioning of Multi-tier Internet Applications. In Second International Conference on Autonomic Computing (ICAC’05), 2005.
[18] M. Welsh and D. Culler. Adaptive Overload Control for Busy Internet Servers. Inthe 2003 USENIX Symposium on Internet Technologies and Systems, 2003.