Dissertations, Theses, and Student Research Department of 8-2013
Development of a controllable polymer system using
Development of a controllable polymer system using
interpenetrating networks
interpenetrating networks
Emilie BoboUniversity of Nebraska-Lincoln, [email protected]
Follow this and additional works at: https://digitalcommons.unl.edu/mechengdiss
Part of the Applied Mechanics Commons
Bobo, Emilie, "Development of a controllable polymer system using interpenetrating networks" (2013). Mechanical (and Materials) Engineering -- Dissertations, Theses, and Student Research. 53.
https://digitalcommons.unl.edu/mechengdiss/53
This Article is brought to you for free and open access by the Mechanical & Materials Engineering, Department of at DigitalCommons@University of Nebraska - Lincoln. It has been accepted for inclusion in Mechanical (and Materials) Engineering -- Dissertations, Theses, and Student Research by an authorized administrator of
D
EVELOPMENT OF A
C
ONTROLLABLE
P
OLYMER
S
YSTEM
U
SING
I
NTERPENETRATING
N
ETWORKS
By
Emilie Bobo
A THESIS
Presented to the Faculty of
The Graduate College at the University of Nebraska In Partial Fulfillment of the Requirements
For the Degree of Master of Science
Major: Mechanical & Materials Engineering
Under the Supervision of Professors Mehrdad Negahban and Li Tan Lincoln, Nebraska
Emilie Bobo, M.S. University of Nebraska, 2013
Advisers: Mehrdad Negahban and Li Tan
My research partners and I have studied the possibility of building a material system with controllable properties using two interpenetrating polymer networks (IPNs). This study is part of a project to build a rapid prototyping system that allows for the printing of objects with predefined spatial distribution of properties, with the goal that property distributions are controlled though interactions at the molecular level.
One can change the properties of an IPN by adjusting the ratio of interpenetrating networks present in a given cured mixture. This is similar to how one obtains different shades of the color green by gradually changing the ratio of blue and yellow pigments when mixing paint. In much the same way as one can use mixing to change colors along the surface of a painting, one may change the properties of a body along a direction in space by changing the ratio of networks in the IPN. To achieve this, we studied how to make an IPN and how to control it in a way that will allow controlled grading of material properties in space.
An IPN is constructed by curing two polymer networks in the same space. Unlike separated systems, the IPN shows behavior and properties that result from the close interaction of the networks, a feature that inhibits the expression of the individual network properties in favor of a property resulting from the close interaction of the networks. The properties of a given IPN
At first, we studied and demonstrated the construction of an IPN using two networks that are both photo-cured in the same space. Most IPNs are constructed using a combination of rapid photo-curing of one network and then slow thermal curing of the second network, which is constructed from molecules that are trapped in the first network. The ability to photo-cure both networks speeds up the curing process, a point deemed desirable for rapid prototyping. Once constructed, Fourier-Transform Infra-Red spectroscopy (FTIR), Differential Scanning Calorimetry (DSC), and Atomic Force Microscopy (AFM) were used to show that the resulting system is a true IPN and we used Thermal Gravimetric Analysis (TGA), AFM, Dynamic Mechanical Analysis (DMA), and tensile testing to further characterize its properties.
Next, we studied how to control the ratio of the two networks in the IPN by selectively controlling the extent of curing of each network and then removing the uncured components. This provided a path based on using selective photo-initiation to control the system properties. To achieve this, we studied the curing kinetics of the two selected systems and the possibility to selectively initiate each system. In the process, we identified photo-initiators that could be more selective than the ones initially used and also studied alternate paths to property control in curing polymer systems.
I would like to thank the people who trusted me, encouraged me and helped me during this year.
First, I want to thank Dr. Negahban, my advisor, for his precious advice, his supervision and his support. Dr. Tan, my co-advisor, for his explanations about the chemistry and the interpretation of the results, I learned a lot working with him. I would like to thank Dr. Saiter for his expertise and his guidance. Dr. Delpouve, his two visits here were very helpful and I want to thank him too for his guidance. Also, I want to again thank Dr. Saiter and Dr. Negahban who allowed me to participate in this exchange program.
Second, I would like to thank my teammates. I have very much appreciated working with them, and they have all helped me improve my English.
Next, I would like to thank my friends and my family in France, who have encouraged me this year and my new friends in the USA, with whom I have enjoyed my American life. Finally, I want to especially thank my friends Etienne, Benjamin, and Quentin with whom I have shared this experience, and I would never have done this without their support. Thanks a lot.
This thesis was possible with the help of collaborative program between the University of Nebraska-Lincoln, in the United States, and the University of Rouen, in France.
Table of Contents
Acknowledgments ... iv
List of figures ... vii
List of tables ... xi
Chapter 1: Introduction ... 1
1.1. Interpenetrating Polymer Networks (IPNs) ... 2
1.2. IPN observation and detection ... 6
1.3. IPN for constructing spatially graded properties ... 8
1.4. UV photo-curing ... 9
Chapter 2: Strategy for IPN design and process characterization ... 12
2.1. General design considerations for IPN construction ... 12
2.2. Issues related to radical and cationic polymerization ... 14
2.3. Selected chemicals ... 15
2.4. Curing procedure ... 20
2.5. Curing mechanism ... 21
2.5.1 Cationic and radical initiators used and their role in the reactions ... 21
2.5.2 Polymerization reaction for the resins ... 23
2.6. Post-curing reaction ... 26
2.7. Study of reaction kinetics by Fourier Transformed Infrared Spectroscopy (FTIR) .. 31
3.3. Infrared spectroscopy to identify possible chemical interactions between networks 50
3.4. DSC analysis showing the well mixing of resins ... 55
3.5. Mechanical tests show the effect of composition ratio on tensile properties ... 58
Chapter 4: From controllable IPN to gradient material ... 60
4.1. Conversion ratio control ... 63
4.1.1 Problem of photo-initiator selectivity ... 63
4.1.2 Study of curing kinetics ... 65
4.2. Controlling properties by partial curing followed by removing uncured resins using a solvent ... 69
4.3. Other techniques proposed to construct a gradient material ... 76
4.3.1 Selectable photo-initiators for control of network formation ... 77
4.3.2 Termination reaction to stop the network formation ... 82
Chapter 5: Conclusion and future work ... 85
Future work ... 87
List of figures
Figure 1.1 - Interpenetrating network constructed from network A and B. ... 3
Figure 1.2 - Difference between thermoplastic and thermosetting polymers [10]. ... 4
Figure 1.3 - Different IPN structures [15]. ... 5
Figure 1.4 - Classification of IPNs. ... 6
Figure 2.1 - 3,4 epoxycyclohexylmethyl / 3,4 epoxycyclohexane carboxylate molecule... 16
Figure 2.2 - Bisphenol A propoxylatediacrylate. ... 16
Figure 2.3 - UV photo-initiators spectra. ... 18
Figure 2.4 - UV spectrum of the metal halide polychromatic lamp used. ... 19
Figure 2.5 - Activation of cationic initiator under UV. ... 21
Figure 2.6 - Propylene Carbonate. ... 21
Figure 2.7 - Activation of Radical initiator under UV following the α-cleavage [30]. ... 22
Figure 2.8 - Scheme of polymerization reaction. ... 23
Figure 2.9 - Cationic polymerization reaction. ... 24
Figure 2.10 - Chain of the epoxy resin. ... 24
Figure 2.11 - Radical polymerization reaction. ... 25
Figure 2.12 - TGA curves from ambient to 350°C (done by Lena Butterfield). ... 29
Figure 2.15 - Nicolet Avatar 360 FT-IR. ... 32
Figure 2.16 - FTIR spectra for pure epoxy resin before and after UV curing. ... 34
Figure 2.17 - Epoxy resin FTIR spectrum. ... 34
Figure 2.18 - Cationic crosslinker. ... 35
Figure 2.19 - Analysis of conversion and reference peaks. ... 36
Figure 2.20 - FTIR spectra for pure acrylate resin before and after UV curing. ... 37
Figure 2.21 - FTIR spectrum of Acrylate functional polydimethylsiloxane. ... 37
Figure 2.22 - Acrylate resin molecule. ... 38
Figure 2.23 - Methacrylate chemical group. ... 38
Figure 2.24 - Analysis of conversion and reference peaks. ... 38
Figure 2.25 - Epoxy resin conversion studied by FTIR for 50/50 mixture. ... 39
Figure 2.26 - Acrylate resin conversion studied by FTIR for 50/50 mixture ... 40
Figure 3.1 - Images of samples with different acrylate/epoxy ratios obtained according to the curing process described in Section 2.4. The compositions are A = 100% acrylate resin, B = 90/10 (acrylate/epoxy), C = 80/20, D = 70/30, E = 60/40, F = 50/50, G = 40/60, H = 30/70, I = 20/80, J = 10/90 and K = 100% epoxy resin ... 43
Figure 3.2 - AFM pictures for pure resins. ... 45
Figure 3.3 - AFM pictures for 80/20 and 50/50 composition ratios. ... 47
Figure 3.4 - AFM picture for 20/80 composition ratio. ... 48
Figure 3.7 - FTIR spectrum of pure epoxy, 30/70, 40/60, 50/50, 60/40, 70/30, 90/10
(Acrylate/Epoxy) and pure acrylate resin, for 32 scans and a resolution of 4 cm-1. ... 52
Figure 3.8 - FTIR spectrum of pure epoxy, 10/90, 20/80, 80/20 (Acrylate/Epoxy) and pure acrylate resin, for 32 scans and a resolution of 4 cm-1, ... 53
Figure 3.9 - Zoom of the Figure 3.8 between 2000 and 1200 cm-1. ... 53
Figure 3.10 - Difference between carboxylic acid and ester group. ... 54
Figure 3.11 - Typical DSC thermogram (80/20 composition ratio of acrylate to epoxy). ... 56
Figure 3.12 - Summarization of Tg values for all composition analyzed by DSC. ... 57
Figure 3.13 - Young's modulus, stress at failure and strain at failure as a function of composition ratios. ... 59
Figure 4.1 - IPN structure for different composition ratio of polymer components. ... 60
Figure 4.2 - Construction of graded material. ... 62
Figure 4.3 - Curing of Epoxy (on left) and Acrylate (on right) resins for different times of UV exposure (5, 10, 20, 50, 80, 110 and 140 s). ... 67
Figure 4.4 - Difference between rinsed (left) and immersed (right) samples in acetone for 10, 80, 140 & 300 s (up and down). ... 71
Figure 4.5 - Acetone molecule. ... 72
Figure 4.6 - THF molecule. ... 72
Figure 4.7 - Samples rinsed in acetone, immersed in acetone and immersed in THF. ... 73
Figure 4.10 - tert-butyloxycarbonyl. ... 78 Figure 4.11 - Acetic acid spectrum for three different temperatures. ... 80 Figure 4.12 - UV absorption spectrum of BOC + Acetic acid mix. ... 81
Table 1 - Comparison of different kind of polymer blends. ... 8 Table 2 - UV curing flood lamp specifications [24]. ... 19 Table 3 - Table of FTIR spectrum peaks observed for the pure resin. The index “***” indicate that this band is observe on some mixture and not for the network alones. ... 51 Table 4 - Curing of pure resins using either initiator (under polychromatic lamp and N2, at
20°C). ... 64 Table 5 - General characteristics of the kinetic of curing the pure resins under polychromatic UV light. ... 67 Table 6 - Estimation of solubility of resins in solvent. ... 74
Chapter 1:
Introduction
Rapid prototyping (RP), based on added manufacturing, provides accurate techniques for curing resins from a liquid bulk and obtaining 3-D objects [1] [2]. RP is based on an accurate control of curing conditions and of the position of curing. RP allows laboratory-developed material systems to be precisely manufactured in a shape and size for industrial applications. Nowadays it is possible from rapid prototyping to build very complex shapes. However no RP technology allows creating materials exhibiting different properties while keeping a molecular level continuous continuum.
The goal of this thesis is to study how to develop a material system that can be used to create parts with distributed (graded) properties that vary on a molecular scale. This kind of gradient can be obtained by mixing polymers A and B that exhibit different properties to obtain a progressive change of properties by changing the composition, for example, from pure A to pure B. The primary method proposed in this study for constructing the grading is based on the development of interpenetrating polymer networks (IPNs). These systems appear when two or more networks are interlaced by irreversible entanglements at the molecular level without any covalent bond between them. Once they are cured, the networks cannot be separated from each other unless their own chemicals bonds are broken. Depending on the volume ratio between the different polymers, one can observe the IPN in a material at a very local scale. In this work, the choice of IPN structure is motivated by their ease of being
obtained. Most often, they can be synthesized from photo- or thermo-curing, which need to be compatible with the engineering requirements for rapid prototyping.
To get a gradient, one must control the properties of the material by changing the morphology of the system at different areas. The idea is then to vary the composition at the micro scale by playing on the advancement of the network formation. Following the IPN design, the local control of the reaction advancement is much easier using the photo-curing compared to the thermo-curing. Moreover, this reaction is also faster. Thus, by varying the time of exposure under UV-light, it is assumed that the local properties of the material will change.
The thesis outline is as follows: this first chapter introduces the problem studied and provides a background concerning Interpenetrating Polymer Networks (IPNs). The second chapter is dedicated to describing the strategy proposed for creating the IPN. The third chapter focuses on the characterization of the different materials synthesized during this study. The fourth chapter introduces the notion of a gradient and explains how one can go from an IPN to a graded material. The fifth chapter contains conclusions, perspectives, and possible future work.
1.1.Interpenetrating Polymer Networks (IPNs)
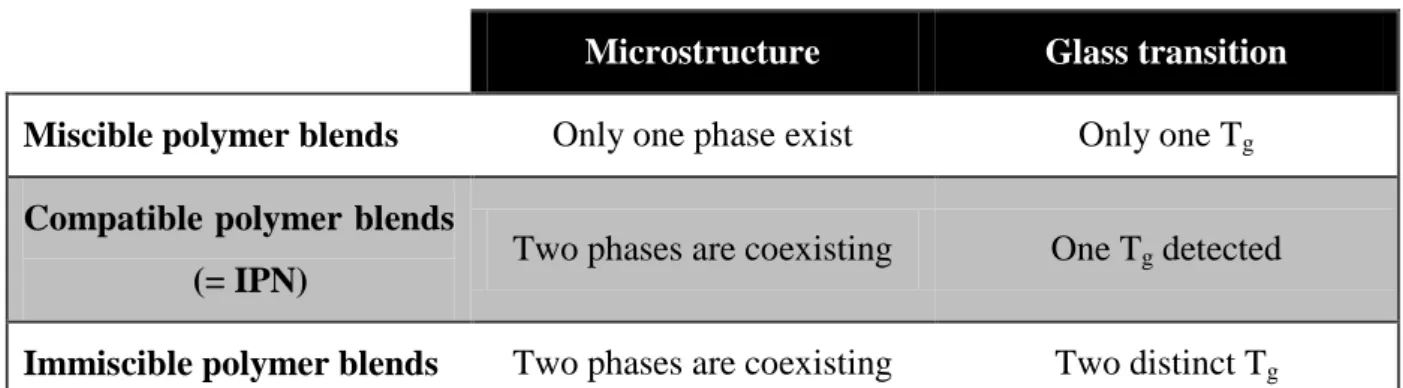
There are three categories of polymer blends: miscible, compatible and immiscible. Miscible polymer blends have a microstructure composed of only one phase. These materials are completely homogeneous. On another hand, immiscible polymer blends have a heterogeneous structure since the two constituents do not have affinity for each other and, as a result, phase separate. Compatible polymer blends are materials with homogeneous properties at the
macro-scale, but with a microstructure presenting two distinct phases. IPNs are normally constructed from compatible polymer blends.
As is shown in Figure 1.1, an IPN is composed of two or more polymer networks that are intertwined such that each is entangled with the others on the molecular scale [3] [4] [5] [6] [7]. The IPN is a polymeric material where different networks, with their own intrinsic properties, are physically entangled but not interacting. However, an IPN cannot be considered as a simple polymer blend [8], which is often composed of thermoplastic polymers. Polymer blends normally show the characteristics of both components of the mixture, whereas IPNs normally show a single property which results from the close interaction of the networks. Several applications for IPNs are, for example, automobile parts, vibration damping parts, controlled drug delivery capsules and contact lenses [9]. The complex IPN structure can be found in all these products as it is easy and quick to obtain, and, it offers the possibility of taking advantage of the properties of each polymer by synergic or antagonist effects to create a high performance material.
Figure 1.1 - Interpenetrating network constructed from network A and B.
Polymers are generally classified in two categories: thermoplastic and thermosetting polymers (Figure 1.2). Unlike thermoplastics, thermosetting polymers form a 3D network that is chemically bonded and, thus, cannot melt. Thermosetting polymers have many advantages
over thermoplastic polymers, because they have good thermal stability, weak interaction with solvents and very stable behavior over the time.
Figure 1.2 - Difference between thermoplastic and thermosetting polymers [10].
The main condition required for creating an IPN is to use compatible or miscible polymers which must be able to entangle their networks to form a relatively stable material [5]. Two main IPN structures are distinguished (Figure 1.3): full and semi-IPN [11] [12]. While the full IPN is composed of two separate 3-D networks, the semi-IPN has a linear polymer entangled with a cross-linked network. The full IPN is only composed of thermosetting polymers which each have their own network. As for semi-IPNs, they are composed of thermosetting and thermoplastic polymers (in this case one does not construct a 3-D network; being in the form of a long linear chain).
Figure 1.3 - Different IPN structures [15].
The two structures result in different characteristic properties. An advantage of the full IPN is that it can prevent the risk of complete phase separation due migration of one component. This results from the network entanglement. Depending on the level of immiscibility, it is possible to have heterogeneity at micro or even nano-scale, so homogeneity exists at macro or micro-scale. Two aspects are particularly of importance in this study considering our requirements: the stability over time of the system and the wish to prevent phase separation inside the mixture. These drive our choice of designing a full IPN.
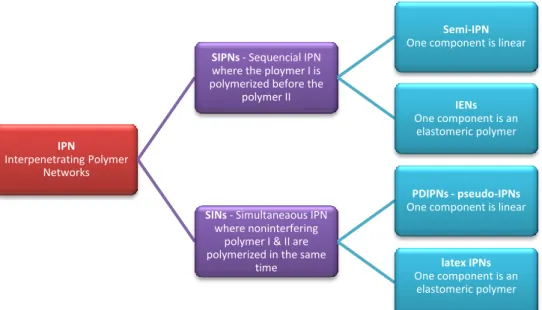
Another classification (shown on the Figure 1.4) considers the kinetic aspect of the two reactions [11] [13]. The SIN (Simultaneous IPN) is obtained when both polymers (also named cross-linkers) cure at the same time. The design of SINs requires that the two reactions not interfere with each other. Most often the SIN is constructed from a combination of a radical polymerization and a polycondensation. It has been shown simultaneous formation the two networks yields the best properties [9] [14] and limits the possible phase separation [13].On the other hand, if one reaction is achieved before the other starts, the structure created is called a Sequential IPN. The two processes exhibit advantages depending on the required properties of the material. During the synthesis of Sequential IPNs, the first created network
Full IPN
Polymer 1 Polymer 2
swells because of the presence of the liquid polymer. This leads to a chain extended conformation. For Simultaneous IPNs, the absence of swelling during the synthesis leads to a relaxed conformation.
Figure 1.4 - Classification of IPNs.
The goal of the project is to synthesize materials from rapid prototyping. Clearly, the reaction has to be the fastest possible and must lead to the creation of something close to a Simultaneous IPN. However, as explained by Sperling et al. [15], if the curing occurs simultaneously, it is very rare that their rates are identical. One must keep in mind that one network will always be achieved before the other.
1.2.IPN observation and detection
By definition, an IPN is the physical entanglement of two polymeric networks which do not chemically interact, but physically interact due to the close presence of the atoms of the networks. At most scales, the IPN appears as a homogeneous material. However, the IPN
IPN
Interpenetrating Polymer Networks
SIPNs - Sequencial IPN where the ploymer I is polymerized before the
polymer II
Semi-IPN One component is linear
IENs One component is an
elastomeric polymer
SINs - Simultaneaous IPN where noninterfering
polymer I & II are polymerized in the same
time
PDIPNs - pseudo-IPNs One component is linear
latex IPNs One component is an
rarely constitutes the full part of the material, so its detection can be very complex. Most often, it is recommended to combine different characterization techniques to clearly demonstrate the formation of the IPN.
As is summarized in Table 1, the general feature of polymer blends can be investigated by studying the glass transition temperature (Tg) of the different phases, and of the blend. The Tg
corresponds to the temperature of transition between the glass and the rubbery state of the amorphous phase and can be used to study the homogeneity of the sample. If the material is immiscibly phase separated, one would normally observe two glass transitions exhibiting no variations depending on the composition. For a miscible polymer blend, only one phase exists and one glass transition is observed. Most often, when an IPN is formed, only one glass transition is observed. The IPN structure normally results from compatible polymer blends. In such cases, there are two independent networks present in the structure which appears homogeneous in the global properties (such as glass transition temperature). The temperature, of the observed glass transition, can be significantly different of one calculated from a mixing law, as the Fox-Flory one, as the IPN structure is characterized by many complex physical interactions. Another way to characterize the IPN consists of using Microscopy techniques such as Atomic Force Microscopy (AFM) or Transmission Electron Microscopy (TEM) to detect any evidence of phase separation. In general, no single technique is able to definitely prove the existence of IPN structure.
Table 1 - Comparison of different kind of polymer blends.
Microstructure Glass transition
Miscible polymer blends Only one phase exist Only one Tg
Compatible polymer blends
(= IPN) Two phases are coexisting One Tg detected Immiscible polymer blends Two phases are coexisting Two distinct Tg
1.3.IPN for constructing spatially graded properties
IPNs are constructed from two or more polymer networks that are cured in such a way that results in each network interpenetrating the other network(s) at a molecular level. It is well known that the properties of IPNs can be designed by the selection of the individual networks, and the ratio of each in the IPN system. So, by controlling the network created and the ratio, it is theoretically possible to build a material with a gradient of properties.
The idea and the benefits of obtaining a gradient of properties has existed for a long time and different methods have been proposed to obtain grading, such as for example, by preparation of gradient surfaces by plasma and corona treatment [16], by extrusion of different layers forming Polymeric Gradient Material (PGM) [17], by utilizing combination of UV light and temperature [18] [19], and by other methods. The benefits of such systems can be realized by making systems that have desired properties put at locations that can mitigate specific loading. This would result in a part that is considered to be a functionally graded material (FGM).
One method for obtaining a grading of the properties is to mix compounds with different properties. For example, a gradient of composition of two materials in a mixture would
logically create a gradient of material properties. One method for doing this is to vary the composition of the components of an IPN, as shown by Lecamp et al. [18] [19]. In a traditional IPN, one can obtain different properties by controlling the ratio of each network in the resulting IPN. In this work we propose to control the structure of the IPN by controlling the curing of the different networks, making it is possible to obtain different properties from the same initial mixture.
1.4.UV photo-curing
As explained above, the material design proposed in this master thesis has to be compatible with a rapid prototyping application. That means that the way of curing must be accurate and very fast. The idea proposed is to create the IPN structure using photo-curing for both networks. A photo-initiator and cross-linker are essential for photo-curing. The cross-linker cannot polymerize by itself and needs just a small amount of photo-initiator to activate the reaction. The role of the photo-initiator is to absorb the light and produce either radicals or ions which will activate the curing reaction. It also needs to have a high quantum yield to be efficient (ratio between the number of photons used for the reaction and the number of photons sent). The polymerization depends on multiple factors such as the quantum yield of the photo-initiator, the curing kinetics, the temperature and the energy provided by the lamp. The most desirable activation source is by using UV rays. Indeed, this method has the advantage of being accurate, and the existence of many photo-initiators that are reactive under the UV wavelengths of light [20].
The polymerization reaction is very fast (around a tenth of a second under intensive light) compared to thermal curing which often needs several hours to be completely finished.
The use of UV light provides a better accuracy and higher opportunities for controlling the conversion ratio. The reaction is directly associated with the radiation and, as a result, if the UV light is turned off, the polymerization can be stopped (radical initiator) or slowed down (ionic initiator).
The location of curing is controlled by selecting the area of exposure to light.
With the variation of the wavelength or the concentration in photo-initiator, it is possible to change the penetration depth of the light and so the thickness of the cured material.
The curing can be done at room temperature, averting the release of polluting vapor. A previous attempt at IPN preparation from UV photo-curing was made by Kévin Lefebvre as described in his master thesis [22]. He was able to identify two resins (epoxy and acrylate) which rapidly cured under a UV lamp, and he studied the possibility of curing both resins at the same time. He succeeded in obtaining thermo-stable materials and evidenced the role of temperature on the photo-curing, especially in regard to the curing of the epoxy resin. Nevertheless, no solid evidence of IPN creation was shown.
The aim of this project is to prove that it is possible to make an IPN by light-initiated curing and to control its composition, thus changing its properties by process design. This study will include:
1. The design and development of IPN systems with the possibility of control by selective curing through light activated photo-curing.
2. The study of the resulting IPN systems, establishing that the systems produced are IPNs that have different and changing properties; and using a number of characterization methods to investigate the material properties. These include Fourier Transform Infra-Red spectroscopy (FTIR), thermal analysis by Differential Scanning Calorimetry and Thermal Gravimetric Analysis (DSC and TGA), nano-mechanical analysis by Atomic Force Microscopy (AFM) and mechanical analysis by tensile testing and Dynamic Mechanical Analysis (DMA).
3. The study of the possible ways to achieve material control in RP systems using light initiated curing and the study of different molecular systems leading to different chemical reactions.
Chapter 2:
Strategy for IPN design and process
characterization
This chapter will focus on designing an IPN that satisfies the needs of this project and characterizes the chemical process involved. This includes choosing the molecules that will construct the two networks of the IPN and determining what the expected behavior of this system will be. In addition, the chemistry and kinetics of the systems selected will be studied.
2.1.General design considerations for IPN construction
The properties of an IPN are derived from the type and ratio of the two networks constructing the IPN. For this study, a system needs to be developed to build IPNs of vastly different mechanical properties. As a result, the strategy is to build IPNs from a mix of one network that is soft and tough, and one that is rigid and brittle. With such a system, the ability to get a range of IPNs, that span from tough to brittle and from soft to rigid behavior, is expected.
The characteristics of each network in an IPN depend on the topology of the network. For a full IPN, two cross-linked polymer networks are involved. The properties of each network depend on the chemical structure of the polymer systems in the network. This relation can be very complex. In this study the process of selection will be simplified to finding one network that has long polymer units between the cross-links and one that has short polymer units. This, respectively, should provide a soft network and a hard network.
To construct an IPN two networks need to be cured in the same physical space without one chemically bonding to the other. That is, the process of forming the two networks needs to be sufficiently different, so as to allow each to independently progress adjacent to the other. There are primarily three mechanisms for network formation. Thsee are radical polymerization, ionic polymerization and polycondensation. Polycondensation is slow and was excluded from consideration because the plan is to use the process in rapid prototyping. As a result, we looked for one system that uses radical based and one that uses ionic based network construction.
To use the system for rapid prototyping, it is desirable to find a network formation which is fast and controllable. This suggests using photo-curing for both networks. Photo-curing processes are done using photo-initiators to start the reactions. The photo-initiators react to light to initiate the mechanisms that construct the network. In this project, we selected one photo-initiator that creates a radical and one that creates a cation, and found associated molecules to interact with them to construct the networks.
A typical polymer network is constructed from cross-linking polymers (typically oligomers). For curing of such a system, one would require a mixture that contained photo-initiators, cross-linker and oligomers. To simplify the process, the research is focused on systems that are constructed simply by connecting cross-linkers, removing the need to add a separate polymer to the system. Thus, networks that can be built entirely from mixture of a photo-initiator and a cross-linker are evaluated.
Finally, for the two networks to form in the same physical space so that an interpenetrated system is obtained, the components of the initial mixture need to be at least compatible. If the
components separate during the curing of the networks, the networks will end up curing in separated phases in place of making an IPN.
2.2.Issues related to radical and cationic polymerization
Several issues must be considered with respect to the radical and cationic polymerization methods selected.
In general, radicals are short lived while cations are not. As a result, once the light source initiating the curing process is turned off, the radical cross-linking is stopped while the cationic cross-linking can continue. In the case of cationic cross-linking, this continuation of curing is the source of what is known as dark curing (i.e., continuation of curing even after the light has been turned off). Typically, dark curing will continue until all the cations that have been created by photo-initiation have initiated a reaction with the cross-linker.
In addition, the cationic photo-initiation process produces radicals as a byproduct that then can initiate the radical cross-linking process. As a result, control of the network formation is better achieved when the radical photo-initiator is activated first so that this network is constructed before the radicals from the cationic photo-initiation are liberated. Even though this is not necessarily an issue in general IPN development, it will be an issue when attempting to control the extent of network construction in the rapid prototyping machine.
In general, the radical process is faster than the cationic process. This natural difference in curing kinetics will allow using a polychromatic light to construct the two networks in sequence, beginning by building the first network based on the radical process and then building the second network based on the cationic process. Later, we will need to select
photo-initiators that respond over different ranges of the light spectrum so that the light source wavelength and power can be used to select which reaction is initiated and the speed and extent of network curing.
Finally, simultaneously constructed IPN networks (SIPNs), where both networks are formed at the same time, are known to result in the most homogeneous structures, giving the best entanglement of networks and being least sensitive to the problem of phase separation. Typically, such systems are mixed and then the polymerization reactions for both resins are activated at the same time [23]. As a result, these systems can be simple to create, but the kinetics of network formation need to be considered to obtain simultaneous curing. Even though not considered here, selection of the wavelength of the light source during curing alters the kinetics of photo-curing. This provides a path for obtaining SIPNs by selecting wavelengths that favor the slower mechanism and retards the faster mechanism, resulting in the two networks forming at approximately the same rate.
2.3.Selected chemicals
For each reaction, the choice of the crosslinker and initiator is of importance. The initiator must be sensitive to the given light source wavelength while the cured resin has to exhibit properties in accordance to the required applications. To create a full IPN, two thermosetting resins with very different properties were selected. These were the second set of resins selected for evaluation. The first set were developed and studied by Kevin Lefebvre and reported in his thesis [22].
The system selected constituted of 3,4 epoxycyclohexylmethyl / 3,4 epoxycyclohexane carboxylate (ECH, Figure 2.1), which cures according to a cationic mechanism, and
Bisphenol A propoxylate diacrylate (BPD, Figure 2.2), which cures by a radical mechanism. The work of Kevin Lefebvre indicated the need to select resins for the two components of the IPN that are vastly different from each other. Indeed the ECH and BPD selected by Kevin Lefebvre exhibited close glass transition temperatures and close mechanical properties. With such systems, the identification of the IPN is very difficult as one cannot observe noticeable variations of thermal and mechanical properties, even with large variation of network ratios. There would also be a problem in RP to obtain a gradient of properties since the possible variations will be too low.
Figure 2.1 - 3,4 epoxycyclohexylmethyl / 3,4 epoxycyclohexane carboxylate molecule.
Figure 2.2 - Bisphenol A propoxylatediacrylate.
Considering the shortcoming of the original selection, in this study resins were selected that should result in networks with widely different macroscopic properties. The properties of the networks in the systems are controlled by the chemical structure of the cross-linkers. For example, a cross-linker for which the reactive functions (i.e. the crossing points) are separated by a long chain result in a soft material that has a low glass transition temperature while a cross-linker for which the reactive functions are close leads to a hard material with a high glass transition temperature.
Another important aspect of concern is the reactivity of the cross-linker. This is strongly dependent on the reactive functions at the reaction points. For example, the reactivity of ECH is significantly higher than the reactivity of the 1,4-Cyclohexanedimethanol diglycidyl ether, which is another often-used cross-linker for the creation of cationic networks. As the reaction needs to be fast, because the system will be built in rapid prototyping, it was decided to keep the faster ECH and explore a mechanism involving a new radical cross-linker. Furthermore, this was also motivated since a larger number of radical cross-linkers are commercially available.
The network made only with the ECH cross-linker leads to a hard material with a Young’s Modulus of about 2 GPa (obtained from tensile testing). In constructing the chemicals to make the IPN, the idea is to mix ECH with a long chain cross-linker that is activated by a radical mechanism, and which leads to a very soft network. BPD, as shown above, can be obtained with varying chain length. To obtain a soft molecule, a BPD with a molecular weight of Mn = 1700 g/mol (corresponding to n = 15) was chosen for the cross-linker. Between the high modulus ECH network and the low modulus BPD network, the selection should provide the ability to obtain a broader range of properties by selecting different concentration ratios for the components of the resulting IPN.
For the initial work, a polychromatic UV light was used. This source should initiate both reactions. Thus both photo-initiators should simultaneously get initiated by the UV radiation. In particular, both initiators must have an absorbance that matches the emission of the UV lamp. To verify this, the range of absorbance of each initiator can be measured by UV spectroscopy.
Figure 2.3 shows the UV spectra of the two photo-initiators used by Kevin Lefebvre to cure ECH and BPD. The cationic photo-initiator is Triarylsulfonium hexafluoroantimonate and the radical photo-initiator is 2-hydroxy-2-methylpropiophenone.
Figure 2.3 - UV photo-initiators spectra.
Figure 2.4 shows the UV spectrum of the lamp used in the laboratory, the Dymax® 500. Its characteristics are presented in the Table 2.
Figure 2.4 - UV spectrum of the metal halide polychromatic lamp used.
Table 2 - UV curing flood lamp specifications [24].
Output Power 400 Watts
UV Light Source Unfiltered UVA flood
Typical Intensity in the UVA range (320-390 nm1)
Measured three inches from the bottom edge of the reflector housing
225 mW/cm2
Dimensions of Illuminated Area 5" x 5" (12.7 cm x 12.7 cm)
EC Input Power Requirements Universal 90-265 VAC (grounded), 47-63 Hz
Reflector Housing Dimensions(approximate)
6.75" L x 6.75" W x 8" H (17.2 cm x 17.2 cm x 20.3 cm)
As can be seen, the UV spectra absorbed by the photo-initiators and the spectrum of the lamp match. This indicates that the UV rays from the lamp are theoretically able to activate the photo-initiators, which absorb in the same range.
2.4.Curing procedure
To prepare the IPN, the resins in the desired ratio are poured into a bottle. The smallest amount of initiator possible to obtain each reaction is then added (drops). The result is mixed with a spatula until it appears homogeneous (around 20 seconds). Since the mixing introduces air bubbles, a vacuum is applied to the bottle to remove the air (around 10 to 15min). The bottle is then heated to 50°C for 3 minutes to decrease the viscosity of the system and allow any remaining air to rise to the surface. This method of preparation, where both resins are mixed together when they are still viscous, produces the best degree of entanglement in the final material [25].
The prepared mixture is then put in a silicon mold, normally in the form of a bar (≈ 1 x 0.5 x 7 cm3
). The mold is put under a polychromatic lamp at room temperature using an N2 gas shield. The N2 gas shields the mixture from interacting with oxygen in the atmosphere.
Oxygen can react with radicals and stop the radical based cross-linking mechanism. For this system, the time of curing under polychromatic lamp is around 3 minutes for the radical sample [19] and 10 minutes for the cationic sample. The time selected for curing the epoxy resin (cationic component) was longer than the radical curing time, which is consistent with observations reported in the literature [26]. In each case, a time for curing was selected that was longer than that expected for full curing. This guaranteed the complete curing of the resins.
Once the samples were cured under the polychromatic lamp, they were stored in a plastic bag. The air in the bag was removed (as much as possible by hand) to protect the samples from interactions with the environment.
2.5.Curing mechanism
2.5.1 Cationic and radical initiators used and their role in the reactions
The mechanism of activation for the cationic initiator (Triarylsulfonium
hexafluoroantimonate) is described in Figure 2.5 [27] [28].
Figure 2.5 - Activation of cationic initiator under UV.
This reaction is called cationic because the H+ proton formed will react with the cross-linker and initiate the polymerization. The H+ comes from the solvent RH, which in this case is propylene carbonate (C4H6O3), shown in Figure 2.6.
Figure 2.6 - Propylene Carbonate.
For all cationic mechanisms, radicals are created. This fact may be a problem because these radicals can simultaneously initiate the radical reaction in the case of a mixture that is based on the control of both a radical and a cationic reaction.
The triarylsulphonium has the advantage of being one of the most stable cationic initiators. Unlike classic initiators, it does not create N2 gas during the polymerization [27]. Moreover,
the cationic initiators have a long life time, so a dark curing (curing after the discontinuation of the light) can appear inside the material [29]. This means that even if the light exposure is stopped, the material is able to continue curing. This is because the activated initiator does not need additional energy to continue to build the network.
The mechanism of activation of the radical initiator (2-hydroxy-2-methylpropiophenone or DAROCUR 1173) is given in Figure 2.7.
Figure 2.7 - Activation of Radical initiator under UV following the α-cleavage [30].
Radical initiators have many advantages [27]:
Good absorptivity in the area exposed to the light source
Good quantum efficiency of radicals
They are transparent
They are non-toxic
They are odorless
They can be handled easily
Due to their very high reactivity, radicals have a short life time and, as a result, the curing reaction is very fast. The material structure does not change very much after UV curing and is relatively stable. Without reactive compounds inside the mixture, the network cannot change chemically.
Because of their high sensitivity, radicals are very reactive with oxygen. It is for this reason that experiments are done under nitrogen, which is an inert gas. If the photo-initiator reacts with oxygen from the atmosphere, it will not be able to initiate the curing reaction.
2.5.2 Polymerization reaction for the resins
The curing reaction is explained in Figure 2.8 [31].
Figure 2.8 - Scheme of polymerization reaction.
The first step of this process consists of obtaining reactive species (either radicals or ions) by irradiation of photo-initiators with UV light. Then, these reactive species react with parts of the monomer to link them and form a cross-linked polymer.
•
UV radiation
•
Photoinitiator
Reactive
species
•
Multifunctional
polymer
• Reactive species
Polymer radical
or ion
• Polymer radical
or ion
• Multifuntional
polymer
Crosslinked
polymer
Cationic polymerization
For the cationic polymerization, after the creation of ions the polymerization of the epoxy resin follows the path shown on Figure 2.9 [31].
Figure 2.9 - Cationic polymerization reaction.
The cationic initiator uses the H+ proton to open the epoxide ring. Then, the positive charge is moved along the polymer’s backbone, and the reaction continues for several cross-linkers (Figure 2.10).
Figure 2.10 - Chain of the epoxy resin.
Termination can occur with a solvent, monomer or side reaction, where a molecular rearrangement appears between an anion and counterion allowing inactivation of the growing chain.
When the reaction is complete, a three dimensional network is obtained. In this case a hard material is created due to the short length between linking nodes.
Radical polymerization
For the acrylate resin, a radical polymerization reaction is observed as is shown in Figure 2.11 [31].
Figure 2.11 - Radical polymerization reaction.
The radical initiator transfers its free radical particle to the polymer’s backbone. Then, the backbone is able to be linked with another cross-linker. The network formed has very large units because the R represents a long molecule, and the resulting material is thus soft.
In addition to quantum yield, the efficiency of the polymerization depends on the concentration of the photo-initiator, the intensity of the light source which initiates the reaction, and the temperature of the resin (which changes the molecular mobility and the diffusion during the curing) [32].
The resins have neither the same kinetics of curing nor the same activation energy [33]. Moreover, the life time of the radical and cation are different. Radicals have very short life times because they are very reactive. As a result, one can assume that there are no radicals
when the light is turned off. In contrast, cations have a longer life time and can continue to exist even after the light source is turned off (what is known as dark curing). This is because cations are less reactive and, once activated, can exist and diffuse though the material to react at a later time, even after the light source is turned off [29].
2.6.Post-curing reaction
When a polymer is cured under UV, some parts of the system, which are not reacted, may remain in the system. This might results from limited ability of diffusion for the remaining unreacted components. That is, some of the molecules do not have enough space or sufficient energy to find another molecule to react with. Parameters that effect the number of such molecules include, for example, temperature and viscosity that relate to the molecular mobility of chains and particles, and are often the cause of the final limit of curing [26]. For example, when the mixture temperature is low, the diffusion and mobility of particles is limited. Once the system begins to cure, the viscosity of the system increases and limits the space for the initiator to find a reactive bond to interact with. As a result, the material is not able to be further cured, even if it could be further cured under better conditions. Thermal post-curing after the initial UV curing can be used to provide sufficient energy to the system to allow the finishing of the curing and the stabilization of the material, resulting in better and more stable properties [34].
As explained in section 2.2, radicals have short lives, whereas cations are active longer and continue to exist and initiate the dark curing process. Indeed, the cations can continue to be present and reactive inside the sample, and can diffuse to find a reactive bond to cross-link. This phenomenon is well known for the epoxy resins and has been studied by Golaz et al.
[29]. The radicals do not show this delayed curing as they terminate almost instantaneously after the light is turned off.
To complete the curing and to stabilize the material, it is common to do a thermal post-cure on the samples.
TGA analysis can give an idea of the stability of the sample with the increase of temperature. TGA measures the sample mass when it is being heated. It shows whether there is degradation of the sample with the rise in the temperature. The TGA tests were done by Lena Butterfield at the University of Rouen. Depending on the sample, a post-cure treatment was done on the sample after UV curing that included heating the sample to 90°C or 150°C at 1H in a normal atmosphere.
The TGA results are shown in Figure 2.12. The sample analyzed just after UV curing are presented on curve a. These show that pure resins (in blue) are more stable in this range of temperature. Moreover, a first degradation happens around 100°C. The samples that were post-cured at 150°C showed better stability until 200°C. But after 200°C, the acrylate resin seems to degrade faster than without post-cure.
All curves are presented until complete degradation in Figure 2.13. It is clear that the pure acrylate resin degrades faster after the cure (curves d). It has been shown that the post-cure has a positive effect for epoxy and a negative effect for the acrylate [26]. Also, a second degradation is noted between 400 to 550°C for samples that underwent thermal post-curing (curves c). This second step in TGA is often due to the oxidation of the sample during the post-cure. Oxygen was present during the thermal treatment, and it possibly reacted with the
resins to form peroxides, which degrade after the main degradation. A thermal treatment under neutral atmosphere should remove this effect.
Figure 2.12 - TGA curves from ambient to 350°C (done by Lena Butterfield). a) Samples after UV curing analyzed by TGA; 100/0 is the pure acrylate resin and
0/100 the pure epoxy resin.
b) Samples after post-cure treatment at 150°C during 1H analyzed by TGA; 100/0 is the pure acrylate resin and 0/100 the pure epoxy resin.
Figure 2.13 - TGA curves from ambient to 700°C (done by Lena Butterfield). c) Samples after UV curing analyzed by TGA; 100/0 is the pure acrylate resin and
0/100 the pure epoxy resin.
d) Samples after post-cure treatment at 150°C during 1H analyzed by TGA; 100/0 is the pure acrylate resin and 0/100 the pure epoxy resin.
2.7.Study of reaction kinetics by Fourier Transformed Infrared Spectroscopy (FTIR)
Fourier Transformed Infrared Spectroscopy (FTIR) is based on the measurement of the absorbed rays by a sample [35]. The chemical structure inside the material can be determined from the detection of characteristic vibrations of chemical groups and bonds.
Principle
In FTIR, wavelengths between 4000 cm-1 and 400 cm-1 are used on the sample. When a wavelength matches the vibrational energy of the molecule, the energy is absorbed and the detector records a decrease of reflected or transmitted intensity. The absorbed energy depends on the geometry, and in particular, on the structure of the molecule. The chemical composition of a material is determined by matching the FTIR signal to known characteristic absorption bands of different groups and bonds.
Figure 2.14 - FTIR principle [36].
As shown on the Figure 2.14, the infrared beam is transmitted through the Michelson interferometer which can modulate each wavelength from the beam at different frequencies.
With a combination of mirrors and semi-transparent mirrors, destructive and constructive interferences are produced. The modulated beam is then reflected through the sample, where the absorption phenomenon occurs, and then through the detector to be transformed into an electrical signal. This signal is then analyzed with Fourier transforms, hence the name of the analysis.
FTIR spectroscopy can scan organic and inorganic materials without destructing them.
Sample measurement
Figure 2.15 - Nicolet Avatar 360 FT-IR.
Figure 2.15 shows a picture of the FTIR machine used for the measurements. This instrument has a range between 400 to 4000 cm-1, and its maximum resolution is 0.5 wavenumbers. A Zinc Selenide crystal is used to allow liquid and solid acquisition in reflection.
For the analysis of liquid samples, the mixtures are stored in glass bottles (which can also protect them from UV light). A small drop is deposited on the top of the machine with a clean spatula, and then acquisition is started. For solid samples, a small part from the center is cut and analyzed in a manner similar to liquid samples.
Between each measurement the top of the machine is cleaned with ethanol (which does not damage the crystal).
Calculation of the resin conversion
It is possible to determine the degree of conversion of the thermosetting resin by real-time FTIR [32]. In this method the same part of the resin is measured at different times of curing. One can expect to record the creation or disappearance of chemical functions compared to non-implicated ones. The ratio between a reference peak and the peak under consideration, which normally decreases during the curing, is calculated [26].
Protocol of measurement
FTIR measures properties on thin samples, or films if it is possible. In this case, the sample, which was made as explained above, is cut into very thin part and then analyzed.
The resolution is 4 cm-1 in general, and the number of scans were 16 for uncured samples and 32 for cured samples. The accuracy is better if the number of scans is higher, and it becomes easier to distinguish peaks.
The best way to determine the degree of curing of the resin is to find the peak associated with the chemical bond which reacts during the crosslinking. This peak must be compared to a reference peak which is a non-reactive chemical group during the process. With the normalization of the peaks using the reference, this method provides a quantitative analysis measure of the reaction.
Reference and conversion peaks for the epoxy resin
The spectra obtained for the pure epoxy resin before and after UV curing is shown on the Figure 2.16.
Figure 2.16 - FTIR spectra for pure epoxy resin before and after UV curing.
The equivalent spectrum from the literature is shown in Figure 2.17 for a cycloaliphatic epoxy [29].
Figure 2.17 - Epoxy resin FTIR spectrum. Before UV curing (sample still liquid)
The spectra in the literature matchrs the one obtained by FTIR. In the literature, previous researchers have identified four main bands for a qualitative analysis. The 790 and 750 cm-1 bands are ascribed with the epoxy ring. The decreasing of both proves that this group has reacted to form the network. Increasing of 1080 and 3450 cm-1 bands match the formation of hydroxyl groups (R-OH) during the ring-opening reaction.
Figure 2.18 - Cationic crosslinker.
For the epoxy resin, the bond C=O (shown on Figure 2.18) seems to be a good reference peak at 1725 cm-1, even if it is far from the peaks associated to the epoxy ring and hydroxyl group. It is not reactive to the cationic polymerization, and so the peak’s height is unchanged during the chemical reactions.
Epoxy rings
Figure 2.19 - Analysis of conversion and reference peaks.
Figure 2.19 shows that both spectra have the reference peak (at 1725 cm-1) at the same level allowing a qualitative study. As expected, an increasing of intensity is observed for hydroxyl group (at 1080 cm-1) due to the conversion of the resin. The peak associated with the epoxy resin seems to increase after UV curing. It is difficult to fully understand what is happening since the signal does not seem to return to the baseline, and the reference peak can be too far to allow an accurate analysis. In addition the 790 cm-1 and 3450 cm-1 peaks were not studied since they were not observable.
Reference and conversion peaks for the epoxy resin
The spectra obtained for the pure acrylate resin before and after UV curing are shown on Figure 2.20.
Before UV curing (sample still liquid) After UV polymerization
Epoxy ring Hydroxyl group
Figure 2.20 - FTIR spectra for pure acrylate resin before and after UV curing.
From the literature, it is possible to find FTIR spectra (see Figure 2.21) of Acrylate functional polydimethylsiloxane [37].
Figure 2.21 - FTIR spectrum of Acrylate functional polydimethylsiloxane.
The second spectrum from the literature matches the FTIR analysis of the acrylate resin used, only the intensity of peaks has changed. To study the spectrum, the peaks at 1635 cm-1 and 1610 cm-1 need to be analyzed [38]. The first correspond to the C=C bond from the vinyl ester end groups (see Figure 2.22) and is related to the conversion of the resin. The second is a reference peak which normally does not change during the curing. Moreover, it is reported that the peak at 946 cm-1 correspond to a methacrylate bond (on Figure 2.23) and can also be
Before UV curing (sample still liquid) After UV polymerization
analyzed to determine the reaction conversion. But, this last peak is far from the reference peak, so it is more accurate to use the 1635 cm-1 and 1610 cm-1 peaks.
Figure 2.22 - Acrylate resin molecule.
Figure 2.23 - Methacrylate chemical group.
Figure 2.24 - Analysis of conversion and reference peaks.
Vinyl Ester end groups
Before UV curing (sample still liquid) After UV polymerization
On these spectra (Figure 2.24), the peak at 1635 cm-1 disappears after UV curing and shows good conversion of the resin with reaction of the vinyl ester end group, compared to the non-cure acrylate resin in blue.
Analysis of 50/50 composition ratio
The FTIR analyses of pure resin before and after UV polymerization have allowed identifying peaks related to conversion. These peaks are now studied for a mixture of 50/50 of the resins.
Figure 2.25 - Epoxy resin conversion studied by FTIR for 50/50 mixture.
On Figure 2.25, the peak at 750 cm-1 related to the epoxy ring completely disappears after the UV curing.
Reference peak
Epoxy ring Before UV curing (sample still liquid)
Figure 2.26 - Acrylate resin conversion studied by FTIR for 50/50 mixture
On Figure 2.26, the peak at 1635 cm-1 related to the vinyl ester end group also completely disappears after the UV curing. Thus, the conclusion for this mixture is that both resins are fully cured after the UV exposure. The presence of non-cured compounds is not identified. We expect the best possible properties for this system due to complete network formation.
No new peaks, other than those previously observed in the pure resins, were noticed in the mixture. On the other hand, it is difficult to do an accurate quantitative analysis based on the degree of conversion of each resin. For instance, the peak related to the epoxy ring does not return to the baseline and it is a mixed with narrow peaks. Other techniques such as real time FTIR are more accurate for studying the degree of conversion. Indeed, this technique allows studying the same area during the polymerization and a reference peak is not necessary. But the difficulty is to expose the sample to UV under N2 atmosphere during spectra recording.
Reference peak Vinyl ester bond
Before UV curing (sample still liquid) After UV polymerization
To conclude this chapter, the protocol proposed for IPN design was successful in curing two different resins in the same sample. TGA curves have shown that the sample stability is better after thermal treatment under neutral atmosphere. The FTIR spectra have allowed identifying the reactive bond peaks, which can be later studied for the mixtures. The full characterization of the IPNs constructed from these components will be described in the following chapter.
Chapter 3:
Evidence of the IPN development
This chapter is focused on the verification that the protocol developed and the samples made were true IPNs. For this determination, samples with different ratios of acrylate and epoxy were produced and characterized using Atomic Force Microscopy (AFM), Fourier-Transform Infra-Red spectroscopy (FTIR), and Differential Scanning Calorimetry (DSC), and mechanical testing. AFM analysis provides a visible picture of phase separation through surface topography and phase angle shifts. FTIR provides a method for identifying the bonds in the system. DSC analysis provides the thermal response of the material indicating whether the system is responding as one integrated system or two separate systems. Finally, mechanical tests indicate whether the there are any weak surfaces of interaction, characteristic of phase separation, partial phase separation, or flaw formation.
3.1.Samples and sample preparation
Figure 3.1 shows the series of samples produced for the following characterization. These samples were obtained by photo-curing of the initial mixture of the photo-initiators and cross-linkers under a polychromatic light source and in an N2 atmosphere. Liquid resins and mixture
of resins, associated with their respective photo-initiators, were put in the mold. The mold was put under a polychromatic UV lamp. The image shown in the figure was obtained just after curing of the system under the polychromatic light and removal of the samples from the mold. The samples indicate that the systems were completely cured. All samples looked solid. After
removal from the mold, the dimensions of the samples remained approximately constant and approximately identical to the size of the mold. Each sample was approximately 7 x 30 x 5 mm3.
Figure 3.1 - Images of samples with different acrylate/epoxy ratios obtained according to the curing process described in Section 2.4.
The compositions are A = 100% acrylate resin, B = 90/10 (acrylate/epoxy), C = 80/20, D = 70/30, E = 60/40, F = 50/50, G = 40/60, H = 30/70, I = 20/80, J = 10/90 and K = 100% epoxy resin
Direct observation of the samples shows a lack of bubbles, a yellow color as expected for samples containing only epoxy resin, and the samples seem very homogeneous. The yellow color is the result of the addition of the cationic photo-initiator which is yellow. Noticeable shrinkage is only observed for the pure epoxy resin sample that has a sample size that is slightly smaller than the mold size. The expected percentage of volume change has been
modeled by Fan et al. [39] and shows a volume change of around 15% at room temperature
and of 22% for 225°C. From these initial observations, it seems possible to get a solid photo-cured sample using a polychromatic light source. In particular, this light source seems to cure this blend of two thermosetting resins and associated photo-initiators.
3.2.AFM microscopy to identify phase separation
Figure 3.2 to Figure 3.4 show AFM images obtained in the tapping mode from the cross-section of the samples obtained by cryo-cracking (freezing in liquid Nitrogen and then
cracked). These images were obtained by Wenlong Li (from the MME Department of the University of Nebraska-Lincoln). In each case, the figure on the left provides the topography (height) and the figure on the right provides the phase angle (an indication of the rigidity). A bright point in each image indicates a high value while a dark point indicates a low value.
Figure 3.2 - AFM pictures for pure resins.
a) AFM picture of the bulk of the pure Acrylate resin on 4 µm², Z range 100 nm for the height and 50° for the phase.
b) AFM picture of the pure Epoxy resin on 1 µm², Z range 30 nm for the height and 20° for the phase.
Figure 3.2 a) shows the surface after curing of the pure Acrylate sample and Figure 3.2 b) shows the surface of the pure Epoxy sample. These figures should be used as references when considering the images obtained of the mixtures. The pure Acrylate system shows a fairly smooth variation of topography with continuous variation of properties that are closely correlated. This indicates a fairly homogenous sample at the micron scale. The pure Epoxy shows smaller variation of both surface topography and phase angle, yet the phase changes are much more abrupt. The average change of phase angle observed in the Acrylate is 4.8° while that observed in the Epoxy is 7.3°, indicating that the variation in properties is small in both cases.
Figure 3.3 and Figure 3.4 show the cross-section of the samples cured from mixtures of acrylate and epoxy. These are the samples that were built from 80/20, 50/50 and 20/80 mixtures of acrylate/epoxy. All these mixtures showed variation in topology and phase angle similar to that of the pure systems. The 80/20 (acrylate/epoxy) sample has a phase difference of 4.8°, whereas the 50/50 has 6.9° and the 20/80 sample has 4.7°, all similar to the pure systems. Thus, the mixtures show identical variation in phase angle as the pure systems. A point to note in the phase angle plots is the appearance of very bright spots that correlate with high points in the samples. Such points in the phase angle figure are normally ignored since they result from indenter twisting, and are possibly not related to the behavior of the material. The AFM figures indicate that the cured mixtures are fairly uniform (homogeneous).
Figure 3.3 - AFM pictures for 80/20 and 50/50 composition ratios.
c) AFM picture of the 80/20 (Acrylate/Epoxy resins) on 1 µm², Z range 20 nm for the height and 35° for the phase.
d) AFM picture of the 50/50 (Acrylate/Epoxy resins) on 4 µm², Z range 300 nm for the height and 100° for the phase.
Figure 3.4 - AFM picture for 20/80 composition ratio.
Evaluation of the AFM figures indicates that no phase separation is observed in the mixtures [40]. This is best seen when looking at an example of phase separation. This is shown in Figure 3.5 for the phase separation of nanometer films of ternary polymer blends (deuterated polystyrene dPS, poly(2-vinylpyridine) PVP and poly(methyl methatcrylate) PMMA). In this figure you see images from normal (AFM, picture a) and lateral force microscopy (LFM, picture b) of polymer blends from M. Szymonski et al. [41] that are obtained (simultaneously) on a thin layer of PMMA/dPS/PVP polymer blend. Cross sections (P) made in AFM and LFM images are presented in (c) and (d) respectively. Black, gray and white colors in LFM image correspond to regions rich in PVP, PMMA and dPS polymers.
![Figure 1.2 - Difference between thermoplastic and thermosetting polymers [10].](https://thumb-us.123doks.com/thumbv2/123dok_us/844851.2607435/16.892.228.667.274.488/figure-difference-thermoplastic-thermosetting-polymers.webp)