Lehigh University
Lehigh Preserve
Theses and Dissertations
2014
Mechanical Properties and Microstructural
Evolution of Welded Eglin Steel
Brett Leister Lehigh University
Follow this and additional works at:http://preserve.lehigh.edu/etd Part of theMaterials Science and Engineering Commons
This Dissertation is brought to you for free and open access by Lehigh Preserve. It has been accepted for inclusion in Theses and Dissertations by an authorized administrator of Lehigh Preserve. For more information, please [email protected].
Recommended Citation
Leister, Brett, "Mechanical Properties and Microstructural Evolution of Welded Eglin Steel" (2014).Theses and Dissertations.Paper 1537.
Mechanical Properties and Microstructural
Evolution of Welded Eglin Steel
By
Brett M. Leister
Presented to the Graduate and Research Committee Of Lehigh University
In Candidacy for the Degree of Doctor of Philosophy
In
Materials Science and Engineering
Lehigh University September 2014
ii
© Copyright 2014 by Brett Matthew Leister All Rights Reserved
iii
Dissertation Signature Sheet
Approved and recommended for acceptance as a dissertation in partial fulfillment of the requirements for the degree of Doctor of Philosophy.
___________________________ Date
___________________________ Dr. John N. DuPont, Dissertation Director
___________________________ Accepted Date
Committee Members:
___________________________ Dr. John N. DuPont, Professor, Lehigh University
___________________________ Dr. Richard P. Vinci, Professor, Lehigh University
___________________________ Dr. Masashi Watanabe, Professor, Lehigh University
___________________________ Dr. Rachel A. Abrahams, Research Scientist, Eglin Air Force Base
iv
Acknowledgements
First and foremost, I want to acknowledge my advisor, Dr. John DuPont. He has helped me grow and develop personally and professionally. His door was always open to discuss various aspects of research projects and also as a mentor through various aspects of life. You have made me into a better engineer, scientist, and person than I thought I could be. I would like to thank my parents and my older brother, for everything they’ve ever done for me. I can say with certainty that without their sacrifices for my education and personal growth I would not have accomplished what I have today. I would also like to thank the rest of my family for always being there for me through the good times and bad. Members of the Engineering Metallurgy Group, past and present: Ken Adams, Jeff Farren, Andrew Stockdale, Greg Brentrup, Dan Bechetti, Jon Galler, Jason Bono, Rob Hamlin, and Erin Barrick. You have all been there as a sounding board for all ideas (good and ridiculous) that I’ve had over the past six years. You’ve all been great lunch buddies and even better people. A special thank you to Jeff Farren for being a second mentor throughout my time in graduate school. This project would not have been completed as smoothly without your help and guidance. I would next like to thank the members of my Ph.D. committee, Dr. Rachel Abrahams, Dr. Masashi Watanabe, and Dr. Richard Vinci. All three of you have always been available to discuss the approach and results for this project, and each of you have provided professional guidance that has been invaluable. Mike Rex and John Gregoris for machining hundreds and hundreds of samples throughout my time here, and for being a good place to talk when I needed to vent. Sue Stetler for all of the
v
FedEx and POs that were sent at any time during the week. Janie Carlin for any number of things I have asked for over the past ten years in the department. Bill Mushock and Rob Keyse for your support of all research I did on the microscopes. None of this would have been possible without funding from DOTC initiative, DOTC-09-01-INIT120, and the project management of Lt. Chad Hossier and Lt. Daniel McFadden. Synchrotron X-ray diffraction work was performed using the Advanced Photon Source, an Office of Science User Facility operated for the U.S. Department of Energy (DOE) Office of Science by Argonne National Laboratory, and was supported by the U.S. DOE under Contract No. DE-AC02-06CH11357. Further acknowledgement of Dr. Sungsik Lee and Dr. Benjamin Reinhart is necessary for their assistance during diffraction experiments. To the rest of my friends over the last decade of study, you’ve made it all possible. Thank you so much for keeping me sane and motivated. Finally, a special acknowledgement to Arlan Benscoter, who introduced me to Materials Science in the fall of 2004. His expertise, patience, and guidance have allowed me to make a seamless transition from the world of Mechanical Engineering. Thanks again!
vi
Table of Contents
List of Tables ... viii
List of Figures ... ix Abstract ... 1 Chapter 1: Introduction ... 3 1.1 Retained Austenite ... 5 1.2 ε-carbides ... 16 1.3 Cementite ... 18 1.4 Embrittlement ... 21 1.5 Weldability ... 23
Chapter 2: Development of a Continuous Cooling Transformation Diagram for Eglin Steel ... 30 2.1 Abstract ... 30 2.2 Introduction ... 30 2.3 Procedure ... 32 2.4 Results ... 34 2.5 Discussion ... 44 2.6 Conclusions ... 48
vii
Chapter 3: Mechanical Properties and Microstructural Evolution of Simulated Heat
Affected Zones in Wrought Eglin Steel ... 50
3.1 Abstract ... 50 3.2 Introduction ... 51 3.3 Procedure ... 53 3.4 Results ... 58 3.5 Discussion ... 94 3.6 Conclusions ... 103 Future Work ... 106 References ... 109 Appendix of Figures ... 113 Vita ... 118
viii
List of Tables
Table 1: Compositions of various ultra-high strength alloys. All compositions except Eglin can be found in Metals and Alloys in the Unified Numbering System3. .... 5
Table 2: Summary of tempered martensite embrittlement phenomena including amount of retained austenite and toughness loss.8 ... 15
Table 3: Composition (wt. percent) and mechanical properties of Eglin steel 31 Table 4: Composition (wt. percent) of Eglin Steel ... 52 Table 5: Summary of mechanical properties, fractography, TEM and synchrotron X-ray diffraction results for Eglin steel base metal and simulated HAZ samples. ... 93
ix
List of Figures
Figure 1: As-quenched structure of 300M steel showing (a) lath martensitic structure in a bright field TEM micrograph and (b) retained austenite (white) films in the interlath regions of the martensitic structure in a dark field TEM micrograph of the same region.8 ... 7
Figure 2: Isothermal section (950 °C) of Fe-C-P phase diagram. Arrow indicates that austenite stability decreases with increasing phosphorus content.5 ... 9
Figure 3: Hardness and charpy impact toughness of Eglin steel as a function of chemistry and heat treatment.2 ... 10
Figure 4: ε’ shear bands in austenite formed by plastic strain with the overlaps forming nucleation sites for the formation of α’ martensite.12
... 11 Figure 5: A schematic diagram of a crack propagating through martensite towards a retained austenite boundary along with a plot of elastic energy as a function of angle showing that the NW variant is more energetically favorable than the KS variant for all angles.13 ... 12
Figure 6: Fracture toughness as a function of tempering temperature for 4340 and 4340 + 1.3Si.8 ... 15
Figure 7: TEM micrograph showing precipitation of ε-carbides in Fe-0.013C steel tempered at 200 °C for 6 hours.14... 17
Figure 8: In-situ SEM micrograph showing formation of shear bands along row of cementite particles in HY-100 steel.18 ... 20
x
Figure 9: TEM micrograph of 5.5Ni steel plated with Ni (top half of image) with fracture surface highlighted by downward pointing arrows.21 ... 22
Figure 10: Schematic illustrations showing the three failure modes possible due to tempered martensite embrittlement.8 ... 23
Figure 11: Location and morphology of MA constituent for a ultra-high strength steels with compositions similar to Eglin with (a) and (b) showing the MA constituent in a necklace structure with (c) showing complete transformation along the PAGB.26 ... 26
Figure 12: Charpy toughness as a function of second thermal cycle peak temperature for HSLA steels showing lowest toughness in the intercritically reheated CGHAZ.27 ... 26
Figure 13: Plot of hardness vs. distance in a full-scale weld with 4.31 kJ/mm heat input and CGHAZ Δt8-5 = 36.5 s.29 ... 27
Figure 14: Charpy toughness vs. test temperature for simulated CGHAZs showing a decrease in toughness associated with increased cooling time.29 ... 28
Figure 15: Influence of austenitizing temperature on (a) hardness, (b) yield strength, (c) tensile strength, and (d) percent elongation for 0.3C-CrMoV steel.32 ... 29
Figure 16: Representative dilatometry (dashed line) and differentiated (solid line) dilatometry curves used to determine transformation temperatures in Eglin steel. (a) A predominantly martensitic transformation, (b) a mixed martensitic/bainitic transformation, (c) a fully bainitic transformation, (d) a mixed pearlitic/bainitic transformation. ... 35
xi
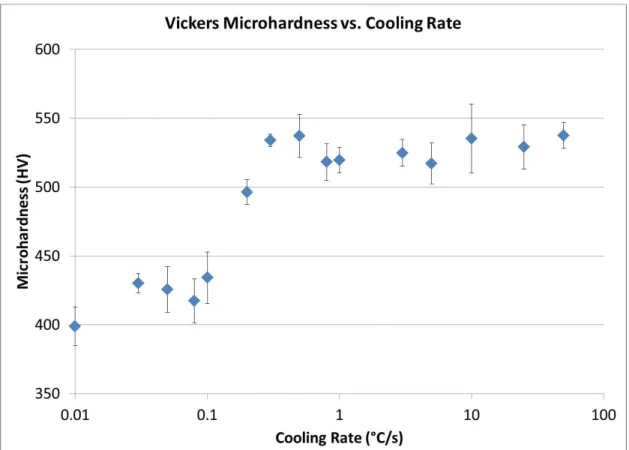
Figure 17: Plot of Vickers microhardness as a function of cooling rate for Eglin steel. ... 36
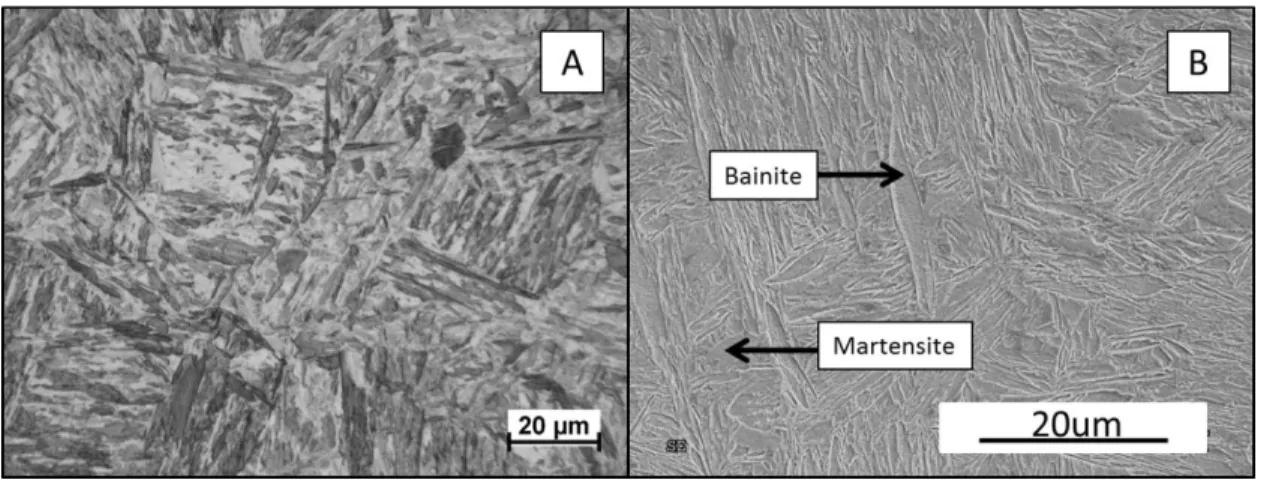
Figure 18: (a) Light optical and (b) scanning electron micrographs of Eglin steel cooled at 50 °C/s showing a large amount of martensite with a small amount of bainite. ... 38
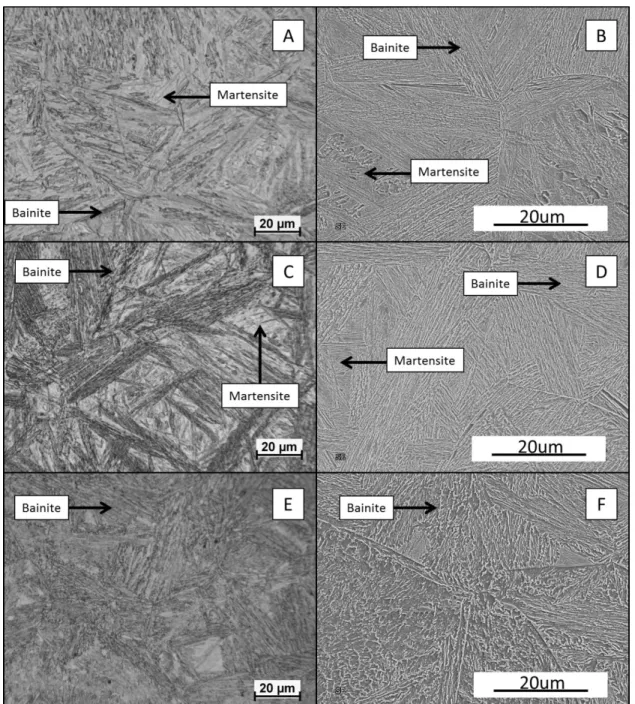
Figure 19: Light optical and scanning electron micrographs of Eglin steel cooled at 0.3 °C/s (A and B), 0.2 °C/s (C and D), and 0.1 °C/s (E and F) showing a mixed martensitic and bainitic microstructure. ... 39
Figure 20: (a) Light optical and (b) scanning electron micrographs of Eglin steel cooled at 0.03 °C/s showing an entirely bainitic microstructure. ... 40
Figure 21: (a) Light optical and (b) scanning electron micrographs of Eglin steel cooled at 0.01 °C/s showing a large amount of bainite with a small amount of pearlite at the prior austenite grain boundaries. ... 40
Figure 22: Microhardness of martensite and bainite phases within Eglin steel cooled at (a) 50 °C/s, (b) 0.3 °C/s, (c) 0.2 °C/s, and (d) 0.1 °C/s. ... 41
Figure 23: Equilibrium Thermocalc calculations showing (a) phase fraction of austenite in Eglin steel as a function of temperature and (b) mass fraction of carbon within austenite. ... 42
Figure 24: Equilibrium Thermocalc calculation of phase fraction as a function of temperature showing phases of austenite, ferrite, and carbide phases that are predicted to form during heating and cooling of Eglin steel. ... 43
xii
Figure 27: Dilatometry plots showing the phase transformation temperatures of Eglin steel upon heating for different heating rates of (a) 220 °C/s and (b) 3400 °C/s. ... 54 Figure 28: SOAR thermal cycles with 1500 J/mm heat input. ... 54 Figure 29: Charpy impact toughness as a function of tempering temperature for Eglin steel. ... 55
Figure 30: Sample geometry used for tensile tests of simulated heat affected zone specimens with (a) ASTM specification geometry and (b) custom DRS geometry. Note: all dimensions are in mm. ... 56
Figure 31: Mechanical properties of as-simulated Eglin steel showing the effect of thermal cycle peak temperature and sample geometry on (a) yield strength, (b) tensile strength, (c) percent reduction in area, (d) charpy impact toughness. ... 59
Figure 32: Light optical micrographs, scanning electron micrographs, and scanning electron fractographs of Eglin steel base metal and heat affected zones in the as-simulated condition. Arrows indicate as-quenched martensite at the prior austenite grain boundary in the ICHAZ sample. The fracture surfaces shown are from the broken charpy specimens. ... 61
Figure 33: Mechanical properties of Eglin Steel showing the effect of post-weld heat treatment on (a) yield strength, (b) tensile strength, (c) percent reduction in area, and (d) charpy impact toughness. ... 63
Figure 34: Scanning electron fractographs of Eglin steel base metal in the (a) as-simulated condition, and following PWHTs of (b) 200 °C / 1 hour, (c) 200 °C / 4
xiii
hours, (d) 700 °C / 1 hour, and (e) 700 °C / 4 hours. Note: the fracture surfaces are from charpy specimens. ... 65
Figure 35: Scanning electron fractographs of the SCHAZ in Eglin steel in the (a) as-simulated condition, and following PWHTs of (b) 200 °C / 1 hour, (c) 200 °C / 4 hours, (d) 700 °C / 1 hour, and (e) 700 °C / 4 hours. Note: the fracture surfaces are from charpy specimens. ... 66
Figure 36: Scanning electron fractographs of the ICHAZ in Eglin steel in the (a) as-simulated condition, and following PWHTs of (b) 200 °C / 1 hour, (c) 200 °C / 4 hours, (d) 700 °C / 1 hour, and (e) 700 °C / 4 hours. Note: the fracture surfaces are from charpy specimens. ... 67
Figure 37: Scanning electron fractographs of the FGHAZ in Eglin steel in the (a) as-simulated condition, and following PWHTs of (b) 200 °C / 1 hour, (c) 200 °C / 4 hours, (d) 700 °C / 1 hour, and (e) 700 °C / 4 hours. Note: the fracture surfaces are from charpy specimens. ... 68
Figure 38: Scanning electron fractographs of the CGHAZ in Eglin steel in the (a) as-simulated condition, and following PWHTs of (b) 200 °C / 1 hour, (c) 200 °C / 4 hours, (d) 700 °C / 1 hour, and (e) 700 °C / 4 hours. Note: the fracture surfaces are from charpy specimens. ... 69
Figure 39: Synchrotron X-ray diffraction spectra for Eglin steel showing (a) presence of retained austenite in FGHAZ, (b) lack of carbides in samples in the as-simulated condition, (c) presence of retained austenite and M23C6 carbides in PWHT
xiv
samples, and (d) presence of M2C and M7C3 carbides in the FGHAZ and CGHAZ
PWHT samples. ... 71 Figure 40: Tempered martensite microstructure seen in Eglin steel base metal with (a) bright field TEM micrograph, (b) dark field TEM micrograph with arrows indicating ε-carbides, (c) theoretical SAED pattern for martensite and ε-carbide using the Jack orientation relationship, and (d) the SAED pattern taken from the area shown in (a) with the arrow indicating the spot used to obtain the dark field image in (b). ... 74
Figure 41: Virgin martensite microstructure seen in the FGHAZ in the as-simulated condition with (a) bright field TEM micrograph, (b) dark field TEM micrograph with retained austenite showing as bright white films at the lath boundaries, and (c) the SAED pattern from the area in (a) and the arrow indicating the area used to obtain the dark field image in (b). ... 76
Figure 42: Autotempered martensite microstructure seen in the CGHAZ in the as-simulated condition with (a) bright field TEM micrograph showing autotempered martensite lath, (b) higher magnification image showing ε-carbides within the lath, (c) theoretical SAED pattern for martensite and ε-carbide using the Jack orientation relationship, and (d) the SAED pattern taken from the area shown in (a). ... 77
Figure 43: Autotempered martensite microstructure seen in the CGHAZ in the as-simulated condition with (a) bright field TEM micrograph, (b) dark field TEM micrograph with retained austenite showing as bright white spots at the lath boundaries, and (c) the SAED pattern from the area in (a) and the arrow indicating the area used to obtain the dark field image in (b). ... 78
xv
Figure 44: Tempered martensite microstructure seen in the FGHAZ following a 700 °C / 1 hour heat treatment with (a) bright field TEM micrograph showing tempered martensite laths with cementite, (b) dark field TEM micrograph showing the cementite decorating the interlath regions, (c) theoretical SAED pattern for martensite and cementite using the Bagaryatski orientation relationship and (d) the SAED pattern taken from the area shown in (a) and the arrow indicating the spot used to obtain the dark field micrograph shown in (b). ... 79
Figure 45: Tempered martensite microstructure seen in the ICHAZ following a 700 °C / 4 hour heat treatment with (a) bright field TEM micrograph showing tempered martensite laths with M23C6 carbides, (b) dark field TEM micrograph
showing the M23C6 evenly distributed throughout the microstructure, (c) theoretical
SAED pattern for martensite and M23C6 using the Kurdjumov-Sachs orientation
relationship and (d) the SAED pattern taken from the area shown in (a) and the arrow indicating the spot used to obtain the dark field micrograph shown in (b). ... 81
Figure 46: TEM micrograph of the CGHAZ following a 700 °C / 4 hour PWHT showing second-phase particles decorating the prior austenite grain boundary. ... 83 Figure 47: Tempered martensite microstructure seen in the CGHAZ following a 700 °C / 4 hour heat treatment with (a) bright field TEM micrograph showing carbides at the prior austenite grain boundary, (b) EDS spectrum of the carbide labeled by an arrow in (a) showing a enrichment in W and Mo, (c) theoretical SAED pattern for martensite and cementite using the Bagaryatski orientation relationship and (d) the
xvi
SAED pattern taken from the area shown in (a). The excess spots shown in (d) are due to the multiple orientations of the cementite particle. ... 84
Figure 48: Tempered martensite microstructure seen in the CGHAZ following a 700 °C / 4 hour heat treatment with (a) bright field TEM micrograph showing carbides at the prior austenite grain boundary, (b) EDS spectrum of the carbide labeled by an arrow in (a) showing a enrichment in Cr, (c) theoretical SAED pattern for martensite and M23C6 using the Kurdjumov-Sachs orientation relationship and (d) the
SAED pattern taken from the area shown in (a). Note: The two grains on each side of the carbide are labeled as (1) and (2) in (a) and (c). ... 85
Figure 49: MatCalc simulation showing the evolution of the volume fraction of carbides over time in the base metal of Eglin steel during the initial heat treatment. .. 87
Figure 50: MatCalc simulation showing the evolution of the volume fraction of carbides over time in the FGHAZ of Eglin steel during the weld thermal cycle. ... 88
Figure 51: MatCalc simulation showing the evolution of the volume fraction of carbides over time in the CGHAZ of Eglin steel during the weld thermal cycle. ... 89
Figure 52: MatCalc simulation showing the evolution of the volume fraction of carbides over time in the FGHAZ of Eglin steel during a post-weld heat treatment of 700 °C / 1 hour. Note: The starting conditions for the simulation were taken directly from the simulation results of the FGHAZ following the weld thermal cycle. ... 90
Figure 53: MatCalc simulation showing the evolution of the volume fraction of carbides over time in the ICHAZ of Eglin steel during a post-weld heat treatment of
xvii
700 °C / 4 hours. Note: The starting conditions for the simulation were taken directly from the simulation results of the ICHAZ following the weld thermal cycle. ... 91
Figure 54: MatCalc simulation showing the evolution of the volume fraction of carbides over time in the CGHAZ of Eglin steel during a post-weld heat treatment of 700 °C / 4 hours. Note: The starting conditions for the simulation were taken directly from the simulation results of the CGHAZ following the weld thermal cycle. ... 92
Figure 55: Light optical micrographs of Eglin steel base metal in the (a) as-simulated condition, and following PWHTs of (b) 200 °C / 1 hour, (c) 200 °C / 4 hours, (d) 700 °C / 1 hour, and (e) 700 °C / 4 hours. ... 113
Figure 56: Light optical micrographs of the SCHAZ in Eglin steel in the (a) as-simulated condition, and following PWHTs of (b) 200 °C / 1 hour, (c) 200 °C / 4 hours, (d) 700 °C / 1 hour, and (e) 700 °C / 4 hours. ... 114
Figure 57: Light optical micrographs of the ICHAZ in Eglin steel in the (a) as-simulated condition, and following PWHTs of (b) 200 °C / 1 hour, (c) 200 °C / 4 hours, (d) 700 °C / 1 hour, and (e) 700 °C / 4 hours. ... 115
Figure 58: Light optical micrographs of the FGHAZ in Eglin steel in the (a) as-simulated condition, and following PWHTs of (b) 200 °C / 1 hour, (c) 200 °C / 4 hours, (d) 700 °C / 1 hour, and (e) 700 °C / 4 hours. ... 116
Figure 59: Light optical micrographs of the CGHAZ in Eglin steel in the (a) as-simulated condition, and following PWHTs of (b) 200 °C / 1 hour, (c) 200 °C / 4 hours, (d) 700 °C / 1 hour, and (e) 700 °C / 4 hours. ... 117
1
Abstract
Eglin steel is a new ultra-high strength steel that has been developed at Eglin Air Force Base in the early 2000s. This steel could be subjected to a variety of processing steps during fabrication, each with its own thermal history. This article presents a continuous cooling transformation diagram developed for Eglin steel to be used as a guideline during processing. Dilatometry techniques performed on a Gleeble thermo-mechanical simulator were combined with microhardness results and microstructural characterization to develop the diagram. The results show that four distinct microstructures form within Eglin steel depending on the cooling rate. At cooling rates above about 1 °C/s, a predominately martensitic microstructure is formed with hardness of ~520 HV. Intermediate cooling rates of 1 °C/s to 0.2 °C/s produce a mixed martensitic/bainitic microstructure with a hardness that ranges from 520 – 420 HV. Slower cooling rates of 0.1 °C/s to 0.03 °C/s lead to the formation of a bainitic microstructure with a hardness of ~420 HV. The slowest cooling rate of 0.01 °C/s formed a bainitic microstructure with pearlite at the prior austenite grain boundaries.
A comprehensive study was performed to correlate the mechanical properties and the microstructural evolution in the heat affected zone of thermally simulated Eglin steel. A Gleeble 3500 thermo-mechanical simulator was used to resistively heat samples of wrought Eglin steel according to calculated thermal cycles with different peak temperatures at a heat input of 1500 J/mm. These samples underwent mechanical
2
testing to determine strength and toughness, in both the ‘as-simulated’ condition and also following post-weld heat treatments. Mechanical testing has shown that the inter-critical heat affected zone (HAZ) has the lowest strength following thermal simulation, and the fine-grain and coarse-grain heat affected zone having an increased strength when compared to the inter-critical HAZ. The toughness of the heat affected zone in the as-simulated condition is lower than that of the base metal. Post-weld heat treatments (PWHT) have been shown to increase the toughness of the HAZ, but at the expense of strength. In addition, certain combinations of PWHTs within specific HAZ regions have exhibited low toughness caused by tempered martensite embrittlement or intergranular failure. Synchrotron X-ray diffraction data has shown that Eglin steel has retained austenite in the fine-grain HAZ in the as-simulated condition. In addition, alloy carbides (M23C6, M2C, M7C3) have been observed in the diffraction spectra for
the fine-grain and coarse-grain HAZ following a PWHT of 700 °C / 4 hours. A first attempt at thermodynamic modeling has been undertaken using MatCalc to try to predict the evolution of carbides in the HAZ following thermal cycling and PWHT.
3
Chapter 1: Introduction
Eglin steel is a new patented material1 that will be considered for use in a variety of high strain rate applications. It was developed with the intention of having the same ultrahigh strength and toughness properties of materials such as Co-and Ni-containing alloys AerMet100, HP 9-4-20, HP 9-4-30, and AF1410, with substantially reduced cost and processing times2. The compositions of these four alloys, along with 4340 and 300M can be seen in Table 1. According to the patent document for Eglin steel, silicon is introduced to enhance toughness by making cementite precipitation sluggish at the tempering temperatures used for Eglin steel, vanadium and nickel are included to increase toughness, chromium is included to enhance strength and hardenability, molybdenum is included to enhance hardenability, and tungsten is included to enhance strength and wear resistance1.
In order for high strain rate components to be fabricated, a comprehensive understanding of the weldability of Eglin steel must be made, including: fusion zone composition and properties, HAZ microstructure and properties, and transformation temperatures on heating and cooling. Although Eglin is a Q&T steel, the toughness in the HAZ is contrary to what is typically seen. The CGHAZ of Eglin steel shows the highest toughness of the HAZ, but the CGHAZ of Q&T steels typically have the lowest toughness. The impact of processing parameters on microstructural features such as retained austenite, ε-carbides, cementite (M3C) formation is an important point
4
metallurgy of related alloys is critical in aiding the understanding of how Eglin gains its strength and toughness since a comprehensive welding study for Eglin steel does not yet exist. The information gathered from similar alloys can then be used as a starting point for optimizing welding parameters to achieve peak strength and toughness levels in Eglin steel. The goals of this research are to (1) fully understand the metallurgical factors governing property changes through the HAZ of welded Eglin steel, (2) perform thermodynamic and kinetic modeling to simulate the formation and growth of carbides in the HAZ during a weld thermal cycle that can be used for future Eglin welding studies, and (3) use knowledge of these factors to develop appropriate welding parameters and/or implement a post-weld heat treatment to retain properties in the HAZ.
5
Table 1: Compositions of various ultra-high strength alloys. All compositions except Eglin can be found in
Metals and Alloys in the Unified Numbering System3.
1.1 Retained Austenite
Materials such as 4340, 300M, and Eglin steel have a microstructure consisting of quenched and tempered martensite with retained austenite, and the amount of retained austenite will increase with increasing austenitizing temperature2,4,5. It should be noted that while a comparison is being made between these three alloys, both 4340 and 300M have higher carbon contents (0.40 wt. percent vs. 0.26 wt. percent in Eglin) which leads to the formation of both lath and plate martensite. In the case of Eglin steel (ES-1c), the amount of retained austenite increases from 4 to 6 percent by increasing the austenitizing temperature from 900-1010 °C because the higher austenitizing temperature dissolved the carbides providing an increased amount of carbon in solution2, thus increasing the stability of the austenite6. It should be noted
Alloy Composition (weight percent)
C Mn Si Ni Cr Mo V Co W Eglin Steel 0.26 0.65 1.00 1.00 2.70 0.42 0.10 ---- 1.00 AerMet® 100 0.21- 0.25 0.10 max 0.10 max 10.5- 12.5 2.85- 3.35 ---- ---- 12.5- 14.5 ---- HP 9-4-20 0.17- 0.23 0.20- 0.40 0.20 max 8.50- 9.50 0.65- 0.85 0.90- 1.10 0.06- 0.12 4.25- 4.75 ---- HP 9-4-30 0.28- 0.34 0.10- 0.35 0.10 max 7.00- 8.50 0.90- 1.10 0.90- 1.10 0.06- 0.12 4.00- 5.00 ---- AF1410 0.13- 0.17 0.10 max 0.10 max 9.50- 10.50 1.80- 2.20 0.90- 1.10 ---- 13.5- 14.5 ---- 4340 0.38- 0.43 0.60- 0.80 0.15- 0.30 1.65- 2.00 0.70- 0.90 0.20- 0.30 ---- ---- ---- 300M 0.38- 0.46 0.60- 0.90 1.45- 1.80 1.65- 2.00 0.70- 0.95 0.30- 0.65 0.05 min ---- ----
6
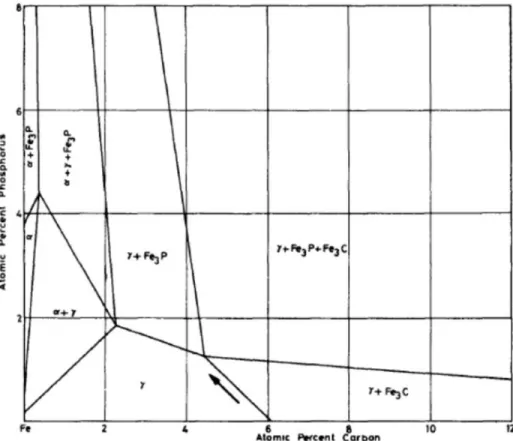
that there is a tradeoff because the material should be austenitized at a temperature that is high enough to dissolve all of the carbides, but low enough to prevent grain growth as this will affect strength and toughness4. The retained austenite reported in these alloys is always found between the martensite laths7 and is typically 100-200 Å thick for 300M8. Therefore, the only way to observe the interlath retained austenite is by using diffraction and dark field analysis via TEM4. Figure 1 shows TEM micrographs for an as-quenched 300M steel exhibiting (a) the lath martensite structure as observed with bright field TEM and (b) the same region observed using dark field TEM showing the interlath retained austenite as white films8. Although an increased amount of carbon in solution is shown to increase the amount of retained austenite, increased amounts of tramp elements (e.g. phosphorus) have been shown to decrease the amount of retained austenite. This is shown in the isothermal section of the Fe-C-P phase diagram in Figure 2 presented by Hyde et al.5. If the carbon level is held constant, and the phosphorus level is increased, the austenite stability is decreased. If the amount of retained austenite decreases, the amount of martensite will increase (depending on cooling rate) to compensate. In addition to potential embrittlement, which will be discussed later, this illustrates the importance of alloy cleanliness during the processing of the steel.
7
Figure 1: As-quenched structure of 300M steel showing (a) lath martensitic structure in a bright field TEM micrograph and (b) retained austenite (white) films in the interlath regions of the martensitic structure in a dark field TEM micrograph of the same region.8
The amount of retained austenite is important because of the influence that it has on toughness. Thermally stable retained austenite will lower strength and hardness while increasing toughness4,6,9. Retained austenite is said to be thermally stable if it does not carbides do not precipitate from it when re-heated to a given temperature below Ac1.In
addition, it is considered thermally stable if it does not undergo a phase change during the same reheating. The decrease in hardness and increase in toughness for Eglin steel
8
was quantified by Paules et al.2 and shown in Figure 3. Recall that an increased austenitizing temperature from 900 to 1010 °C increased the amount of retained austenite by 2 percent. According to Sastry, there are two main mechanisms responsible for the toughness increase due to retained austenite10. Each of these mechanisms depends on the stability of the retained austenite in the presence of a mechanical load. The first mechanism is TRIP and results from the transformation of austenite to martensite. This transformation is greatly dependent on the thermodynamic stability of the retained austenite under applied stress and the timing of the transformation6. If the transformation occurs before the crack reaches the retained austenite, this transformation could be detrimental due to the crack now being able to propagate through less tough as-quenched martensite compared to the tougher retained austenite, which would lead to a decrease in bulk toughness. This transformation could also be detrimental if, instead of converting to lath martensite, the austenite transforms to plate martensite4. Transformation to plate martensite is detrimental because there is more carbon in plate martensite, which creates a higher lattice strain. In addition, a crack can propagate from one end of a plate to the other very quickly because of the brittle nature of the plate as well as having very fewer obstacles to crack propagation. Note that Eglin steel contains 0.26 wt. percent C and plate martensite forms in alloys with greater than 0.4 wt. percent C. Conversely, if the crack tip reaches the austenite at the same time as the phase change from austenite to lath martensite occurs, a compressive stress is created, due to a 4 percent local volume expansion, which can arrest crack growth and increase toughness5,11. The alternative to
9
TRIP results when the retained austenite remains stable which will create branching and blunting around the retained austenite and increase toughness.
Figure 2: Isothermal section (950 °C) of Fe-C-P phase diagram. Arrow indicates that austenite stability decreases with increasing phosphorus content.5
10
Figure 3: Hardness and charpy impact toughness of Eglin steel as a function of chemistry and heat treatment.2
There are two types of TRIP processes: stress-induced and strain-induced. Stress-induced TRIP involves the nucleation of martensite on the same sites it would nucleate during quenching, and the applied stress provides the extra thermodynamic driving force for nucleation to occur. Strain-induced TRIP requires the creation of new nucleation sites which are formed by shear bands caused by plastic strain. When a shear band is formed in the retained austenite of ultra-high strength steel an ε’ structure is formed, where the ε’ structure is martensite with a hexagonal lattice. The
11
intersection of these shear bands creates a new nucleation site for α’ martensite. These shear bands and nucleation sites can be seen in Figure 4 in a 304 stainless steel12. The new α’ martensite that forms from the retained austenite, forms with a different variant than the existing α’ martensite. The existing martensite has a Kurdjumov-Sachs (KS) relationship and the new martensite that forms has a Nishiyama-Wasserman (NW) relationship. Figure 5 shows a schematic illustration of a crack propagating through existing martensite towards a thin region of retained austenite. The plot of elastic energy vs. angle in Figure 5 shows that the NW variant has a lower elastic energy than the KS variant. This drives the transformation to an NW variant instead of the KS variant of the existing martensite. For most angles the KS variant has a positive elastic energy, which means that it resists any transformation at all13.
Figure 4: ε’ shear bands in austenite formed by plastic strain with the overlaps forming nucleation sites for the formation of α’ martensite.12
12
Figure 5: A schematic diagram of a crack propagating through martensite towards a retained austenite boundary along with a plot of elastic energy as a function of angle showing that the NW variant is more energetically favorable than the KS variant for all angles.13
In addition to mechanical instability, retained austenite can also become unstable during heat treatment. According to Horn and Ritchie8, this stability is a strong function of thermal history and loading conditions. For both 4340 and 300M, when samples are air cooled or isothermally held during cooling they contain higher amounts of retained austenite compared with the quenched counterparts. If the austenite decomposes due to thermal effects, it starts to precipitate cementite (M3C).
Once this precipitation occurs and the austenite is depleted of carbon, the austenite destabilizes and can transform to martensite upon cooling4,8. The temperature at which this thermal instability starts to occur can be altered by the addition of various alloying elements, most notably silicon. When the retained austenite decomposes, tempered martensite embrittlement (TME) occurs due to the formation of cementite (at the
13
expense of ε-carbides) and transformation to as-quenched martensite. According to Horn8, the severity of this embrittlement is related to the amount of retained austenite, and the onset of this embrittlement is a function of the tempering temperature when retained austenite becomes unstable, leading to interlath cleavage failure. The sequence of microstructural changes leading to TME is as follows. Carbon starts to diffuse from the interlath retained austenite during heat treatment at elevated temperatures. This carbon diffuses towards the ε-carbides present in the microstructure, and this diffusion has a dual effect. First, the extra carbon surrounding the ε-carbides, along with the elevated temperature will cause the transformation to cementite. Second, the retained austenite is now less stable thermodynamically because of the carbon diffusion that just occurred. This retained austenite will then transform to as-quenched martensite. Both the formation of cementite and the transformation to as-quenched martensite are detrimental to toughness. With this in mind, it was reported by Haidemenopoulos6 that the retained austenite does not decompose in the 150-250 °C range, and Hebsur9 reported that the decomposition of retained austenite (sometimes referred to as the second stage of tempering) occurs in the 200-370 °C range. The influence of the retained austenite content and decomposition temperature on the severity of the TME can be seen in Table 28 and the influence of alloy content on toughness can be seen in Figure 6, where the fracture toughness of 4340 and 4340 + 1.3Si (300M) are plotted as a function of tempering temperature9. The toughness initially increases as the tempering temperature is increased because of the precipitation of ε-carbides which allow some of the lattice
14
strain in the martensitic matrix to be relieved, thus increasing toughness. As shown in Table 2, the maximum toughness is highest for the samples with the highest retained austenite content. This is due to TRIP effects where the stable austenite undergoes a martensitic transformation once it is strained. The tempering temperature where the toughness starts to decrease signifies the beginning of TME, and this is due to the precipitation of cementite instead of ε-carbides. This is significant because cementite itself is brittle (low toughness), and the precipitation causes the retained austenite to become unstable due to the loss of carbon from solution. The retained austenite can then transform to as-quenched martensite which is also brittle and low in toughness when compared to the retained austenite. It should be noted that the temperature where the toughness starts to decrease is higher for the silicon modified 4340. This increase in the temperature at which TME occurs is higher with increased silicon content because silicon is well known to make the cementite precipitation sluggish until higher tempering temperatures8,12–16. Thomas4 reported that Si, Ni, and Al all raise the temperature at which the austenite starts to decompose, while Mn and Cr lower this temperature. The elements that raise the temperature at which the austenite decomposes do so by reducing the carbon diffusivity which will decrease the rapid nucleation and growth of cementite in these alloys. The Mn and Cr, conversely, increase the diffusivity of carbon, leading to increased nucleation and growth of cementite.
15
Table 2: Summary of tempered martensite embrittlement phenomena including amount of retained austenite and toughness loss.8
16
1.2 ε-carbides
As mentioned previously, ε-carbides are involved in the process of tempered martensite embrittlement and also in the destabilization of retained austenite. Carbide clusters start to form when quenched steels are heated to 100 °C or above, and these carbide clusters eventually grow to become ε-carbides. When steels with greater than 0.2 wt. percent C are tempered from 100-200 °C, the ε-carbides are the first to be precipitated with a hexagonal close packed (HCP) structure and stoichiometry of Fe2.3C14. In comparison, when steel with less than 0.2 wt. percent C is tempered in the
same temperature range, the precipitation of ε-carbide is inhibited because there is little driving force. Most C is at dislocation sites where there is more space in the lattice due to the mismatch of atomic planes, and these sites have lower energy than those available in ε-carbide, thus limiting the driving force for precipitation13
. These precipitates can be seen in the TEM micrograph of Fe-0.013C shown in Figure 7. Although ε-carbides are typically precipitated from supersaturated martensite during tempering, precipitation can also occur directly from the austenite during the austenite
→ martensite transformation. Autotempering, the process of tempering upon cooling without subsequent reheating, is also found to exist for 300M specimens, where every plate and lath exhibited autotempered ε-carbides. In this case, tempering in the 200-300 °C range makes the ε-carbides that precipitated during auto-tempering grow and increases toughness. It is speculated that in the as quenched condition the ε-carbide
17
depletes C locally around the ε-carbides and renders the carbide/matrix interface weak13,15.
Figure 7: TEM micrograph showing precipitation of ε-carbides in Fe-0.013C steel tempered at 200 °C for 6 hours.14
The ε-carbides form as a continuous film at lath and twin boundaries in martensitic structures when retained austenite is present, and are typically 5-10 nm wide and 100-150 nm long with a <211> growth direction 9,15. These carbides form in the same location as the retained austenite (at the lath boundaries), which is one of the factors that influences TME due to degeneration of retained austenite and transformation to M3C. As the temperature is increased, the ε-carbides begin to coarsen due to the
18
diffusion of excess carbon from the retained austenite. Eventually, the ε-carbides will transform to cementite after enough carbon has diffused from the austenite, leaving the austenite unstable. Horn reported that the precipitation of cementite at the lath boundaries is what leads to the onset of TME8. He also noted the embrittling effect of cementite was confirmed by observing that 4340 and 300M samples with peak toughness exhibited ε-carbides while samples from the toughness trough contained cementite. For 300M in the quenched and tempered condition, ε-carbide is present after a 300 °C temper, but cementite is present after 400 °C. For 300M in the air cooled and tempered condition, ε-carbide is present after a 300 °C temper, but cementite is present after 470 °C8. The precipitation of cementite occurring at higher temperatures for the 300M in the air cooled and tempered condition compared to the quenched and tempered condition is due to higher amounts of retained austenite in the latter condition. Higher amounts of retained austenite require more energy to make the austenite unstable (diffuse enough C from the austenite which also transforms ε-carbide to cementite). In addition to stabilizing retained austenite to higher tempering temperatures, as mentioned previously, the additions of Si and Al will also stabilize ε-carbides to higher tempering temperatures, and further delaying the formation and growth of cementite8,9.
1.3 Cementite
For low-Si 4340, retained austenite supersaturated with C decomposes to cementite in the range of 200-370 °C9. In the case of autotempered cementite, it is well known that
19
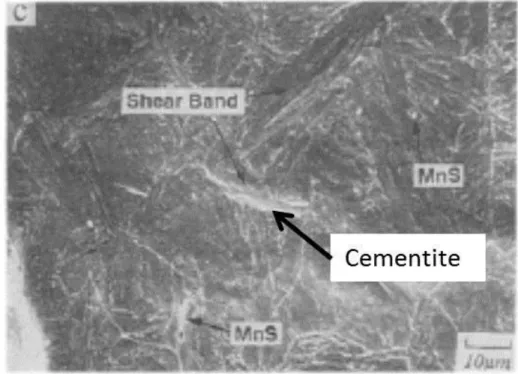
precipitation is enhanced in a coarser martensitic structure as compared to a fine lath structure because the coarser structure has thicker regions of retained austenite between the laths17. The thicker regions of retained austenite will contain a larger amount of carbon which will enhance the cementite precipitation. This has serious implications on cooling rate for weld thermal cycles (i.e. heat input) as slower cooling rates (higher heat inputs) would lead to a coarser lath structure and a potential to have cementite present before tempering, which could lead to reduced toughness. The slower cooling rate allows more time for diffusion, thus forming a coarser structure. Paules et al. found that cementite formed during tempering was present in Eglin steel with a mean size of 180 nm and it was composed of Fe with low levels of Cr2. In addition to its brittle mechanical behavior, cementite is undesirable because it acts as a stress concentrator. The in-situ SEM work of Lee et al. shows that shear bands form first along arrays of cementite particles in the notch tip region of HY-100 test specimens as seen in Figure 818.
20
Figure 8: In-situ SEM micrograph showing formation of shear bands along row of cementite particles in HY-100 steel.18
As described above, decomposition of austenite can occur when a sufficient amount of carbon diffuses from the austenite to transform the ε-carbides to cementite at the lath boundaries. However, cementite can also form along the prior austenite grain boundaries (PAGBs) and will often cover most of the boundary. The coverage can be enhanced in the presence of impurities. As stated earlier, increasing the concentration of P decreases the solubility of C in austenite. This will lead to diffusion of C out of the austenite and into the PAGB where cementite can form. If the concentration of C at the PAGB is less than 25 at. percent then there is incomplete coverage at the PAGB5. In the embrittlement range, the combination of cementite precipitates and impurities in PAGBs will lead to the lowest cohesion of the grain boundaries, resulting in intergranular fracture8. Toughness can be regained if the material is tempered at
21
temperatures above the embrittlement trough (greater than 450 °C) because the cementite will start to spherodize, and tempering to even higher temperatures leads to dissolution of cementite and the formation of M2C carbides, leading to higher
toughness13,17,18.
1.4 Embrittlement
There are three types of embrittlement that are operative in ultrahigh strength steels such as 4340, 300M, and Eglin: temper embrittlement, tempered martensite embrittlement, and grain refinement embrittlement. Temper embrittlement, caused by impurity segregation to the grain boundary, is more severe with larger grains because there is less grain boundary area to accommodate the impurity elements. Thus, the grain boundary concentration of impurity elements is higher18,19. Tempered martensite embrittlement coincides with dissolution of ε-carbides and subsequent formation of cementite as well as degeneration of retained austenite8,19. Grain refinement embrittlement could lead to a decrease in toughness in quenched and tempered alloys when retained austenite exists along lath boundaries. Embrittlement can occur because the higher amount of retained austenite at the lath boundaries can produce relatively large amounts of as-quenched martensite upon transformation during tempering and/or loading20.
22
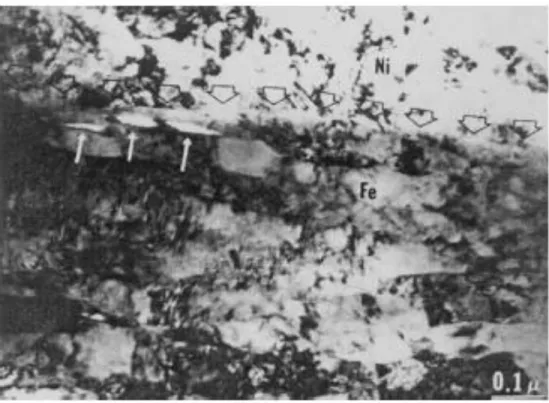
Figure 9: TEM micrograph of 5.5Ni steel plated with Ni (top half of image) with fracture surface highlighted by downward pointing arrows.21
TME leads to a sharp decrease in toughness depending on tempering temperature (embrittlement trough), with three distinct failure modes8,9,18. Transgranular failure is caused by the precipitation and growth of cementite films on grain boundaries and interlath boundaries. When transgranular failure is operative, the dominant fracture plane for lath martensitic alloys is {110}, which is both the dominant slip plane in body-centered cubic (BCC) structures and the preferred lath boundary plane20. A TEM micrograph of a transgranular type fracture in lath martensitic steel is shown in Figure 9. The image shows a 5.5Ni steel in which the fracture surface was nickel plated. The crack path generally lies on the <110> plane indicating transgranular failure. The second type of failure mode present in TME is interlath cleavage. Interlath cleavage is the result of retained austenite at the lath boundaries transforming to a combination of
23
cementite and quenched martensite. The formation of both cementite and as-quenched martensite embrittles the material and cleavage failure occurs at the lath boundaries. The final failure mode is intergranular failure associated with impurity embrittlement at grain boundaries (temper embrittlement). A schematic of all three of these failures modes can be seen in Figure 10. According to Horn, these three mechanisms can act together to cause final failure or a single mechanism can be operative8.
Figure 10: Schematic illustrations showing the three failure modes possible due to tempered martensite embrittlement.8
1.5 Weldability
There is no published data on the weldability of Eglin steel, so much of the knowledge must be inferred from welding studies performed on other ultra-high strength or high strength low alloy (HSLA) steels. Weld preheat, control of interpass temperature, and possible post weld heat treatment (PWHT) are all necessary to prevent hydrogen cracking 22,23. PWHT is typically performed to relieve residual stresses that result from the welding process, but other factors may be influenced by PWHT including the possibility of hydrogen assisted cracking. Still et al. report for 4130/4140 that
24
maintaining 200-250 °C for 1 hour after welding helps to facilitate the removal of hydrogen24.
An understanding of HAZ microstructure and properties is crucial for optimizing weld parameters. Single pass welds are typically the starting point for investigating microstructure and property evolution in welds. One particular area of interest is the CGHAZ where high peak temperatures (typically within 100 °C of the melting temperature) lead to excessive austenite grain growth, and rapid cooling rates result in a suppression of ferrite nucleation and the formation of lower temperature transformation products such as bainite and martensite24,25. The formation of these microstructures can lead to a strong yet brittle microstructure.
Although single pass welds are a great starting point for investigation of the evolution of properties and structure, a more realistic study looks at the evolution from multipass welds. Davis and King26 and Lee et al.27 both separately discuss the formation of a local brittle zone (a region of poor toughness) in multipass welds, specifically the intercritically reheated coarse grain HAZ. This is a region within the material that was part of the CGHAZ following a single pass weld but was reheated to an intercritical peak temperature (between Ac1 and Ac3) on a subsequent pass. Both Davis and Lee
attributed this poor toughness to a formation of a martensite-austenite (MA) constituent, which is a high C martensite microstructure with retained austenite at lath boundaries. Banding in the initial microstructure can decrease toughness in the
25
material particularly where the intercritically reheated CGHAZ exhibits a partial transformation to austenite. This is most prevalent where austenite stabilizers (C, Mn) are segregated in the initial microstructure28. Figure 11 shows where and how the MA constituent will form within these types of steels depending on alloy contents when banding is not present. Figures 11A and B show a ‘necklace’ structure of MA constituent forming on the PAGB, where Figure 11C shows a complete transformation along the PAGBs and formation of fresh martensite upon cooling. The alloy shown in Figure 11C has a nickel content (austenite stabilizer) approximately six times greater than the alloys shown in Figure 11A and B. Although there is a change in morphology depending on the alloy content of the steel and the thermal cycles used, Lee stated that the drastic decrease in impact energy of the intercritically reheated CGHAZ is attributed mainly to the significant increase in the amount of martensite27. This drastic decrease in toughness is seen in Figure 12 showing charpy impact energy as a function of the second thermal cycle peak temperature. Lee also reported that a cooling rate corresponding to Δt8-5 = 7 s will result in the formation of martensite27. Therefore,
utilizing a higher heat input weld would increase Δt8-5 and could reduce martensite
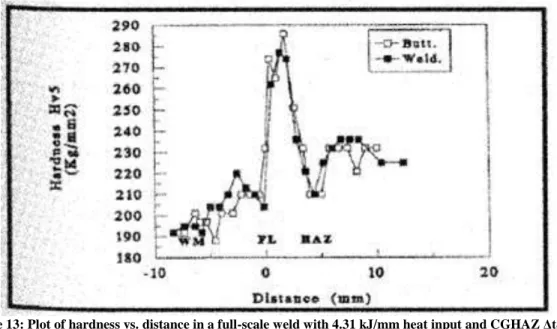
formation or autotemper it, thus restoring some toughness in the HAZ. Loureiro and Fernandes29 investigated the toughness of HAZs of welds in two different low alloy steels. Figure 13 shows a plot of hardness as a function of distance for an as-welded joint with 4.31 kJ/mm heat input and Δt8-5 = 36.5 s in the CGHAZ.
26
Figure 11: Location and morphology of MA constituent for a ultra-high strength steels with compositions similar to Eglin with (a) and (b) showing the MA constituent in a necklace structure with (c) showing complete transformation along the PAGB.26
Figure 12: Charpy toughness as a function of second thermal cycle peak temperature for HSLA steels showing lowest toughness in the intercritically reheated CGHAZ.27
27
Figure 13: Plot of hardness vs. distance in a full-scale weld with 4.31 kJ/mm heat input and CGHAZ Δt8-5 =
36.5 s.29
The peak hardness is found in the CGHAZ and the increase is due to the formation of lower bainite and tempered martensite. The hardness trough at approximately 5 mm from the fusion line corresponds to the sub-critical HAZ where carbide coarsening has led to the reduced hardness. Figure 14 shows a plot of charpy toughness versus test temperature for simulated CGHAZ samples with a variety of cooling rates. This plot shows that as Δt8-5 increases (slower cooling rate) the toughness of the CGHAZ drops.
The authors associated this toughness drop with an increase in the volume fraction of coarse upper bainite in comparison to the mixture of lower bainite and martensite that forms at higher cooling rates. The increase in toughness associated with an increase in volume fraction of lower bainite has also been shown by Abbaszadeh et al.30 for D6AC ultrahigh strength steel.
28
In addition to cooling rate, the heat input and austenitization temperature can have a large effect on the properties of the HAZ in welds. Neves and Loureiro31 have stated that a low (2 kJ/mm) to moderate (4.2 kJ/mm) heat input is preferred over high heat inputs (6.6 kJ/mm) because high heat inputs promote a wider HAZ with an increased PAG size and a decrease in notch toughness. Kishore Babu et al.32 have shown that increased austenitization temperature increases PAG size and this has a detrimental effect on hardness, strength, and ductility for 0.3C-CrMoV steel. These plots can be seen in Figure 15. The reduction in properties with increased austenitization temperature is associated with a change from a lower bainitic structure to an upper bainitic structure.
Figure 14: Charpy toughness vs. test temperature for simulated CGHAZs showing a decrease in toughness associated with increased cooling time.29
29
Figure 15: Influence of austenitizing temperature on (a) hardness, (b) yield strength, (c) tensile strength, and (d) percent elongation for 0.3C-CrMoV steel.32
30
Chapter 2: Development of a Continuous Cooling Transformation Diagram for Eglin Steel
2.1 Abstract
Eglin steel is a new ultra-high strength steel that has been developed at Eglin Air Force Base in the early 2000s. This steel could be subjected to a variety of processing steps during fabrication, each with its own thermal history. This article presents a continuous cooling transformation diagram developed for Eglin steel to be used as a guideline during processing. Dilatometry techniques performed on a Gleeble thermo-mechanical simulator were combined with microhardness results and microstructural characterization to develop the diagram. The results show that four distinct microstructures form within Eglin steel depending on the cooling rate. At cooling rates above about 1 °C/s, a predominately martensitic microstructure is formed with hardness of ~520 HV. Intermediate cooling rates of 1 °C/s to 0.2 °C/s produce a mixed martensitic/bainitic microstructure with a hardness that ranges from 520 – 420 HV. Slower cooling rates of 0.1 °C/s to 0.03 °C/s lead to the formation of a bainitic microstructure with a hardness of ~420 HV. The slowest cooling rate of 0.01 °C/s formed a bainitic microstructure with pearlite at the prior austenite grain boundaries.
2.2 Introduction
Eglin steel is an ultra-high strength steel alloy that was developed at Eglin Air Force Base in the early 2000s and has since been patented in 20091. Eglin steel has strength levels similar to AerMet100, AF1410, and HP9-4-30, but at a reduced cost due to a
31
reduction or elimination of expensive alloying elements such as nickel and cobalt, which can both range from 10-14 wt. percent in the previously mentioned alloys.
Table 3 shows the alloy composition, strength, and toughness values for Eglin steel. The chemical composition shown is that of the alloy used in this work. Silicon is added to enhance toughness. Silicon is well known to make cementite precipitation sluggish at tempering temperatures used for Eglin steel8,14–16,33. According to the patent document, chromium is added to increase strength and hardenability, while molybdenum is also added to increase hardenability. Nickel is used to increase toughness, and tungsten is added to increase strength and wear resistance1. In addition, tungsten and molybdenum (to a lesser extent) is added because it lowers the grain boundary embrittlement potential when in solution because it ties up tramp elements.
Table 3: Composition (wt. percent) and mechanical properties of Eglin steel
Eglin steel typically has a quenched and tempered microstructure consisting of tempered martensite with a variety of carbide sizes and morphologies. Paules et al.2 have reported M3C, M6C, and MC carbides that form after heat treatment with sizes of
180 nm, 250 nm, and 10-20 nm, respectively. Two heat treatment schedules were investigated. In the first heat treatment, the samples were normalized at 1090 °C for 1
Alloy Fe C Mn Si Cr Ni Mo Co W σy σUTS
Charpy @ -40°C (ksi) (ksi) (ft-lbs.)
32
hour, followed by a sub-critical anneal at 650 °C for 1.5 hours. The samples were then austenitized at 900, 950, or 1010 °C for 0.5 hours, oil quenched, then tempered at 260
°C for 1 hour. The second heat treatment was the same as the first, but did not contain the normalization and sub-critical anneal. M3C and MC carbides were found in all heat
treated samples, but the M6C carbides were only present following the low
temperature austenitization treatment. Increasing the austenitization temperature from 900 to 1010 °C caused the dissolution of the M6C carbides.
Eglin steel can undergo a variety of fabrication processes such as casting, rolling, forging, fusion welding, and heat treating. Each of these processes is associated with different thermal cycles, thus creating the potential for different microstructures to form upon cooling. Development of a continuous cooling transformation (CCT) diagram is of vital importance to understand and control the different microstructures that could form within Eglin steel during any of these processing steps. Thus, the objective of this work is to develop a CCT diagram for Eglin steel that can be used to control the microstructure and associated properties under a wide range of cooling rates.
2.3 Procedure
The composition of Eglin steel used for the development of the CCT diagram can be seen in Table 3. The material was received in the quenched and tempered condition according to the following heat treatment: normalize at 1066 °C for one hour (air
33
cool), austenitize at 1010 °C for one hour (water quench), and temper at 204 °C for four hours (air cool). Dilatometry experiments were carried out on a Gleeble 3500 thermo-mechanical simulator using a linear variable differential transformer (LVDT) dilatometer to measure diametral dilation during heating and cooling. Samples used for testing were 6 mm in diameter and 70 mm in length.
Dilatometry experiments for determining phase transformations in Eglin steel were carried out according to ASTM A103334 with one exception. The initial soak proposed by the ASTM specification was not conducted due to possible changes in carbide morphology and size that could be caused by this higher temperature soak. Samples were heated to 1010 °C at 10 °C/s, held at 1010 °C for 5 min and cooled at rates from 50 °C/s to 0.01 °C/s. Transformation temperatures upon cooling were determined by calculating the derivative of the dilation as a function of the sample temperature and observing changes in the slopes of the derivative curve. A deviation from a constant derivative indicated the start of a transformation and return to a constant derivative was taken as the finish of a transformation.
Following heating and cooling in the Gleeble, the samples were tested using Vickers microhardness method with a 300 g load and 15 sec dwell time. Five tests were conducted per sample and an average and standard deviation were calculated.
34
Microstructural characterization was performed on a Reichert-Jung MeF3 inverted light optical microscope (LOM). Samples were prepared using standard metallographic techniques with a 0.05 μm colloidal silica final polish. The samples were etched first in 4 percent picral for 15-60 seconds depending on cooling rate, cleaned with cotton and ethanol, and further etched in 2 percent nital for 5-30 seconds depending on cooling rate. Scanning electron microscopy (SEM) was conducted on a Hitachi 4300 FEG/SEM at an accelerating voltage of 10 kV.
2.4 Results
Four different microstructures were observed with variations in cooling rate. The steel can be predominantly martensitic, mixed martensitic/bainitic, entirely bainitic, or mixed bainitic/pearlitic. Typical dilatometry curves associated with each of these different microstructures can be seen in Figure 16. The variation in hardness due to these various microstructures is shown in Figure 17 as a function of cooling rate.
35
Figure 16: Representative dilatometry (dashed line) and differentiated (solid line) dilatometry curves used to determine transformation temperatures in Eglin steel. (a) A predominantly martensitic transformation, (b) a mixed martensitic/bainitic transformation, (c) a fully bainitic transformation, (d) a mixed pearlitic/bainitic transformation.
36
Figure 17: Plot of Vickers microhardness as a function of cooling rate for Eglin steel.
The four types of microstructures can be discerned on the hardness plot as well, where the predominantly martensitic region is associated with a hardness plateau for cooling rates of 50 – 1 °C/s, the transition from predominantly martensite to predominantly bainite occurs for cooling rates from 1 – 0.2 °C/s, the entirely bainitic region is another plateau from 0.1 – 0.03 °C/s, and the data point at 0.01 °C/s is from the mixed bainitic/pearlitic region.
The identification of various phases is based on a combination of results; including the dilatometry curves, microhardness data, and microstructural morphology observed during LOM and SEM examination, as well as the phase identification system
37
described in the Atlas of Bainitic Microstructures35. Figure 18 through Figure 22 show LOM and SEM photomicrographs of typical microstructures. Figure 18 shows the microstructures from the 50 °C/s cooling rate, and it can be seen that the martensitic microstructure is formed at the highest cooling rate, although there appears to be a small amount of bainite as well. As shown in Figure 19, a mixed martensitic/bainitic microstructure forms at cooling rates from 0.3 to 0.1 °C/s. The microstructure of the Eglin steel is bainitic at a cooling rate of 0.03 °C/s as shown in Figure 20. The mixed bainitic/pearlitic microstructure that forms at the slowest cooling rate of 0.01 °C/s can be seen in Figure 21 with the pearlite located at the prior austenite grain boundaries.
Figure 22 shows the microstructure of Eglin steel cooled at 50 °C/s (Figure 22A) and through the transition region of 0.3-0.1 °C/s (Figure 22B-D, respectively). The photomicrographs also show the microhardness of the two phases present within the microstructure at the various cooling rates, with martensite being the lighter etching phase and bainite being the darker etching phase. Bainite has a lower microhardness for all cooling rates, and the amount of bainite increases with decreasing cooling rate.
38
Figure 18: (a) Light optical and (b) scanning electron micrographs of Eglin steel cooled at 50 °C/s showing a large amount of martensite with a small amount of bainite.
39
Figure 19: Light optical and scanning electron micrographs of Eglin steel cooled at 0.3 °C/s (A and B), 0.2 °C/s (C and D), and 0.1 °C/s (E and F) showing a mixed martensitic and bainitic microstructure.
40
Figure 20: (a) Light optical and (b) scanning electron micrographs of Eglin steel cooled at 0.03 °C/s showing an entirely bainitic microstructure.
Figure 21: (a) Light optical and (b) scanning electron micrographs of Eglin steel cooled at 0.01 °C/s showing a large amount of bainite with a small amount of pearlite at the prior austenite grain boundaries.
41
Figure 22: Microhardness of martensite and bainite phases within Eglin steel cooled at (a) 50 °C/s, (b) 0.3 °C/s, (c) 0.2 °C/s, and (d) 0.1 °C/s.
Equilibrium ThermoCalc calculations were performed to determine the temperature and composition at which austenite becomes unstable during cooling. These calculations were conducted with the ThermoCalc software package36 using the TCFE5 database37. Figure 23A shows calculated fraction of austenite as a function of temperature and demonstrates that austenite is not stable below 745 °C. At that temperature, the carbon composition is 0.2 wt. percent (Figure 23B), which corresponds to the calculated eutectoid composition for Eglin steel. Figure 24 is an
42
equilibrium calculation for Eglin steel showing the phase fraction of austenite, ferrite, and carbide phases as a function of temperature.
Figure 23: Equilibrium Thermocalc calculations showing (a) phase fraction of austenite in Eglin steel as a function of temperature and (b) mass fraction of carbon within austenite.
43
Figure 24: Equilibrium Thermocalc calculation of phase fraction as a function of temperature showing phases of austenite, ferrite, and carbide phases that are predicted to form during heating and cooling of Eglin steel.
Combining the dilatometry curves, the hardness data, and the microstructures for each cooling rate, a CCT diagram can be assembled for Eglin steel with cooling rates from 50 – 0.01 °C/s (Figure 25). The solid data points correspond to transformation starts and the hollow data points correspond to transformation finishes.
44
Figure 25: Continuous cooling transformation diagram for Eglin steel.
2.5 Discussion
The combination of dilatometry curves, microhardness data, and microstructural observations are discussed here in view of identifying the various microstructures that form with changes in cooling rates and assembling the CCT diagram. The dilatometry curve shown in Figure 16A was typical for cooling rates between 50 °C/s and 1 °C/s. The dilatometry curve and associated differentiated curve exhibit a single deviation from the horizontal line of the differentiated curve, which corresponds to a phase transformation start temperature of 412 °C. The differentiated curve goes through a