Computational Strategies for Proteogenomics Analyses
byAndy Kong
A dissertation submitted in partial fulfillment of the requirements for the degree of
Doctor of Philosophy (Bioinformatics) in The University of Michigan
2017
Doctoral Committee:
Associate Professor Alexey I. Nesvizhskii, Chair Professor Philip C. Andrews
Assistant Professor Yuanfang Guan Assistant Professor Ryan E. Mills Associate Professor Maureen Sartor
Andy T. Kong [email protected] ORCID ID: 0000-0002-4708-7815
TABLE OF CONTENTS
LIST OF TABLES iv
LIST OF FIGURES v
LIST OF APPENDICES vii
ABSTRACT viii
CHAPTER
I. INTRODUCTION TO SHOTGUN PROTEOMICS AND PROTEOGENOMICS 1
1.1 Venturing beyond the reference proteome 1
1.2 Mass spectrometry-based proteomics 3
1.3 Methods for peptide identification in shotgun proteomics 5
1.4 Error rate estimation in shotgun proteomics 7
1.5 False positives in proteogenomics analyses 8
1.6 Outline 9
II. CHARACTERIZATION AND REMEDIATION OF FALSE POSITIVES IN
PROTEOGENOMICS WORKFLOWS 11
2.1 Introduction 11
2.2 Materials and methods 12
2.3 Results 16
2.3.1 Characteristics and sources of high scoring decoys 16 2.3.2 Target-decoy assumption is violated by modified peptides and
causes underestimation of error rates 20
2.4 Discussion 24
2.5 Data availability 25
2.6 Acknowledgments 25
III. EFFICENT DATABASE SEARCH TOOLS FOR PROTEOGENOMICS
ANALYSIS 26
3.1 Introductions 26
3.2 Materials and methods 28
3.3 Results 43
3.3.2 MSFragger implements a novel fragment ion index that enables
ultrafast database search 51
3.4 Discussion 55
3.5 Data availability 56
3.6 Acknowledgments 56
IV. COMPREHENSIVE PROFILING OF MODIFIED PEPTIDES IN SHOTGUN
PROTEOMICS USING THE OPEN SEARCH STRATEGY 57
4.1 Introduction 57
4.2 Materials and methods 58
4.3 Results 66
4.3.1 Refinements of the open search strategy using MSFragger 66 4.3.2 Large-scale profiling of unlabeled shotgun experiments 69 4.3.3 Modified peptides in various proteomics applications 73
4.4 Discussion 76
4.5 Data availability 77
4.6 Acknowledgments 78
V. FUTURE EXPLORATIONS BEYOND THE REFERENCE PROTEOME 79
5.1 Conclusions 79
5.2 Future directions 81
APPENDICES 85
LIST OF TABLES
Table 1-1: Top mass spectrometers in PRIDE as of March 2017. 5
Table 3-1: Running time of EGADS compared to Comet and X! Tandem. 47
Table 3-2: Running time of EGADS as a function of on-board memory. 50 Table 3-3: Identification rates and analysis time for the HEK 293 data set. 53 Table 4-1: List of genes associated with ‘small molecule metabolic process’ that have a
large increase in identified bait peptide ions. 75
Table B-1: Analysis times for a single file (b1906_293T_proteinID_01A_QE3_122212)
in HEK293 dataset using different search engines. 88
Table B-2: EGADS runtime across diverse search conditions. 89
Table C-1: Mass shift localization by dataset. 93
Table C-2: List of top 500 detected features in mass shift histogram with potential
explanations. 101
Table D-1: Listing of MSFragger search parameters. 118
LIST OF FIGURES
Figure 1-1: Proteogenomics workflow. 2
Figure 1-2: Size of the PRIDE data repository of proteomics data over time as of March
2017. 5 Figure 2-1: High scoring decoys can be supported by tens to hundreds of PSMs. 16
Figure 2-2: Overlap of decoy peptide sequences across three search engines. 17
Figure 2-3: Explanation of high scoring decoy PSMs. 18
Figure 2-4: HEK293 peptide identifications across traditional narrow-window and open
searches demonstrate underestimation of FDR. 21
Figure 2-5: Spectral homology in theoretical spectra derived from modified peptides. 23
Figure 3-1: Architecture of EGADS. 31
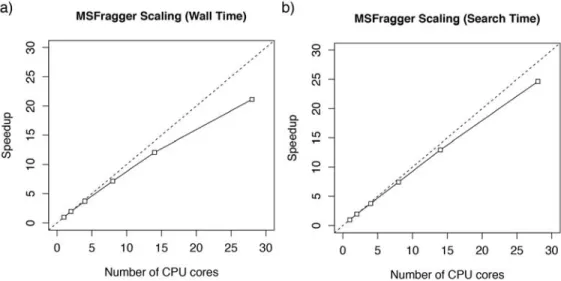
Figure 3-2: Fragment indexing allows efficient spectra similarity comparisons. 38 Figure 3-3: MSFragger scales efficiently across large number of CPU cores. 39
Figure 3-4: Digestion-scoring cycles in EGADS. 44
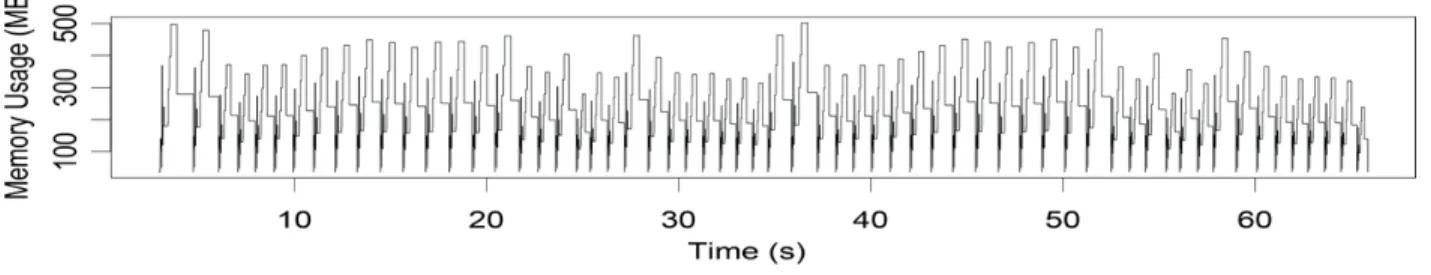
Figure 3-5: GPU memory usage of EGADS in digestion-scoring cycles. 45 Figure 3-6: Identifications in the HeLa dataset as a function of FDR. 46 Figure 3-7: Average GPU speedups as a function of digestion mode or similarity
function. 48 Figure 3-8: Total time used for similarity scoring for different similarity functions. 49
Figure 3-9: Modification profiles of HeLa dataset as determined by EGADS open
searching and MODa. 51
Figure 3-10: Database-search strategies and the MSFragger algorithm. 52 Figure 3-11: Open searching identifies similar modifications as MODa. 54 Figure 4-1: MS-1 based precursor mass correction and identification based calibration. 61
Figure 4-2: Preferential boosting of unmodified peptides fails to rescue missing peptides. 66 Figure 4-3: Decrease sensitivity for common modifications in open searching can be
overcome by specifying variable modifications. 67
Figure 4-4: Complementary ions and recovery of peptides with modifications near
peptide C-terminus. 68
Figure 4-5: Co-isolation of co-eluting precursors can result in mass differences that are
not due to chemical modifications. 70
Figure 4-6: MS1-based correction of precursor masses and identification-based
calibration helps delineate modifications in close mass proximity. 71 Figure 4-7: Modification profiles in large-scale HeLa, HEK293, and TNBC shotgun
proteomics experiments. 72
Figure 4-8: Open searching detects modified peptides containing labile modifications. 73 Figure 4-9: Application of MSFragger to diverse proteomics experiments. 74 Figure A-1: Example of high scoring decoy due to ambiguous scoring. 85 Figure A-2: Example of high scoring decoy due to semi-tryptic peptide. 86 Figure A-3: Example of high scoring decoy due to unaccounted for modification. 87 Figure C-1: Localization profiles are consistent across experiments. 91 Figure C-2: Highly similar spectra pair for peptide LEAEIATYR with precursor mass
difference of 284.126. 92
Figure D-1: In-silico digestion in MSFragger. 124
Figure D-2: Peptide index generation in MSFragger. 124
Figure D-3: Fragment index searching in MSFragger. 125
LIST OF APPENDICES
Appendix A: Examples of high scoring decoys 85
Appendix B: Supplementary materials for efficient database search tools 88 Appendix C: Supplementary materials for comprehensive profiling of modified peptides 91
ABSTRACT
Proteogenomics is an area of proteomics concerning the detection of novel peptides and peptide variants nominated by genomics and transcriptomics experiments. While the term primarily refers to studies utilizing a customized protein database derived from select sequencing
experiments, proteogenomics methods can also be applied in the quest for identifying previously unobserved, or missing, proteins in a reference protein database. The identification of novel peptides is difficult and results can be dominated by false positives if conventional
computational and statistical approaches for shotgun proteomics are directly applied without consideration of the challenges involved in proteogenomics analyses. In this dissertation, I systematically distill the sources of false positives in peptide identification and present potential remedies, including computational strategies that are necessary to make these approaches feasible for large datasets.
In the first part, I analyze high scoring decoys, which are false identifications with high assigned confidences, using multiple peptide identification strategies to understand how they are
generated and develop strategies for reducing false positives. I also demonstrate that modified peptides can cause violations in the target-decoy assumptions, which is a cornerstone for error rate estimation in shotgun proteomics, leading to potential underestimation in the number of false positives. Second, I address computational bottlenecks in proteogenomics workflows through the development of two database search engines: EGADS and MSFragger. EGADS aims to address issues relating to the large sequence space involved in proteogenomics studies by using graphical processing units to accelerate both in-silico digestion and similarity scoring. MSFragger
implements a novel fragment ion index and searching algorithm that vastly speeds up spectra similarity calculations. For the identification of modified peptides using the open search strategy, MSFragger is over 150X faster than conventional database search tools. Finally, I will discuss refinements to the open search strategy for detecting modified peptides and tools for improved collation and annotation. Using the speed afforded by MSFragger, I perform open searching on
several large-scale proteomics experiments, identifying modified peptides on an unprecedented scale and demonstrating its utility in diverse proteomics applications.
The ability to rapidly and comprehensively identify modified peptides allows for the reduction of false positives in proteogenomics. It also has implications in discovery proteomics by allowing for the detection of both common and rare (including novel) biological modifications that are often not considered in large scale proteomics experiments. The ability to account for all chemically modified peptides may also improve protein abundance estimates in quantitative proteomics.
CHAPTER I
INTRODUCTION TO SHOTGUN PROTEOMICS AND
PROTEOGENOMICS
1.1 Venturing beyond the reference proteome
In May 2014, more than thirteen years after the draft of the human genome [1,2], two studies from independent groups appeared in Nature each claiming to have completed the first draft of the human proteome [3,4]. These drafts of the human proteome were based on mass
spectrometry-based proteomics, the now dominant tool for large-scale proteome analysis. In these studies, data was generated from diverse human tissues, or otherwise aggregated from public repositories, to build a comprehensive catalog of human proteins. From the roughly 20,000 protein-coding genes, both studies reported mass-spectrometry evidence for over 17,000 protein-coding genes. Immediately after these heavily publicized publications, much criticism was raised in the proteomics community regarding the lax false discovery rate (FDR) filtering used in the studies. Several re-analyses of these datasets only identified 13-14,000 proteins [5] and others raised concerns about the large number of olfactory receptor proteins identified in non-nasal tissues (allegedly due to poor quality spectra and non-unique peptides) [6]. As a result, guidelines were established for calling novel (as was the case for many peptides and proteins in these studies) identifications [7] and subsequent work from one of the groups publishing the draft proteome have revised downwards their observed number of proteins to less than 15,000 [8], more than 2,000 fewer than what was originally claimed. The drafts of the human proteome and the subsequent controversy illustrate the numerous statistical pitfalls and computational
challenges surrounding mass spectrometry-based proteomics.
The concept of novel identifications in attempts to define the proteome can be a bit misleading as modern high-throughput proteomics studies relies on databases of protein sequences derived
from genomics and transcriptomics studies. Hence, defining the proteome is more of an exercise in validating predicted protein products rather than directly observing proteins and their
sequences. This is in contrast to the efforts in the early 1990s, prior to the availability of genomic or protein databases, where Edman sequencing of intact proteins or enzymatically-digested fragments was used to generate partial protein sequences for which degenerate oligonucleotide primers could be made to PCR the gene for sequencing [9]. Presently, the majority of proteomics studies utilize high quality reference databases generated from a combination of manual and automated curation such as UniprotKB [10] and Ensembl [11]. Others use custom protein databases [12] derived from related sequencing experiments to capture variants (both point and splice) [13] and non-canonical regions of coding potential (such as lncRNAs [14]). Studies of the latter type have been classified under the label of proteogenomics [7] in recent years as an
emerging field of proteomics (Figure 1-1). Despite this classification, the methods and
challenges involved in identifying novel peptides and proteins, whether they stem from entries in the reference database that have not been previously observed by mass spectrometry [5,15] or from predictions from sequencing data, are largely the same (rather unsurprising as the reference protein database is also derived from sequencing efforts). These efforts to characterizing the novel and unknown may also extend to the vast repertoire of post-translational modifications (PTMs) that regulate most proteins [16]. Together, they embody the frontiers of the observable proteome. In this dissertation, we define some of the challenges in these explorations beyond the reference proteome and present computational tools and strategies that address these issues.
Figure 1-1 Proteogenomics workflow.
Genomics and transcriptomics data are used to generate customized protein databases that are used for peptide identification. The identified peptides are then used to validate or refine gene models.
1.2 Mass spectrometry-based proteomics
Modern high-throughput shotgun proteomics has its origins in the development of four crucial technologies in the 1980s and early 1990s. The first are the advances in peptide and protein ionization technologies such as MALDI (matrix-assisted laser desorption/ionization) and electrospray ionization that enabled the analysis of these biomolecules in mass spectrometers [17]. In particular, electrospray ionization is compatible with high performance liquid
chromatography (HPLC) systems that are critical for separating peptides in complex biological mixtures. Second, the development of tandem (MS/MS) mass spectrometry enabled the rapid sequencing of peptides bypassing lengthy Edman sequencing [18]. In tandem mass spectrometry, peptide ions are collided or otherwise fragmented into peptide fragments and the mass spectra of the resultant fragments are collected. The peptides fragment primarily at the amide bonds
between residues, allowing the sequence to be deduced by comparing the mass differences between series of ions to the mass of amino acids. The third are automated instrument control methods that enable mass spectrometers to dynamically select which ions to fragment based on the ions it observes eluting from chromatographic system in real time [19]. These data-dependent acquisition methods enable mass spectrometers to focus on the ions most likely to yield
additional information about the sample (e.g. high intensity ions that have not already been fragmented, ions that do not correspond to signals of known chemical noise) as the number of eluting ions is far greater than the rate at which mass spectrometers can acquire tandem mass spectra. Finally, and of particular focus in this dissertation, computational tools that can interpret and assign a peptide identification to these tandem mass spectra. Without these automated tools, the labor involved in manual interpretation would prohibit mass spectrometry-based proteomics from evolving into a high-throughput technology.
In practice, the modern realizations of these technologies in shotgun proteomics are as follows [20]. Proteins are enzymatically digested, commonly with trypsin, into peptides that are loaded into an HPLC system coupled to a mass spectrometer. To reduce sample complexity (allowing lower abundance ions to be sampled in the mass spectrometer – resulting in greater proteome coverage), proteins and/or peptides can be fractionated in gels or another liquid chromatography system prior to loading. As peptides are eluted from the HPLC system, they are ionized and the
mass spectrometer generates a mass spectrum containing all eluting peptide ions (known as a survey or MS1 scan). Based on the acquired survey scan, the onboard computer selects a number of peptide ions to select for fragmentation (often the most abundant peptide ions). The mass spectrometer then iteratively applies a mass filter to the incoming stream of ions, selecting a narrow mass window around the selected peptide ion, and fragments the peptide ion into fragments. The fragment ions are then detected and recorded as a tandem (also called MS/MS, MS2, or fragmentation) spectrum. After a number of tandem mass spectra have been acquired, the selected masses are placed on an dynamic exclusion list [21] to avoid collecting additional mass spectra of the same peptide ion and a fresh survey scan is collected to select the next targets for fragmentation. The collected mass spectra can then be used for peptide identification and quantitation.
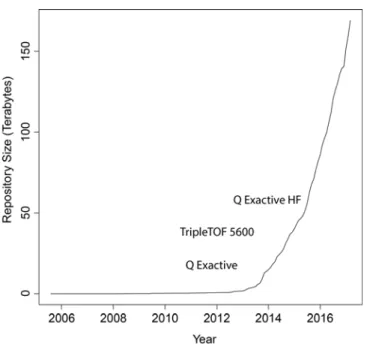
While this model of data dependent acquisition has served as the primary workhorse of shotgun proteomics for nearly two decades, advances in instrument speed and accuracy in recent years have led to dramatic increases in the depth of proteome coverage and rate of acquisition. Detection of over 10,000 proteins is now routine for fractionated human cell line data [22,23] while single shot analysis of the yeast proteome (approximately 4000 proteins) can now be performed in an hour [24], in contrast to the 144 hours of analysis time required for experiments performed as recently as 2008 [25]. As a result of the ever-increasing instrument speed, the amount of experimental data generated has increased significantly. This is readily observed through the growth in the amount of data stored in public repositories of proteomics experiments (Figure 1-2).
Much of this growth appears to be stimulated by the introduction of instruments that are able to acquire tens of high-resolution (tens of parts per million or less) tandem mass spectra per second such as the TripleTOF 5600 [26] or the Q Exactive [27] mass spectrometers. A deeper inspection of the PRIDE repository [28] (Table 1-1) reveals that the majority of deposited data is indeed generated from these and related instruments.
Figure 1-2 Size of the PRIDE data repository of proteomics data over time as of March 2017.
Project sizes are determined from the contents of their FTP directories. Project publication dates are used rather than submission dates. Popular mass spectrometers are plotted near their approximate release dates.
Table 1-1 Top mass spectrometers in PRIDE as of March 2017.
Instruments are extracted from PRIDE project pages with sizes determined from projects’ FTP directories. Projects analyzed using multiple instrument types are associated with all instruments, leading to some duplicate counting.
Instrument Projects Total Size (TB) Year of Introduction Q Exactive 740 72.52 2011 [27] LTQ Orbitrap Velos 770 51.07 2009 [29]
LTQ Orbitrap* 600 28.49 2005 [30] LTQ Orbitrap Elite 270 16.61 2012 [31]
TripleTOF 5600 191 10.08 2011 [26]
*In many projects, the annotations on the PRIDE project pages are incorrect, with experiments performed on LTQ Orbitrap Elite and LTQ Orbitrap Velos incorrectly labeled as LTQ Orbitrap.
1.3 Methods for peptide identification in shotgun proteomics
The automated interpretation of tandem mass spectra is an important part of any shotgun proteomics workflow. Peptide identification algorithms are assessed on both their ability to correctly identify peptides as well as their computational runtime as peptide identification is often a computational bottleneck in many proteomics workflows [20]. These runtime concerns may be more relevant than ever due to the volume of data generated by modern high-speed instruments. As previously described, peptide ions are typically fragmented at the amide bonds
between residues in tandem mass spectrometry. However, the fragmentation does not occur uniformly [32] and the fragmentation spectrum often fail to contain a complete ion ladder for easy interpretation. Hence, there are multiple strategies for interpreting tandem mass spectra.
There are three main classes of tools for peptide identification: database searching, tag-based searching, and de novo sequencing. The lines between the classes are often blurred as ideas between the classes can be combined to form hybrid strategies. One of the earliest tools to gain widespread adaptation was the database search tool SEQUEST [33] (also re-implemented as the open-source tool Comet [34]), which interpreted experimental spectrum by computing a cross correlation function against theoretical spectra derived from in-silico digested peptides in a protein database. This database search model has been adapted by numerous other tools
including Mascot [35], X! Tandem [36], Andromeda [37], MS-GF+ [38] and countless others – varying in how they score or compare the experimental spectrum against theoretical spectra, or how the search space is partitioned and prioritized. Due to their performance in both accuracy and speed, they remain the dominant class of tools for peptide identifications. As more and more fragmentation spectra are collected and assembled in public repositories, the use of spectral libraries for peptide identifications have also emerged, despite initial comments that there are simply too many peptides to build an effective spectral library [33]. In spectral library searching, previously observed and identified fragmentation spectra are assembled [39] and compared against experimental spectra. The known fragmentation patterns (intensities of fragment ions) can be more discriminatory than the theoretical spectra predicted by database search tools but the approach is limited only to the previously identified peptides present in the spectral library.
While the complete ion ladder is often missing from fragmentation spectra, there is often a partial ladder that reveals a subsequence of the peptide. Tag-based approaches use this
information by looking for a partial ladder and using the derived information to filter a sequence database [40]. Compared to database searching, the tag-filtered list of candidates is much smaller so more computational intensive operations, such as the identification of unknown modifications [41], can be performed. De novo sequencing tools attempt to identify peptides from
fragmentation spectra without the use of a reference database [42,43]. The main benefit of de novo sequencing tools is that they allow for the identification of peptides that are not known or
present in the reference database. They can also be used to identify post-translational
modifications [44]. However, they are computationally expensive to use and require high-quality spectra, making them impractical in most high-throughput experiments. Hybrid de novo
sequencing methods have been developed to use information from a reference database [45] or fragmentation information from spectral libraries [46].
Regardless of the approach used to identify peptides in a fragmentation spectrum, the output of each tool is the identified peptide, a raw score representing the quality or confidence of the assignment based on the tool’s internal scoring mechanism, and a calibrated score (such as a probability or expectation value) that normalizes the raw score (as it can be heavily dependent on peptide length or spectrum complexity) allowing for quality comparisons between different peptide to spectrum matches (PSMs). However, the quality and accuracy of these calibrated scores is much debated [47].
1.4 Error rate estimation in shotgun proteomics
While peptide identification tools provide scores that estimates the quality of the peptide spectrum match, they do not provide any estimates on the number of false identifications in a given experiment. This problem is complicated by the fact that scores are not comparable
between different identification tools and that the quality assessments of individual PSMs do not have access to information that can be derived from experiment-wide observations, such as the frequency of missed cleavages or instrument mass accuracy and calibration. Hence, peptide validation methods were developed that combines peptide identification scores with auxiliary information in a statistical framework that can estimate the number of correct and incorrect hits. One of the pioneering tools for peptide validation is PeptideProphet [48] which computed a discriminant score for each PSM and used the expectation-maximization algorithm to model the distributions of correct and incorrect hits. The models can then be used to estimate the
probability of correct hits and establish thresholds for controlling error rates in an experiment. These principles also have been extended to proteins to control for error rates at the protein level [49].
Complementary to these modeling based methods, the use of decoy sequences is widespread in shotgun proteomics [50]. Decoy sequences are peptide or protein sequences that are artificial and should not be found in nature. Hence, by searching against decoy sequences, it is possible to estimate the rate of error matches or the distribution of random scores. Decoy sequences were first generated from reversed protein sequences [51] but reversed peptides have been shown to perform similarly and may be superior for high mass accuracy data as they preserve the
distribution of peptide masses. Decoys have also been incorporated into peptide and protein validation models as negative examples in semi-supervised modeling [52,53]. In addition to serving as negative examples in statistical modeling, they can also be used to directly and empirically estimate the false discovery rate in a given experiment. In a common target-decoy approach, a combined database is generated with targets (the protein database of interest) and decoys of equal length (from reversed proteins or peptides). Experimental fragmentation spectra are then searched against this combined database using a peptide identification tool. Under the target-decoy assumption that incorrect assignments will match equally to target and decoy sequences, the number of false positives is equal to the number of decoy matches so the false discovery rate can be estimated by dividing the number of decoy hits to the number of target hits. A scoring threshold can then be set to achieve a target false discovery rate. Not only does the target-decoy approach allow estimation of false discovery rates at the PSM level, it can also be used to estimate FDR at the peptide or protein level.
Error rate estimation in shotgun proteomics remains an area of active development. This is especially true for error rate estimation in very large datasets [8,54,55] and the use of different prior probabilities by integrating abundance information from transcriptomics or proteomics repositories [55,56], both of which are relevant in a proteogenomics context.
1.5 False positives in proteogenomics analyses
While false positives are produced as part of any shotgun proteomics analysis workflow, there are two key considerations that are of particular importance for proteogenomics: class-specific FDR estimation and false identifications of nonrandom nature [7]. In conventional proteomics analyses, a score threshold is selected to achieve a particular FDR for the entire dataset, typically using the target-decoy approach. This approach has proved problematic for proteogenomics
analyses as the likelihoods for identifying novel peptides are different than for abundant peptides and much stronger evidence is needed to support a novel identification. Failure to account for these differences have cause dramatic underestimation of the FDR for novel peptides [57]. In one proteogenomics study examining aberrant peptides in cancer, a global 1% FDR filter resulted in a 36% FDR amongst the novel peptide identifications [58]. Performing FDR estimation
separately for known peptides and novel peptides allowed a 1% FDR to be achieved in both classes. A theoretical analysis of this problem has demonstrated that a more complete annotation of the genome is linked to the degree of FDR underestimation for novel peptides (when a global FDR filter is used) [59]. While there are proteogenomics studies that employ class specific FDR estimation [60], the vast majority do not [3,4,13], leading to over-reporting of novel discoveries.
The second major challenge facing proteogenomics analyses is the high degree of similarity between certain novel candidates and previously identified peptides in the reference database. Many novel peptides in proteogenomics originate from non-synonymous single nucleotide polymorphisms in the sequencing data. As these single amino acid substitutions can be similar or identical in mass with common chemical modifications, spectra of modified peptides can be misidentified as a novel variant peptide [61]. For example, the change in mass for an alanine to serine substitution or a phenylalanine to tyrosine substitution is identical to that of oxidation, an abundant chemical modification. As these incorrect assignments are due to chemically modified peptides, their fragmentation patterns are of a non-random nature and these errors may not be well modeled by the target-decoy strategy. While a number of such errors have been manually curated from the human draft proteome studies [5], there is a need to systematically annotate and study such errors.
1.6 Outline
False positives present two major challenges for proteogenomics analyses. The first concerns the sensitivity of proteogenomics experiments. Discovery of novel peptides involves the testing of large hypothesis spaces generated from sequencing experiments, requiring much stronger evidence for the identification of novel peptides when class specific FDR estimation is applied. When there is an abundance of false positives, the sensitivity of the experiment can be greatly affected making it impossible to detect any novel peptide at a reasonable FDR. The second
involves chemically or biologically modified peptides that might be misidentified as a novel variant peptide. It is unclear whether these false positives are correctly modeled by the target-decoy approach as spectra from modified peptides can resemble spectra of novel variant peptides or other peptides in the reference database and may not match with equal propensity to target and decoy sequences. Even if these misidentifications are effectively captured by the target-decoy strategy, their presence as false positives in proteogenomics analyses might also decrease sensitivity.
The overall aim of this dissertation is to develop computational strategies that address these concerns in proteogenomics analyses. In Chapter Two, I examine the causes and composition of false positives in shotgun proteomics while exploring the effects of modified peptides in false discovery rate estimation using multiple peptide identification tools. In Chapter Three, I develop two database search tools that reduce the computation time required in proteogenomics analyses, enabling more comprehensive peptide identifications that can reduce false positives. In Chapter Four, I refine the open search strategy for identifying modified peptides and apply it to large scale proteomics experiments for profiling modified peptides in a number of proteomics experiments and applications.
CHAPTER II
CHARACTERIZATION AND REMEDIATION OF FALSE
POSITIVES IN PROTEOGENOMICS WORKFLOWS
Portions of this chapter comparing narrow window and open search results have been published in Nature Methods [62]
2.1 Introduction
Manual validation of database search results have revealed several common sources of false positives including poor quality spectra, non-enzymatic cleavage, chemical or post-translational modifications, incorrect monoisotopic peak assignment, and incorrect charge state assignment [63,64]. While computational strategies have been developed to address a number of these sources (semi-tryptic searches, variable modification searches with common chemical modifications, isotope error correction in database search engines etc.), they are not
comprehensive and are not always applied for large datasets due to the computational costs involved. In proteogenomics contexts where the presence of false positives is of much greater concern, these additional computations might be necessary for successful identification of novel peptides. We developed a computational framework for annotating and quantifying the false positives that might be avoided using more extensive analyses. Finding a large number of high confidence false positives is inherently difficult as they are indistinguishable from true positives on the basis of database search and peptide validation scores. Fortunately, the use of the target-decoy strategy [50] provides us with a mechanism to study false positives as target-decoy assignments are incorrect by design. We performed peptide identification using three database search engines [34,36,38] and a blind modification search tool [41] in both tryptic and semi-tryptic modes to quantify the false positives that are due to ambiguous assignments, semi-enzymatic cleavage, and modified peptides.
Next, we took a deeper look at modified peptides to see how they cause false positives and whether such false positives are correctly modeled by the target-decoy strategy. While blind modification search tools can identify modified peptides with unknown modifications, they suffer from reduced sensitivity and are often incompatible with other tools in common proteomics workflows such as those for peptide validation. Hence, there was considerable interest in a recent report [65] exploring the feasibility of searches using wide precursor mass tolerances of hundreds of Daltons (open searches) to identify modified peptides using
conventional database search tools. We applied the open searching concept to identify modified peptides and compared the identifications with those from a conventional narrow window search.
2.2 Materials and methods
2.2.1 Characteristics and sources of high scoring decoys
Datasets and data preparation
A publicly available dataset consisting of a panel of various triple negative breast cancer cell lines and tissue specimens analyzed on a Thermo Scientific Q Exactive mass spectrometer [66] was downloaded from ProteomicsDB (PRDB004167) in vendor .raw format. The Thermo .raw files were converted to the mzML format using vendor provided centroiding and default
parameters using the msconvert.exe tool from ProteoWizard (3.0.7398 64-bit version). For the MODa analysis, the mzML files were further converted to the MGF file format from the mzML files using default parameters.
A human protein database was retrieved from UniprotKB (download date: 2016-07-29) and appended with decoy proteins containing reversed peptide sequences (with prolines left in-place when they are immediately before a trypsin cleavage site to ensure that the distribution of tryptic peptide masses is identical between the forward and decoy space). Common contaminants (cRAP protein sequences from GPMDB and contaminants from MaxQuant) were appended to the concatenated protein database.
Peptide identification pipeline
Peptide identification was performed independently using three different database search engines (Comet[34] 2015.02 rev 1, X! Tandem[36] 2015.04.01.1, MS-GF+[38] v10089) and a blind-modification search tool (MODa[41] v1.51) against the protein database described above in both fully tryptic and semi-tryptic modes. For all searches, trypsin was specified as the enzyme used for digestion with the precursor mass tolerance set to 20ppm. Static carboxyamidomethylation (+57.021464 Da) on cysteine was specified for all tools while oxidation (+15.9949 Da) on
methionine and N-terminal acetylation (+42.0106 Da) were specified as variable modifications in the three database search engines. For Comet and X! Tandem, up to five missed cleavages were allowed (MS-GF+ does not limit the number of missed cleavages). Parent isotopic error
correction was enabled in all search engines (isotope_error = 1 in Comet and –ti “0,2” in MS-GF+). In Comet, the use of neutral loss was disabled and high-resolution MS/MS settings (fragment bin offset 0.0 and fragment bin tolerance of 0.02) were used for scoring. In X! Tandem, the top 100 peaks were used for scoring with a required minimum of 4 matched fragment peaks. For MODa analysis, only a single modification was permitted per peptide with a modification range of -500 to +500 Da. Fragment mass tolerance was set to 0.02 and the high-resolution MS/MS mode was enabled.
X! Tandem output files were converted to the pepXML format using the Tandem2XML tool found in the Trans-Proteomics Pipeline[67] (TPP) version 4.8.0. MS-GF+ outputs were converted from mzIdentML to pepXML using idconvert from ProteoWizard (3.0.6002).
Peptide validation and false discovery rate estimation
Peptide validation was performed individually on each pepXML file in the six (three search engines; tryptic and semi-tryptic) sets of outputs using PeptideProphet[48] (TPP 4.8.0) using the following settings: ‘d’ (report decoy hits), ‘A’ (high mass accuracy model), ‘E’ (use search engine calculated expectation values), ‘P’ (semi-parametric modeling), ‘PPM’ (parts per million in mass model). For each set of analyses, the pepXML files corresponding to the 457 LC-MS/MS runs were read using a custom Java program and false discovery rate estimation was performed empirically using the target-decoy approach at both the PSM level and peptide level
(using the high scoring PSM as a surrogate for peptide probability). Spectrum level and peptide level q-values were assigned for each PSM. No FDR filtering was performed for MODa results.
Integration of peptide identification results
Data integration was performed by first normalizing the scan numbers output by the different tools. X! Tandem indices were 1 smaller than the ones reported by MS-GF+ and Comet while MODa reports scan numbers as the n-th MS/MS scan present in the MGF file starting at 1. PepXML files and MODa results were parsed and converted to a tab-delimited results file with search results for each spectrum query grouped together and numbered using the
MS-GF+/Comet scan numbering.
Screening and interpretation of high scoring decoys
PSMs and peptides were considered a high scoring (PSM and peptide q-values of 0.01 or less) decoy if they matched to a peptide that cannot be found in the forward sequence space for at least one of the three search engines operating in fully tryptic mode. The high scoring decoy is
explained as an Ambiguous Scoring event if a high scoring forward hit is identified by some other search engine. If no such tryptic hit is found, the semi-tryptic search results are considered and a Semi-tryptic explanation is assigned if there is a high scoring semi-tryptic forward hit. MODa results are then examined to determine if there is a modified forward peptide that
explains the spectrum. If no alternate explanation is found for the high scoring decoy after these steps, it is labeled as Unexplained.
2.2.2 Target-decoy assumption is violated by modified peptides and causes
underestimation of error rates
Datasets and data preparation
A deep HEK 293 dataset[65] consisting of 24 LC-MS/MS runs analyzed on a Thermo Scientific Q Exactive mass spectrometer was downloaded from PRIDE (PXD001468). Conversion of vendor .raw files to mzML was performed as previously described.
Peptide identification using MSFragger
Narrow window (100 p.p.m.) and open (500 Da) searching was performed by MSFragger (version 20170103.0) [62] on the HEK 293 dataset against the Ensembl database as described in section followed by peptide validation using PeptideProphet (using the extended mass model) as described in section 3.2.2. Identifications were filtered to 1% FDR at both the PSM and peptide level (using the highest PSM probability).
Generation and database searching of theoretic spectra from modified peptides
The database dump (2014-08-10) of GPMDB[68] was retrieved from their FTP site and parsed using a custom Java program to extract peptide observations from the peptides table. The tryptic peptides generated from an in-silico digestion of the Ensembl 78 human protein database was filtered using the list of GPMDB peptide observations to obtain a list of 282,806 peptides. This list of peptides was further filtered to a set of 73,002 peptides by retaining only peptides that have a methionine residue. A random methionine is selected in each of these peptides and is oxidized in-silico and a theoretical spectrum is generated (with carbamidomethylated cysteines) consisting of singly charged b- and y-ions. The theoretical spectra are written to MGF files with the precursor mass and charge reported in the 2+ state.
Peptide identification was performed using the Comet search engine (version 2015.01 rev. 1) against the same Ensembl 78 protein database (both with reversed protein decoys and reversed peptide decoys) using a 20 p.p.m. precursor mass tolerance in high resolution mode
(fragment_bin_offset of 0.0 and fragment_bin_tol of 0.02). Fully tryptic digestion was specified with up to 1 missed cleavage and the use of neutral loss ions was disabled for scoring. Variable modifications were disabled as intended and static carbamidomethylation was specified for cysteines. Peptide identifications were ordered by their expectation value and binned into 1000 bins to calculate the fraction of target matches in each bin.
2.3 Results
2.3.1 Characteristics and sources of high scoring decoys
We performed fully tryptic searches using three search engines [34,36,38] and applied a 1% FDR filter at both the peptide and PSM level. The target-decoy strategy assumes that incorrect
assignments would match randomly to both targets and decoys. Yet the randomness to which these incorrect assignments are matched to decoy peptides is not well understood and the presence of multiple PSMs supporting the same peptide remains a common filter for additional stringency in proteomics analyses. While the majority of decoy peptides are only supported by a single high scoring PSM, there are many that are supported by tens or even hundreds of PSMs, independent of the search engine used (Figure 2-1). The fact that certain decoy peptides can be supported by hundreds of PSMs suggest that the same is likely to hold true for false positives and that even if a forward peptide is supported by hundreds of high scoring PSMs, it may still be a false positive. The non-uniform nature of these decoy matches across the decoy space indicates that they originate from unaccounted peptides rather than random chemical noise.
Figure 2-1 High scoring decoys can be supported by tens to hundreds of PSMs.
High scoring decoy peptides are grouped based on their number of supporting PSMs for each of the three search engines operating in fully tryptic mode.
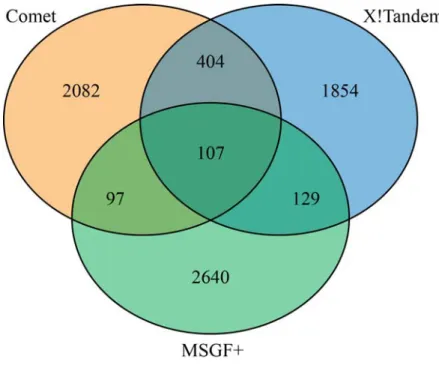
Next, we examined the overlap in high scoring decoy peptide identifications across the three search engines. 7,313 high scoring decoy peptides (at 1% peptide FDR) were identified across the three search engines (Figure 2-2). Surprisingly, only 107 decoy peptides identified by all
three search engines. The vast majority (6,576) of high scoring decoy peptides were only
identified by a single search engine. The lack of agreement between the different search engines illustrates differences in their spectrum similarity and score calibration functions as the same spectrum is either assigned to another incorrect peptide or fails to reach statistical confidence to pass the 1% FDR filter. This lack of agreement can also be used to improve peptide
identifications by combining orthogonal scoring functions in these search engines and removing borderline or conflicting identifications. Indeed, this concept has been used with much success in peptide validation for reducing error rates and improving the number of identifications at a given FDR [69,70].
Figure 2-2 Overlap of decoy peptide sequences across three search engines.
High scoring decoy peptide sequences are compared across three search engines. The vast majority of decoy sequences are unique to a particular search engine.
As these incorrect assignments are likely due to unaccounted peptides, we expanded the search space by performing semi-tryptic searches using the three search engines and a blind
modification tool [41] to account for unanticipated chemical or biological modifications. We also considered instances where identification is ambiguous – cases where a forward peptide and a decoy peptide are both identified with high confidence by two different search engines. These may represent situations where the database search engine is overly confident in its assignment.
Figure 2-3 Explanation of high scoring decoy PSMs.
High scoring decoy PSMs are iteratively explained using fully tryptic, semi-tryptic, and blind modification search results.
We attempted to find explanations for high scoring decoy PSMs in the following order:
ambiguous scoring by the presence of a high scoring forward PSM identified by another search engine, semi-tryptic by the presence of a high scoring semi-tryptic forward PSM identified by any search engine, modified peptide if MODa nominates a modified forward peptide, and unknown if we fail to find a possible explanation for the high scoring decoy PSM (Figure 2-3). In 38.83% of high scoring decoy PSMs, they can be explained by an ambiguous scoring event. For example, the decoy peptide IVESITK was identified with confidence in 286 PSMs. In many cases, the forward peptide LVTDLTK was identified by another search engine. Comparing the matched fragment ions for the two different peptide assignments in one such experimental
spectrum (Figure A-1) shows that the matched fragments are identical in mass and that outside of auxiliary information (such as knowledge of the fragmentation pattern or additional fragments from neutral loss ions), the two identifications are of equal confidence and we lack experimental information to distinguish between the two. While the fragments are measured with high mass accuracy and match to a large number of theoretical fragment ions, the presence of multiple peptides that match equally well highlights the difficulty in confidently identifying short peptides.
Next, we examined the population of decoys that can be explained by a semi-tryptic peptide. 13.39% of high scoring decoy PSMs was confidently identified as a semi-tryptic peptide. In our
example (Figure A-2), the spectrum matching decoy peptide LANLLVGK was reassigned to the semi-tryptic forward peptide LAGGIIGVK in a semi-tryptic search. The semi-tryptic match improved upon the decoy match by matching two additional y-ions of relatively low intensity. While the correct identification may well be the semi-tryptic assignment, the large number of matched high intensity fragments in the decoy assignment once again demonstrates the limitations of current similarity scoring functions as there is little information to distinguish between the two matches.
We then examined the 27.44% of decoy PSMs that are explained by chemical or biological modifications. We posit that this percentage may be heavily dependent on sample complexity and instrument acquisition speeds. In more complex samples, abundant unmodified peptides dominate the peptide ions that are sampled by the mass spectrometer while less abundant modified forms are ignored. The converse is true for fractionated or low complexity samples with few proteins giving modified peptides a greater chance to be sampled. Increasing the
acquisition speed of the instrument or the runtime of the LC-MS/MS run will also likely increase the number of modified peptides sampled and correspondingly, the number of high scoring decoys (and false positives) that are due to unaccounted modifications. In the selected example, the decoy assignment EWHHSHTDITLR fails to match many of the high intensity fragment peaks while the modified peptide assignment of IW[16]HHTFYNELR (oxidation on tryptophan) is of much higher quality, explaining nearly all of the intense peaks in the fragmentation
spectrum (Figure A-3). While tryptophan oxidation is well known, it is often not included in routine peptide identification workflows due to the analysis time required to consider additional variable modifications. This demonstrates the utility of blind modification search tools for improving peptide identifications even when the identification of modified peptides is not the primary goal as they have the ability to eliminate false positives. However, many blind modification search tools are slow and incompatible with conventional peptide identification workflows.
Finally, there remains 20.34% of decoy PSMs that cannot be explained by any of the above analysis. As they are assigned to some decoy PSM with high confidence, they contain peptide fragments and are likely of peptide origin. As they cannot be explained as semi-tryptic peptides
or modified peptides from the reference proteome, they may be ions with incorrect charge state assignment, peptides derived from alternative splicing [7], peptides with no enzyme specificity [71], or even proteasome spliced peptides [72].
Together, these results suggest that improvements to similarity scoring functions are needed to resolve ambiguous assignments and that proper accounting for all peptide forms (semi-tryptic and modified) is necessary for confident peptide identifications.
2.3.2 Target-decoy assumption is violated by modified peptides and causes
underestimation of error rates
High prevalence of peptides identified in modified form only
To further explore the idea that certain false positives are due to modified peptides, we
performed both narrow window and open searching (to account for modified peptides) on a HEK 293 dataset (both searches done without variable modifications). We reason that false positives that are due to modified peptides would be confidently identified in the narrow window search (as a false positive) but not in open search (as the supporting spectra would now be assigned to their correct modified peptide identification). To investigate, we looked at the intersection of search results (at the unique peptide level) by subdividing the peptides on the basis of their estimated confidence (Figure 2-4a) and examined the group-specific FDR.
As expected, peptides that were accepted at 1% FDR in both searches (101,138 in total) were of high confidence, with an estimated FDR of 0.15%. Peptides found in both searches but accepted only at 1% FDR in one of the two searches were of lower confidence, as evidenced by the increased group FDR. Of greatest intrigue to us, however, were the peptides that were confidently identified in one search but were not identified at all in the other.
There were 12,622 peptides confidently identified in open search but not in narrow-window search. The relatively low group FDR of these peptides (4.15%) suggests that most of these are bona fide examples of peptides that were only detected in modified forms. The substantial number of such peptides is problematic for ‘dependent-peptide’ approaches for PTM
identification [73] (including spectral library-based methods) [74,75] that rely on co-identification of the unmodified peptide. A comparison of the modification profile of these peptides to one that is generated from all modified peptides shows high similarity (Figure 2-4b), suggesting that most of these identifications correspond to constitutive or highly abundant modifications.
Figure 2-4 HEK293 peptide identifications across traditional narrow-window and open searches demonstrate underestimation of FDR.
Peptides are subdivided on the basis of their estimated confidences in both open and narrow-window search. Group-specific FDR values are estimated using decoys within each group. (b) Mass difference profiles in open search for spectra that identified a peptide unique to narrow-window search (red) or open search (purple) and for all spectra (boxed). (c) Supporting PSM counts in narrow-window and open search for conflicting peptide identifications involving a peptide found only in narrow-window search (at 1% FDR). (d) Comparison of peptide categories passing 1% FDR in narrow-window search. (e) Target and decoy matches in narrow-window search for spectra identified with a common modification in open search.
Open searching uncovers FDR problem in traditional narrow-window searches
In contrast, the 3,773 peptides identified in narrow-window search but not in open search had a much higher group FDR, of 14.68%. We mapped the spectra supporting these identifications to their results in open search. Of particular interest were spectra that were assigned to unmodified peptides in narrow-window search but reassigned, owing to an improved match, as modified peptides (with different sequence) in open search. These cases represent potential instances of
false positives in narrow-window search that are caused by chemical or biological modifications [76,77]. In each such instance—a pair of peptides whose masses differ by the mass of the modification detected in the open search—we compared the total number of supporting PSMs associated with the peptide sequence matched in narrow-window search to that in open search (Figure 2-4c). Assuming that peptides supported by a greater number of PSMs are more likely to be true identifications, we found substantially more support for the peptides identified in open search. Only 17% of the spectra were assigned to peptides that had greater support in narrow-window search, whereas 68% had greater support for their open-search assignment.
We called peptide identifications found only in narrow-window search to be ‘suspect’ (potential false positives) if there was greater support for the open-search assignment for each supporting PSM. Of the 3,773 peptides found only in narrow-window search, 1,139 were suspect. This is significantly more than the number of decoys (554) in the same group, and more than the total number of decoys in the entire narrow-window search, at 1% FDR (1,091 decoys in total). This suggests that false positives in narrow-window search are not correctly estimated by decoy peptides. Notably, some of these suspect peptides had very high scores (Figure 2-4d).
We sought to verify the finding that the target–decoy strategy does not effectively capture false positives due to unaccounted modifications. We selected high-scoring peptide identifications in open search that were observed in both unmodified form and with a mass shift corresponding to a common modification (oxidation or carbamylation). As we did not specify any variable modifications, the target-decoy assumption is that spectra from these modified peptides would match equally (and incorrectly) to both targets and decoys in narrow-window search. However, that was not the case, as the rate of matching to target sequences was roughly six fold that of decoys for carbamylated peptide spectra, and more than nine fold for oxidized peptide spectra (Figure 2-4e). The violation of the target–decoy assumption is probably due to homology between true peptide sequences and other peptides in the target space, which we previously noted in the context of proteogenomics [7,76]. Further supporting this, the modification profile of peptides identified in open search and whose spectra produced suspect identifications in narrow-window search markedly lacked phosphorylation and aminoethylbenzenesulfonylation (Figure 2-4b). These two mass shifts (79.97 and 183.04 Da) are difficult to represent, as some sequence of amino acid addition and deletion. Overall, our analysis with the HEK293 data set
demonstrates that accounting for all modified peptide forms using the open-search strategy of MSFragger may be important for confident peptide identification, even when the identification of modified peptides is not the primary interest.
Figure 2-5 Spectral homology in theoretical spectra derived from modified peptides.
PSMs of theoretical spectra derived from a peptide with oxidized methionine are ordered by their expectation value and binned to calculate the fraction of target hits as a function of expectation value (a) Analysis performed using reversed protein sequence as decoys (b) Analysis performed using reversed peptide sequences as decoys
Validation of target-decoy violation using theoretical modified spectra
While the searching of experimental spectra identified as modified peptides in a narrow window search suggested that the target-decoy assumption is violated, we must proceed with caution due to the confounding problem of chimeric spectra. In some cases, a modified peptide (the top identification in open search) can be co-fragmented with an unmodified peptide which is then identified (correctly) in the narrow window search that does not account for modifications. To circumvent the problem of chimeric spectra, we generated theoretical spectra for a set of peptides with oxidized methionine. As expected, for the majority of these theoretically pure spectra, they map to both targets and decoys at equal rates. However, for the highest scoring matches, there is a strong preference for target sequences, regardless of the method used in decoy generation (Figure 2-5). Unsurprisingly, some of the highest scoring PSMs are due to single amino acid differences that are equal to the mass of the added oxygen atom (e.g. alanine to serine in
M[16]ASTFIGNSTAIQELFK matches MSSTFIGNSTAIQELFK with e-value 3.62E-20). There are also examples where the peptides differ in the number of amino acids but remain spectrally
similar (e.g. M[16]DVNVGDIDIEGPEGK matches NSHHSWEPLDAPEGK with e-value 4.71E-8). Together, these results show that modified peptides can be potential sources of false positives that are not well modeled by the target-decoy strategy.
2.4 Discussion
In this chapter, we demonstrate that nearly 80% of high scoring false positives can be explained through additional computational analysis. Nearly half of the explainable false positives can be attributed to ambiguous identifications where there is a lack in search engine concordance. This suggest that combining results from multiple search engines [69] or similarity scoring functions might help in identifying these cases and reducing their assigned confidences. It also points to limitations in the scoring functions presently used in database search engines where only a rudimentary model for predicting theoretical spectra is used (equal ion intensities). The use of spectral libraries generated from synthetic peptides [78] or fragment ion intensity prediction programs [32,79] may help resolve such ambiguities and reduce the rate of such false positives in the future. The high confidences with which these ambiguous identifications are reported may also be a consequence of the availability of high mass accuracy data in both MS1 and MS2, where a few matched fragment ions result in high confidences due to a reduction in fragment matches of a purely random nature. The other half of explainable false positives are due to peptides that are excluded (semi-tryptic and modified peptides) from searches due to
computational costs or otherwise complexity in integrating different search results. While the computational costs associated with database searching can be readily addressed, new statistical models may need to be implemented to integrate multiple search spaces, each with different prior probabilities and selecting the explanation with highest posterior probability, to avoid a loss in sensitivity when vastly expanding the search space.
The comparison between open and narrow window search results provides several insights into the properties of modified peptides and their impact on the production of false positives and error rate estimation. Over 10% of the peptides identified were identified only in modified forms, suggesting that methods which can directly identify modified peptides without co-identification of the unmodified peptide (such as tag-based PTM search tools or the open search strategy) are
likely to be the most successful in comprehensive identifying modified peptides and reducing the number of false positives. Second, both the experimental and theoretical results indicate, to varying degrees, that the target-decoy assumption is violated for modified peptides and that modified peptides are more likely to match to target sequences than decoy sequences, causing an underestimation of false positives that are due to modified peptides. The true extent of this violation is of much interest and further experiments using experimental spectra while accounting for the effects of co-fragmentation are needed. It is also important to note the limitations of this study and its generalizability to proteogenomics results. Open modification searching identifies only 50% of common modifications when compared to direct interrogation using specified variable modifications [65]. The underreporting of modified peptides may imply that the number of false positives due to modified peptides may be greater than what was shown in this study. Furthermore, the database searched in this comparison was the Uniprot protein database with few variant peptides or peptides that are highly homologous to one another compared to a database produced in a sequencing experiment. Hence, the error rates for such variant peptides could potentially be higher than what is estimated here. Experiments with decoys designed to contain single amino acid substitutions (confirmed not to exist from sequencing data) would allow us to directly interrogate errors of this nature.
2.5 Data availability
Raw mass spectrometry files are available from public repositories as described. The processed data files supporting the findings of this study are available upon request.
2.6 Acknowledgments
CHAPTER III
EFFICENT DATABASE SEARCH TOOLS FOR
PROTEOGENOMICS ANALYSIS
Portions of this chapter detailing the MSFragger algorithm have been published in Nature Methods [62]
3.1 Introduction
Database search has long been a bottleneck in computational proteomics workflows [20] with continual efforts to improve the speed of identifications to match the pace of instrument acquisition speeds and the growth of protein databases. In proteogenomics experiments, the database to be searched is nearly 10X larger than a reference database, increasing the search time accordingly. Due to the already large search space that decreases sensitivity and long search times, semi-tryptic searches and multiple variable modifications are not commonly used. As demonstrated in the previous chapter, this can lead to an accumulation of false positives when peptide species present in the sample are unaccounted for in the search space. Further
compounding this problem is the increasing popularity of the open search approach for
identifying blind modifications. While simple in its approach (a matter of changing the precursor tolerance to hundreds of Daltons), it is a brute force approach, comparing each experimental spectrum to hundreds of thousands of candidate peptides. This leads to analysis times of over 50 central processing unit (CPU) hours (per LC-MS/MS run) [62] using conventional database search tools, making it costly for large scale analyses. Hence, there is need for faster, more efficient database search tools for proteogenomics analysis.
Computational advances in database search tools often fall in two orthogonal avenues. The first utilizes more advanced or sophisticated computing hardware such as parallel computing
on conventional processors or repurposing specialized hardware such as graphical processing units (GPUs) found in commodity graphics cards [83–85]. The second involves algorithm improvements that reduce the amount of computation needed to obtain peptide identifications of similar quality. This can involve strategies for using heuristics to filter the search space [36,40], improved implementations of scoring functions [86,87], or peptide indexing methods that eliminates redundant peptides and recycles the results of in-silico digestion [88,89]. In this chapter, we present two database search tools. The first, EGADS, utilizes GPUs to accelerate both in-silico digestion and similarity scoring while the second, MSFragger, uses a novel fragment ion-indexing scheme to vastly improve the speed of spectra similarity calculations.
Algorithms that utilizes networked compute clusters can perform high-throughput searches but do not reduce the overall amount of computation time required considering all CPUs, making them costly and financially prohibitive for large-scale analyses. GPUs have been used as a more efficient alternative in many scientific applications as they offer the compute capabilities of hundreds of CPUs in a graphics card costing several hundred dollars. These GPUs consist of thousands of processing cores coupled to fast onboard memory. However, specialized algorithms are needed to function on GPUs due to the limited memories and single instruction multiple data (SIMD) nature of GPU cores where each individual processing cores must perform the same operation in lockstep but on potentially different pieces of data. Due to these complexities, GPUs have only been applied to the spectra similarity scoring step of database search [83,85] which has is more easily parallelizable and is historically the more computationally intensive step of
database searching with low precursor mass accuracies. However, with high resolution instruments that records precursor masses with accuracies on the order of several parts per million [26,27], in-silico digestion may become a bottleneck when only similarity scoring is accelerated. Hence, EGADS implements both GPU accelerated digestion and scoring providing significant speedups regardless of the precursor mass accuracy.
The growing popularity and ease-of-use of the open searching strategy for identifying modified peptides precipitated the development of MSFragger. Open searching using a 500Da window can take nearly 1000X longer than traditional narrow searches with a precursor tolerance in the tens of p.p.m. [62]. The use of traditional search engines is computationally prohibitive on large datasets and GPUs are not widely or inexpensively available from cloud providers. Hence, using
the relatively large amount of system memory, we developed a fragment ion indexing scheme that allows similarity scoring to be rapidly performed simply by traversing the index using experimental fragment ions.
3.2 Materials and methods
3.2.1 EGADS an Efficient GPU-Accelerated Database Search tool
EGADS development environment
EGADS was developed in C++ using Visual Studio 2010 on Windows 7 64-bit. OpenCL support was provided by the AMD APP SDK (version 2.9). Testing was performed on a desktop computer equipped with an Intel 2500K processor with 16GB of memory with an AMD Radeon 7950 GPU with 3GB of memory (using the latest AMD drivers as of May 2013).
Datasets and data preparation
A HeLa dataset [22] consisting of 3 technical replicates each with 6 fractions analyzed on a Thermo Scientific Orbitrap Elite was downloaded from PRIDE (PXD002395). Vendor raw files were converted to MGF using ProteoWizard as previously described. The human protein
database was obtained from Refseq (release 55) and reversed protein sequences were appended as decoys. For the scenarios involving a hypothetical proteogenomics use case, an mRNA database was obtained from Refseq (release 55) and was translated into a protein database using three-frame translation. ORFs shorter than 10 amino acids were discarded in this translation.
EGADS algorithm
(1) Spectra input and pre-processing
EGADS reads MS/MS spectra in MGF format and pre-processes them according to the chosen similarity scoring function after filtering the input spectrum to the specified top N peaks after filtering out peaks with m/z greater than 2048 (as EGADS calculates the Xcorr function using 2048 bins). For the Xcorr scoring function, an offset of 0.4 Da is added to the m/z of each input peak before binning to unit m/z bins (the maximal intensity is taken when there are multiple peaks that fall within the same bin). The 2048 bins are then subdivided into 16 equal windows
and intensities within each window are normalized so that the maximum intensity within each window is 50. The intensities are then transformed into the form necessary for fast cross-correlation [86] by computing cumulative sums. For PeakMatch and PeakBackground, no binning is performed. PeakMatch normalizes the peak intensities so that the maximum intensity is 100, while PeakBackground performs the local normalization as performed in Xcorr using the ranges of 64 m/z but without binning.
(2) Trial digestion and scoring
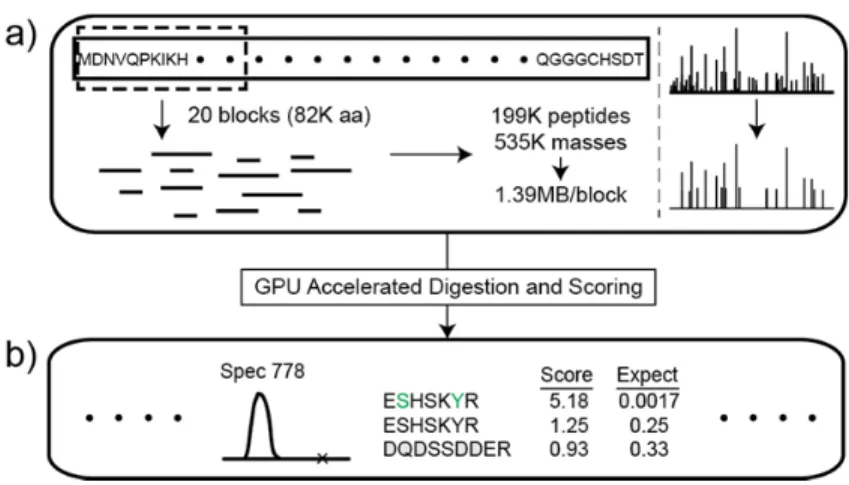
EGADS performs in-silico digestion and simulated scoring (where the number of similarity scores required is calculated but the scoring is not actually performed) on a small region of the database (20 blocks of 4096 characters) to estimate the amount of GPU memory necessary to perform on-GPU digestion and scoring for a given amount of sequence space. EGADS then uses this estimate and the available GPU memory (after accounting for the space necessary to store the database and experimental spectra) to partition the sequence space that can be independently analyzed in multiple digestion-scoring cycles (Figure 3-1).
(3) In-silico digestion and peptide de-duplication
EGADS performs in-silico digestion by first concatenating all proteins (separated by end-of-protein delimiters) into a single string representing the entire sequence space. The string is then subdivided into blocks of 4096 characters that can be analyzed by a single workgroup.
Individual threads scan overlapping ranges of 128 characters in order to determine the number of digested peptides that starts within the first half of its range. These counts are then summarized in scan operations and used to allocate appropriate memory for storing masses and offsets of these digested peptides. The process is repeated to store the digested peptide products.
Peptides are then optionally de-duplicated (within the same digestion-scoring cycle) to eliminate redundant peptides and the number of repeated similarity scoring calculations. We re-pack the digested sequence into a 160-bit integer that is unique for all peptides less than 32 amino acids in length (the upper limit in EGADS). This integer is then iteratively sorted 32 bits at a time using