A. Holzinger and G. Pasi (Eds.): HCI-KDD 2013, LNCS 7947, pp. 136–147, 2013. © Springer-Verlag Berlin Heidelberg 2013
Styles Support Level
Moushir M. El-Bishouty1,2, Kevin Saito1, Ting-Wen Chang1, Kinshuk1, and Sabine Graf1
1
Athabasca University, Canada
2 City for Scientific Research and Technological Applications, Egypt
{moushir.elbishouty,tingwenchang,kinshuk,sabineg}@athabascau.ca, [email protected]
Abstract. Learning management systems (LMSs) contain tons of existing courses but very little attention is paid to how well these courses actually support learners. In online learning, teachers build courses according to their teaching methods that may not fit with students with different learning styles. The harmony between the learning styles that a course supports and the actual learning styles of students can help to magnify the efficiency of the learning process. This paper presents a mechanism for analyzing existing course contents in learning management systems and an interactive tool for allowing teachers to be aware of their course support level for different learning styles of students based on the Felder and Silverman’s learning style model. This tool visualizes the suitability of a course for students’ learning styles and helps teachers to improve the support level of their courses for diverse learning styles.
Keywords: Interactive course analyzer, visualization, learning styles, learning analytics, learning management systems.
1
Introduction
The widespread introduction of learning management systems (LMSs) – such as Blackboard and Moodle has meant that educational institutions deal with increasingly large sets of data. Each day, their systems amass ever increasing amounts of interaction data, personal data, systems information and academic information [1][2]. A combination of the availability of big datasets, the emergence of online learning on a large scale, and political concerns about educational standards has prompted the development of learning analytics research field. According to the call for papers of the 1st International Conference on Learning Analytics and Knowledge (LAK 2011), learning analytics is defined as the measurement, collection, analysis and reporting of data about learners and their contexts, for purposes of understanding and optimizing learning and the environments in which it occurs. Learning analytics is one of the fastest growing areas of technology enhanced learning (TEL) research [3].
The rise of big data in education mirrors the increase in take up of online learning. Currently, LMSs contain tons of existing courses but very little attention is paid to how well these courses actually support learners. In online learning, teachers build courses according to their teaching methods. Teaching methods vary. Some instructors lecture, others demonstrate or discuss; some focus on principles and others on applications; some emphasize memory and others understanding [4]. On the other hand, learners have different backgrounds, motivation and preferences in their own learning processes and web-based systems that ignore these differences have difficulty in meeting learners’ needs effectively [5]. Learners who are given the freedom to explore areas based on their personal interests, and who are accompanied in their striving for solutions by a supportive, understanding facilitator not only achieve higher academic results but also experience an increase in personal values, such as flexibility, self-confidence and social skills [6]. Therefore, when designing instructional material, it is important to accommodate elements that reflect individual differences in learning. One of these elements is learning styles. Understanding a student’s particular learning style and how to best meet the needs of that learning style is essential to perform better learning. Clay and Orwig [7] defined learning style as a unique collection of individual skills and preferences that affects how a person perceives, gathers and processes information. Learning styles affect how a person learns, including also the aspects of how a person acts in a learning group, participates in learning activities, relates to others, and solves problems. Basically, a person’s learning style is the method that best allows the person to gather and to understand knowledge in a specific manner. Once a learner’s particular learning style is detected, it is possible to identify ways to help in improving the learning process [8].
There are many models about learning styles in literature such as Kolb [9], Dunn & Dunn [10], Honey & Mumford [11], and Myers-Briggs [12]. This research paper utilizes the Felder and Silverman’s Learning Style Model (FSLSM) [4] because of its applicability to e-learning and compatibility to the principles of interactive learning systems design [13]. In this model, Felder and Silverman proposed four dimensions of learning styles (active/reflective, sensing/intuitive, visual/verbal, and sequential/global) and teaching styles (active/passive, concrete/abstract, visual/verbal, and sequential/global), where each teaching style corresponds to (matches with) a learning style.
Many researches have been conducted to detect the learners’ learning styles and provide recommendations and adaptations for online courses based on learning styles. Paredes & Rodríguez [14] presented a framework that collects explicit information about the students by means of the Index of Learning Styles (ILS) questionnaire developed by Felder and Soloman [15], adapts the course structure and sequencing to the student's profile and uses the implicit information about students’ behavior gathered by the system during the course in order to dynamically modify the course structure and sequencing previously selected. Graf & Kinshuk [16] introduced a concept for LMSs with adaptivity based on learning styles. They used the open source LMS Moodle as a prototype and developed an add-on that enables Moodle to automatically provide adaptive courses that fit the learning styles of students. Mejía et al. [17] proposed an
approach of an adaptation process that allows adjusting different types of resources to the user’s preferences by means of the identification of the user’s learning style in a LMS. Experimental results of evaluations of such adaptive systems indicated that providing adaptive courses based on students’ learning styles plays an effective role in enhancing the learning outcomes by reducing learning time and increasing learners’ satisfaction [16][18][19].
While most of the previous works focus on identifying students’ learning styles and adapting courses based on the identified learning styles, our research is different in that we present a mechanism to analyze existing course contents in learning management systems and an interactive tool for teachers, which visualizes the suitability of a course for students’ learning styles and helps teachers to improve their courses’ support level for diverse learning styles. In the next section, the mechanism for analyzing course contents is presented; the interactive tool is illustrated in section 3, followed by the conclusions and the future plans of the research in section 4.
2
Course Analyzing Mechanism
This mechanism aims at analyzing an existing course structure and contents in LMS to measure its support level for diverse learning styles that allows teachers to be aware of how well their courses fit with their students’ learning styles. The mechanism currently considers eleven types of learning objects (LOs), as listed below; however, from technical point of view, new types of LOs can easily be included in this mechanism, if required.
• Commentaries: provide learners with a brief overview of the section.
• Content Objects: are used to present the learning material of the course.
• Reflection Quizzes: include one or more open-ended questions about the content of a section. The questions aim at encouraging learners to reflect about the learned material.
• Self-Assessment Tests: include several close-ended questions about the content of a section. These questions allow students to check their acquired knowledge and how well they already know the content of the section through receiving immediate feedback about their answers.
• Discussion Forum Activities: provide learners with the possibility to ask questions and discuss topics with their peers and instructor. While a course typically includes only one or few discussion forums, the course can include several discussion forum activities as LOs that encourage learners to use the discussion forum.
• Additional Reading Materials: provide learners with additional sources for reading about the content of the section, including, for example, more detailed explanations.
• Animations: demonstrate the concepts of the section in an animated multimedia format.
• Exercises: provide learners with an area where they can practice the learned knowledge.
• Examples: illustrate the theoretical concepts in a more concrete way.
• Real-Life Applications: demonstrate how the learned material can be related to and applied in real-life situations.
• Conclusions: summarize the content learned in a section.
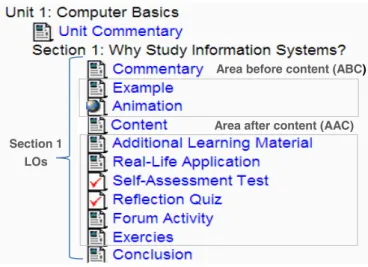
Fig. 1. Section Structure
Decisions on which types of LOs support particular learning styles and at which place/location in the course these types of LOs can support such learning styles are all based on literature from Felder and Silverman [4], who provide a clear description on how learners with particular learning styles prefer to learn.
It is assumed that a course consists of several units and a unit can (but does not have to) consist of several sections. One or more instances of the types of LOs described above can exist in each section. As shown in Fig. 1, a section may (but does not have to) start with a commentary. Subsequently, there is an area before content (ABC) that may include some LOs that aim at motivating the learners and making the section interesting for them. After this area, the content is presented. In the next area, namely area after content (AAC), different types of LOs may be presented. The conclusions of the section can be either right after the last content object or at the end of the section.
The presented mechanism recognizes how well a section of an existing course fits to each of the eight poles of FSLSM (i.e., active, reflective, sensing, intuitive, visual, verbal, sequential and global) by calculating the average of three factors: the availability, the frequency and the sequence of the learning objects in that section, as illustrated below. Consequently, the calculations are applied for each section and then summarized for each unit and for the whole course.
Area before content (ABC)
Area after content (AAC) Section 1
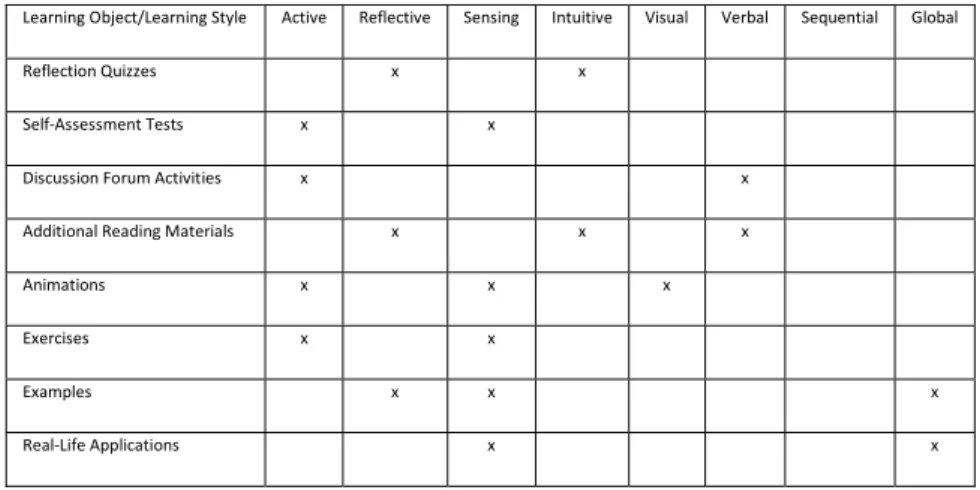
Table 1. The relation between the learning object types and the learning styles
Learning Object/Learning Style Active Reflective Sensing Intuitive Visual Verbal Sequential Global
Reflection Quizzes x x
Self-Assessment Tests x x
Discussion Forum Activities x x
Additional Reading Materials x x x
Animations x x x
Exercises x x
Examples x x x
Real-Life Applications x x
2.1 Availability and Frequency Factors
Certain LO types can support diverse learning styles; on the other hand, it is possible that they have no effect. Table 1 shows the learning object types that fit with each learning style. Since learners with an active learning style prefer to learn by trying things out and discussing with others about the learned material, the availability of self-assessment tests, exercises, animations, and forum activities can support their learning. In contrast to active learners, reflective learners learn by thinking and reflecting about the material. Therefore, the existence of reflection quizzes, additional reading material, and examples fits their needs. Sensing learners prefer concrete material. They are more practical oriented and like to relate the learned material to the real world. Therefore, examples, exercises, animations, self-assessment tests and real-life applications can support their learning. Intuitive learners like abstract material such as concepts and theories, prefer open-ended questions, tend to be more creative, and like challenges. Intuitive learners can be supported by additional reading material and reflection quizzes. Visual learners can benefit from animations. Forum activities and additional reading material are both mostly text-based and therefore support better the learners with a verbal learning style. For sequential learners, providing guidance and a linear increase of complexity in learning is important to support their learning process. Therefore, no particular type of LO would support their learning process more than others. For global learners, it is important to get the big picture of the topic. Therefore, examples and real-life applications would support their learning style more effectively.
Based on the discussion above, the availability of types of LOs is considered as a factor to infer the learning styles that a section of the course fits well. The availability factor measures the existence of LO types that can support each learning style (ls) in a section with respect to all types of LOs that support the particular learning style. The availability factor is calculated using formula 1. On the other hand, the frequency factor measures the number of LOs in the section that support each learning style in
respect to the frequency threshold. The frequency threshold represents the sufficient number of LOs in a section to fully support a particular learning style. This threshold is predefined and can be adjusted by the teacher if needed. If the number of LOs that support a particular learning style (ls) in a section is less than the value of the frequency threshold, then the frequency factor is obtained by formula 2, otherwise the frequency factor takes the value 1, which means a full frequency support level for that learning style.
The obtained values for both, the availability factor and the frequency factor, range from 0 to 1, where 1 indicates a strong suitability for the learning style and 0 means no support. # # (1) # (2) 2.2 Sequence Factor
Not only the types but also the order and the position of the LOs affect the suitability of a course regarding different learning styles. The sequence factor measures the suitability of the sequence of LOs for different learning styles. An active learning style can be supported by the existence of self-assessment tests, exercises and animations at ABC, in order to spark students’ interest in the content, or right after the content. The conclusion of the section can support an active learning style if it is located at its end. Since reflective learners prefer to read the content first before they can think and reflect about it through visiting other LOs, locating the conclusion right after the content, followed by additional learning material, examples and reflection quizzes can support a reflective learning style. Locating examples, animations and/or real-life applications at ABC fulfills sensing students’ interest. Moreover, presenting them in addition to self-assessment tests and exercises right after the content and the conclusion at the end of the section can support a sensing learning style. Since intuitive learners like challenges, locating exercises in the beginning fits with their learning style. Additional reading material and reflection quizzes can support them if they are presented right after the content. Visual learners can benefit from animations if they are located before or right after the content. Forum activities and additional reading materials support verbal learners when they are presented right after the content. Due to the preference of linear increasing of complexity in learning, locating additional reading material, reflection quizzes, self-assessment tests, exercises, and animations right after the content can support sequential learners. For global learners, it is important to get the big picture of the topic. Therefore, presenting the conclusion right after the content followed by examples and real-life applications and locating the activities that require understanding of the material, including reflection quizzes, self-assessment tests, exercises and forum activities, towards the end of the section can support a global learning style.
The sequence factor is calculated for each LO according to its type, location (ABC or AAC) and position within ABC/AAC. It is determined according to how well this object type in that place fits with each of the eight learning styles of FSLSM. The sequence factor for each learning style is calculated using formula 3. In this formula, fls (LO) =1, if the LO is suitable for that learning style at that location, and fls (LO) =0
otherwise. n is the number of LOs in the section. The weight w represents how well the position of a learning object in AAC/ABC fits to the learning style; it is calculated by measuring how far the position of the LO is away from the content. Formula 3 represents the weighted mean of fls(LO). Its value ranges from 0 to 1, where 1
indicates a strong suitability for the learning style and 0 means no support.
∑
∑ , 0 1 (3)
3
Interactive Course Analyzer
Interactive course analyzer is a tool for visualizing the suitability of a course for students’ learning styles. Furthermore, it allows the teacher to play around with the course structure (by adding, moving and/or removing LOs) showing the expected changes in the course support level for diverse learning styles. It aims at helping teachers to improve their course support level by making efficient modifications in the course structure to meet the need of different students’ learning styles.
The interactive course analyzer tool is implemented as a client-server application. It is mainly developed using MySQL relational database management system and PHP scripting language. It is a stand-alone application that runs on the server side. It connects to a LMS database (Moodle as an example), retrieves the existing course structure and applies the mechanism introduced in section 2 to analyze the course contents with respect to learning styles [20].
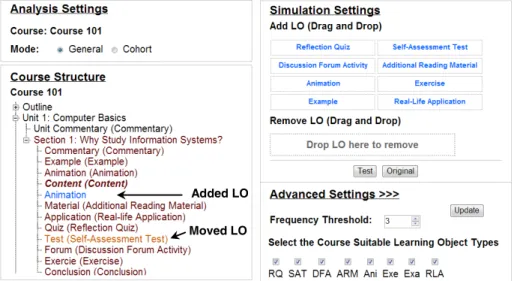
The interface of the tool consists of two parts: the settings part and the visualization part. Fig. 2 illustrates a screenshot of the settings part of the user interface. The Analysis Settings area, shown at the left side of the screenshot, allows the teacher to switch between general and cohort visualization modes (that are explained in the next subsections). In the Course Structure area, the course structure is displayed in terms of units, sections, and a list of LOs in each section. The teacher is able to browse the course and select a particular unit/section by clicking on it. The Simulation Settings area, as displayed at the right side of Fig. 2, allows the teacher to simulate modifications in the course structure. By utilizing drag and drop functionality, the teacher can drag learning objects from the list of learning object types and place them in certain positions in the Course Structure area, drop learning objects from the Course Structure area to remove them, and/or move leaning objects from one place to another one in the Course Structure area. Once the teacher has completed the modifications on the course structure and wants to analyse how his/her modifications change the support level of the course, he/she can press on the Test button. Then the tool analyses the course structure and updates the visualization part respectively. Furthermore, in the Advanced Settings area, teachers can set the value of
the frequency threshold and select the learning object types to be considered while analyzing the course support level.
The visualization part consists of four similar charts that show how well the course and the selected unit/section fit with students’ learning styles. Two of the charts visualize the course support level before and after the modifications made by the teacher in the course structure. Similarly, the other two charts show the selected unit/section support level before and after the modifications.
In the following two subsections, the visualization of the General Mode and Cohort Mode is described in more detail.
Fig. 2. Interactive Course Analyzer (Settings Part)
3.1 General Mode
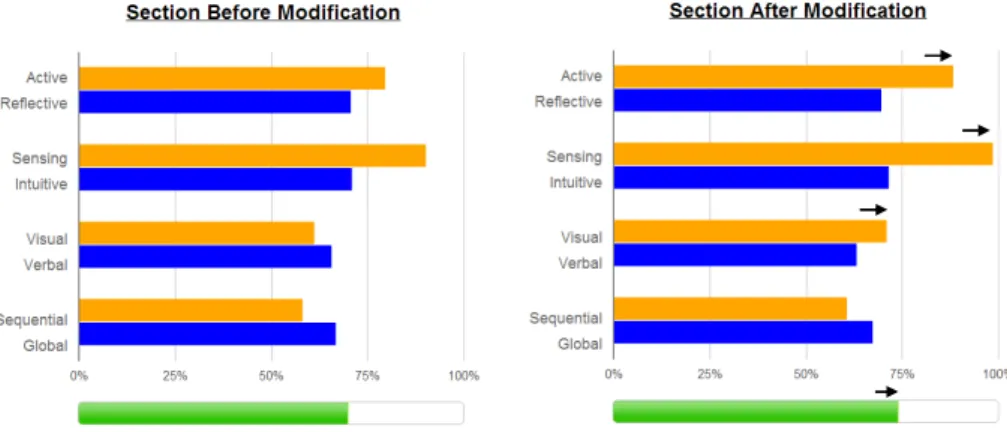
This mode visualizes the support level of a course for diverse learning styles based on FSLSM. Fig. 3 illustrates a screenshot of the visualization part of the selected section in General Mode. Each chart consists of two parts. The upper part of a chart consists of a set of bars to show the strength of the harmony of the course/unit/section with each of the eight learning style poles (i.e., active, reflective, visual, verbal, sensing, intuitive, sequential and global), in terms of percentage (calculated by the average of the three factors illustrated in section 2). Each learning style dimension is represented by two horizontal bars, one for each pole, where the two poles show the two different preferences of the dimension. The longer the bar, the more the course/unit/section fits with the learning style. The lower part of a chart contains only one bar that shows the overall support level of the course/unit/section for diverse learning styles (calculated by the average of the support level of the eight poles). Once the teacher moves the cursor over any bar, a tooltip appears to display more details about the analysis factors illustrated in section 2.
Added LO
For examples, as shown in Fig. 2, the teacher made two modifications in the selected section “Why Study Information Systems?” (displayed in brown): the “Animation” learning object was added (displayed in blue), and the “Self-Assessment Test” learning object was moved within the section (displayed in orange). After re-analyzing the course considering the two modifications and by comparing the two charts in Fig 3, it can be noticed that the section support levels for active, sensing and visual learning styles were improved (as shown in the right chart by the black arrows). Consequently, the overall section support level for diverse learning styles was improved as well (as shown at the bottom of the right chart).
Fig. 3. Visualization Part of a Selected Section (General Mode)
3.2 Cohort Mode
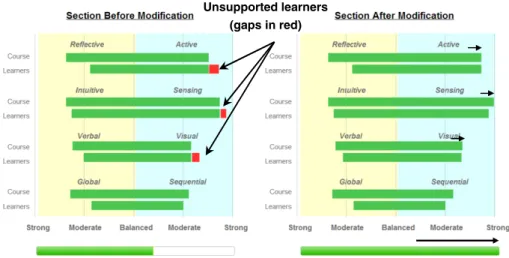
Cohort Mode visualizes the support level of a course in respective to the learning styles of the cohort of students’ enrolled in that course. Fig. 4 illustrates a screenshot of the visualization part of a selected section in Cohort Mode. The charts visualize the data about students’ learning styles (which can be calculated, for example, through the ILS questionnaire [15] or by a tool like DeLeS [21]) in comparison with the course support level (calculated by the average of the three factors illustrated in section 2). As shows in Fig. 4, each learning style dimension in a chart contains two bars; the upper one shows the course/unit/section support level for each poles of that dimension (for examples, “active” on the right and “reflective” on the left); the lower bar shows the learning styles of the respective cohort of students, in terms of different levels varying from strong to balanced. In case that all students are fully supported, the bar will be displayed in green color, otherwise a gap will be shown in red. The intensity of the red color indicates the number of unsupported students.
For example, the chart at the left side (Fig. 4) shows that reflective, intuitive, verbal, global and sequential learners are well supported by the course. On the other hand, active, sensing and visual learners are not fully supported; there are gaps
between the course support level for that learning styles and the learning styles of the respective cohort of students. Once the teacher moves the cursor over any bar, a tooltip appears to display more information about the level of support and the number of supported and unsupported students. Considering the example mentioned in the previous section and the teacher’s modifications in that example, the chart at the right side (Fig. 4) shows that the gaps between the course support level and the learning styles of the respective cohort of students were eliminated, and the students were fully supported (as shown at the bottom of the right chart).
Fig. 4. Visualization Part of a Selected Section (Cohort Mode)
4
Conclusions and Future Work
This paper presents an interactive tool for analyzing existing course contents in learning management systems and providing teachers with information regarding how well their courses fit with students’ learning styles based on the Felder and Silverman’s learning styles model. A mechanism is proposed and utilized in the tool for identifying the course support level for diverse learning styles by calculating three factors: the sequence, the frequency and the availability of learning objects types in that course. The tool provides a teacher with an interactive graphical user interface, which can be used to analyze and visualize the course support level. Moreover, it allows the teachers to try out modifications in the course structure (e.g., adding learning objects) and see what impact such modifications have in terms of improving the support level of a course for students with different learning styles. It aims at helping the teacher to decide on what necessary modifications to make before implementing them “actually” in the LMS. The interface of the tool contains two modes: General Mode, which helps the teacher to improve the course support level
Unsupported learners (gaps in red)
for general learning styles and Cohort Mode that helps the teacher to improve the course support level for the current cohort of students enrolled in that course.
Plans for future research include providing teachers with automatic recommendations on how to best extend their courses to support more students with different learning styles and to fit the courses with the current cohort of learners.
Acknowledgements. The authors acknowledge the support of NSERC, iCORE,
Xerox, and the research-related gift funding by Mr. A. Markin.
References
1. Mazza, R., Milani, C.: GISMO: A graphical interactive student monitoring tool for course management systems. In: T.E.L. 2004 Technology Enhanced Learning 2004 International Conference, Milan, Italy (2004)
2. Romero, C., Ventura, S., García, E.: Data mining in course management systems: Moodle case study and tutorial. Computers & Education 51(1), 368–384 (2008)
3. Ferguson, R.: The State of Learning Analytics in 2012: A Review and Future Challenges. Technical Report KMI-12-01, Knowledge Media Institute, The Open University, UK (2012), http://kmi.open.ac.uk/publications/techreport/kmi-12-01 4. Felder, R., Silverman, L.: Learning and Teaching Styles. Journal of Engineering
Education 94(1), 674–681 (1988)
5. Atman, N., Inceoğlu, M.M., Aslan, B.G.: Learning Styles Diagnosis Based on Learner Behaviors in Web Based Learning. In: Gervasi, O., Taniar, D., Murgante, B., Laganà, A., Mun, Y., Gavrilova, M.L. (eds.) ICCSA 2009, Part II. LNCS, vol. 5593, pp. 900–909. Springer, Heidelberg (2009)
6. Motschnig-Pitrik, R., Holzinger, A.: Student-Centered Teaching Meets New Media: Concept and Case Study. IEEE Journal of Educational Technology & Society 5(4), 160– 172 (2002)
7. Clay, J., Orwig, C.J.: Your learning style and language learning. Lingual links library. Summer Institute of Linguistic, Inc. (SIL), International version 3.5 (1999)
8. Onyejegbu, L.N., Asor, V.E.: An Efficient MODEL for Detecting LEARNING STYLE Preferences in a Personalized E-Learning Management System. Cyber Journals: Multidisciplinary Journals in Science and Technology, Journal of Selected Areas in Software Engineering, JSSE, May Edition (2011)
9. Kolb, A.Y., Kolb, D.A.: The Kolb Learning Style Inventory. Version 3.1, Technical Specification. Hay Group, Boston (2005)
10. Dunn, R., Dunn, K., Price, G.E.: Learning Style Inventory. Price Systems, Lawrence, KS (1996)
11. Honey, P., Mumford, A.: The Learning Styles Helper‘s Guide. Peter Honey Publications Ltd., Maidenhead (2006)
12. Myers, I.B., McCaulley, M.H.: Manual: A Guide to the Development and Use of the Myers-Briggs Type Indicator. Consulting Psychologists Press, Palo Alto (1998)
13. Kuljis, J., Liu, F.: A Comparison of Learning Style Theories on the Suitability for Elearning. In: Hamza, M.H. (ed.) The IASTED Conference on Web Technologies, Applications, and Services, pp. 191–197. ACTA Press (2005)
14. Paredes, P., Rodríguez, P.: A mixed approach to modelling learning styles in adaptive educational hypermedia. Advanced Technology for Learning 1(4), 210–215 (2004)
15. Felder, R.M., Soloman, B.A.: Index of Learning Styles Questionnaire. North Carolina State University (2012),
http://www.engr.ncsu.edu/learningstyles/ilsweb.html
16. Graf, S., Kinshuk, K.: Providing Adaptive Courses in Learning Management Systems with Respect to Learning Styles. In: Richards, G. (ed.) The World Conference on E-Learning in Corporate, Government, Healthcare, and Higher Education (e-Learn), pp. 2576–2583. AACE Press, Chesapeake (2007)
17. Mejía, C., Baldiris, S., Gómez, S., Fabregat, R.: Adaptation process to deliver content based on user learning styles. In: International Conference of Education, Research and Innovation (ICERI 2008), pp. 5091–5100. IATED, Madrid (2008)
18. Popescu, E.: Adaptation provisioning with respect to learning styles in a web-based educational system: An experimental study. Journal of Computer Assisted Learning 26, 243–257 (2010)
19. Tseng, J.C.R., Chu, H.C., Hwang, G.J., Tsai, C.C.: Development of an adaptive learning system with two sources of personalization information. Computers & Education 51, 776–786 (2008)
20. El-Bishouty, M.M., Chang, T.-W., Kinshuk, K., Graf, S.: A Framework for Analyzing Course Contents in Learning Management Systems with Respect to Learning Styles. In: Biswas, G., et al. (eds.) The 20th International Conference on Computers in Education(ICCE 2012), pp. 91–95. Asia-Pacific Society for Computers in Education, Singapore (2012)
21. Graf, S., Kinshuk, K., Liu, T.-C.: Supporting teachers in identifying students’ learning styles in learning management systems: An automatic student modelling approach. Educational Technology & Society 12(4), 3–14 (2009)