Modeling user rating preference behavior to
improve the performance of the collaborative
filtering based recommender systems
Mubbashir Ayub1☯, Mustansar Ali Ghazanfar1☯, Zahid MehmoodID2☯*, Tanzila Saba3☯,
Riad Alharbey4☯, Asmaa Mahdi Munshi4☯, Mayda Abdullateef Alrige5☯
1Department of Software Engineering, University of Engineering and Technology, Taxila, Pakistan, 2Department of Computer Engineering, University of Engineering and Technology, Taxila, Pakistan, 3College of Computer and Information Sciences, Prince Sultan University, Riyadh, Saudi Arabia,4College of Computer Science and Engineering, University of Jeddah, Jeddah, Saudi Arabia,5Information Systems Department, Faculty of Computing and Information Technology, King Abdulaziz University, Jeddah, Saudi Arabia
☯These authors contributed equally to this work.
Abstract
One of the main concerns for online shopping websites is to provide efficient and custom-ized recommendations to a very large number of users based on their preferences. Collabo-rative filtering (CF) is the most famous type of recommender system method to provide personalized recommendations to users. CF generates recommendations by identifying clusters of similar users or items from the user-item rating matrix. This cluster of similar users or items is generally identified by using some similarity measurement method. Among numerous proposed similarity measure methods by researchers, the Pearson correlation coefficient (PCC) is a commonly used similarity measure method for CF-based recom-mender systems. The standard PCC suffers some inherent limitations and ignores user rat-ing preference behavior (RPB). Typically, users have different RPB, where some users may give the same rating to various items without liking the items and some users may tend to give average rating albeit liking the items. Traditional similarity measure methods (including PCC) do not consider this rating pattern of users. In this article, we present a novel similarity measure method to consider user RPB while calculating similarity among users. The pro-posed similarity measure method state user RPB as a function of user average rating value, and variance or standard deviation. The user RPB is then combined with an improved model of standard PCC to form an improved similarity measure method for CF-based rec-ommender systems. The proposed similarity measure is named as improved PCC weighted with RPB (IPWR). The qualitative and quantitative analysis of the IPWR similarity measure method is performed using five state-of-the-art datasets (i.e. Epinions, MovieLens-100K, MovieLens-1M, CiaoDVD, and MovieTweetings). The IPWR similarity measure method per-forms better than state-of-the-art similarity measure methods in terms of mean absolute error (MAE), root mean square error (RMSE), precision, recall, and F-measure.
a1111111111 a1111111111 a1111111111 a1111111111 a1111111111 OPEN ACCESS
Citation:Ayub M, Ghazanfar MA, Mehmood Z,
Saba T, Alharbey R, Munshi AM, et al. (2019) Modeling user rating preference behavior to improve the performance of the collaborative filtering based recommender systems. PLoS ONE 14(8): e0220129.https://doi.org/10.1371/journal. pone.0220129
Editor:Chi Ho Yeung, Education University of Hong
Kong, CHINA
Received:March 5, 2019
Accepted:July 9, 2019
Published:August 1, 2019
Copyright:©2019 Ayub et al. This is an open
access article distributed under the terms of the Creative Commons Attribution License, which permits unrestricted use, distribution, and reproduction in any medium, provided the original author and source are credited.
Data Availability Statement:All the relevant data
and its supporting information files (including Java source code) of the manuscript can be accessed by visiting the following publicly accessible URL of figshare data repository:https://figshare.com/ articles/Article_PLoS_One_data_files_PONE-D-19-02116/8039942.
Funding:The authors received no specific funding.
Competing interests:The authors have declared
Introduction
The advancements in machine learning revolutionized the e-commerce business in the last decade. The companies are taking advantage of these advancements by providing users a pleth-ora of online resources for shopping. People are now more interested in buying things online rather than in the old traditional way. In addition, users connect with their friends and col-leagues through social networking sites and get reviews about different products. This para-digm shift of shopping and user attitude led to the information overload problem, where users can buy items from millions of online shopping stores. This leads companies to deal with so-called big data problem [1]. Recommender systems aim at solving the information overload problem by recommending products and information to users based on their need and prefer-ences of the community [2,3].
A few renowned examples of recommender system are Amazon [4], YouTube [5], and Google news [6]. Recommender system uses several categories for creation and generation of information [7]. There are two basic entities in the recommender systems, namely users and items. An active user is a user that is utilizing the recommender system, expresses opinions and provides ratings about different products. The recommender systems apply intelligent fil-tering methods to rate and recommend items to active users. The two main categories of rec-ommender system are content-based filtering (CBF) and collaborative filtering (CF). The CBF gathers information using the content of items. The main concept of CBF is that the users may like a similar type of items as they liked in the past. In this type of recommender system filter-ing, user profile record the user interaction with the recommender system and preserve the users’ interests and preferences. For example, LIBRA which is a recommender system for the books. The main concept of CF is that people who agree in the past also agree in the future too. An active user makes a prediction on the target items to find out other similar users called neighbors. The CF is further divided into two types, which are memory-based CF and model-based CF. The memory-model-based CF uses the rating data to find similar users or items [8]. Differ-ent commercial systems are using the memory-based CF for the recommendation. It is effi-cient and easy to implement. The main focus of this article is to overcome the issues of memory-based CF for the recommender system. The model-based CF discovers latent factors and uses this latent factor to make predictions. Some common examples of the model-based CF are clustering models [9], Bayesian networks[10], singular value decomposition (SVD)[7], and kernel-mapping recommender (KMR) system based algorithms[11]. The memory-based CF gives more significant results for the recommender system. However, its shortcoming is that it takes too much time in case of a large number of users and items. The model-based CF gives faster recommendations as compared to the memory-based CF because it can run off-line to reduce recommendation time. However, shortcomings of model-based CF are that it cannot gives accurate results as compared to the memory-based CF as well as it cannot give out of box recommendation. Despite several benefits, CF also suffers from some limitations like data sparsity and cold-start problems [7]. Data sparsity problem arises when the number of rated items are very low as compared to the items to predict. It occurs due to an overlap between the items rated by two users is too narrow or not exist. The cold start scenario is a problem for a particular item, which holds no ratings or an extremely low number of ratings [12]. In some conditions, CF lacks the ability to provide reliable recommendations due to diverse user interests or when items have different contents [7]. In E-commerce, this problem is called Multiple-interest and Multiple-content recommendation problem [13]. Considering the aforementioned problems of CF, researchers proposed different hybrid methods to improve the performance of the recommender systems such as demographic and semantic
information [14–19]. These recommender system methods also use traditional similarity mea-sures like the Pearson correlation coefficient (PCC) [13,20,21].
Traditional CF-based methods compute similarities between users for all co-rated items as well as for those items that are different than the target items. Therefore, the neighbors for the active user remain the same even for different items. The most important part of the CF-based method is to find similarities between different users. The commonly used recommender sys-tems are based on traditional similarity measures like PCC or cosine vector similarity [13,20,
21], which consider only local context information. There are still some issues in traditional similarity measures despite their enormous success. Traditional similarity measures calculate user similarity without considering user RPB. Generally, many users do not rate items accord-ing to their quality. These users can be categorized into two types; one that rates every item with almost the same rating leading to zero variance in their ratings. Second, those who give an average rating to all items regardless of the item quality. This creates a serious problem while calculating similarities among users, which often leads to poor recommendations[22]. The miniature research is carried to handle this type of user behavior despite its high impact on recommendations [23–26]. There are several design objectives, which need to be intended to make the recommender system successful, which are discussed below:
a) Accurate:Accuracy is one of the most important design objectives of the recommender system. The accuracy helps to build the trust of users when they interact with the recom-mender system. When a user buys any product recommended to him and starts using it after some time the user realize that the system has given the wrong recommendation about that product. Consequently, a user stops trusting that recommender system. Therefore, the main objective of a recommender system is to give an accurate prediction for items to any user. The proposed IPWR similarity measure method gives accurate recommendations as compared with the state-of-the-art similarity measure methods used for the recommender systems.
b) Scalable:A good recommender system should be able to handle large datasets and gen-erate predictions in real time. When the number of users and items increases, the search space grows as well, then it may be difficult to give result in real time, if the recommender system is not scalable. There is always a conflict between accuracy and scalability of a recommender system.
c) Overspecialization:In CF-based methods, items are recommended to a user, which are most similar to a user profile. Typical methods of recommender systems cannot give any rec-ommendations about non-co-rated items. The IPWR similarity measure method also over-comes such a scenario by considering ratings of the non-co-rated items.
In this article, we present a novel method for recommender system known as IPWR simi-larity measure. It takes into account the user RPB towards an item rating to improve standard PCC similarity measure method. To record the user RPB, two methods are proposed: the first method uses mean and variance for each user and it is known as IPWR with variance. The sec-ond method uses mean and standard deviation (SD) for each user and it is known as IPWR with SD. The results from either method are then linearly combined with improved PCC simi-larity measure method. The performance of the IPWR simisimi-larity measure method is evaluated on the four state-of-the-art datasets for recommender systems using state-of-the-art similarity measure methods. The IPWR similarity measure outperforms state-of-the-art similarity mea-sures in terms of MAE, RMSE, precision, recall, and F-measure.
The main contributions of this article are as follows:
1. A simple yet highly effective similarity measure method is proposed to model the rating preference behavior (RPB) of users.
2. Standard PCC similarity is improved by overcoming some of its shortcomings. These short-comings are discussed in a subsection of “Related Work” section entitled as “Shortshort-comings of standard PCC”.
3. Improved PCC similarity is then adaptively combined with RPB of users.
4. The IPWR similarity measure method not only considers local context information but also take into account the global preference of user ratings.
5. The IPWR similarity measure method can handle the scenarios if no co-ratings are found between two users, as in generally cold start scenarios.
The rest of the sections of this article are organized as follows: Section 2 describes the state-of-the-art literature related to recommender systems. Section 3 describes the methodology of the IPWR similarity measure. Section 4 presents the experimental results and discussion of the IPWR similarity measure method and its comparison with state-of-art similarity measure methods. Section 5 concludes the IPWR similarity measure method and presents future research directions.
Related work
Collaborative filtering (CF) is now commonly used in many fields for personalized recommen-dation [2,12,13,27–32]. However, there are also some issues in collaborative filtering (CF), like accuracy, scalability, and cold start, etc. In this paper, the main focus is to improve the pre-diction accuracy. In CF, items are recommended to users’ according to their preferences, therefore, it is very important that the history of users’ preferences must be available. Different researchers worked on prediction accuracy to improve the performance of the recommender systems. For instance, Ahn et al. [20] propose a solution for CF known as proximity impact popularity (PIP) measure to address the shortcomings of standard PCC and cosine similarity. The PIP measure is the combination of three different aspects of user ratings, which are prox-imity, impact, and popularity. The PIP similarity only considers the local information of user rating, while the global preference of user ratings is ignored. Moreover, the results of the rec-ommender system using PIP similarity measure are not normalized, which makes it difficult to combine it with other similarity measures. To resolve this issue, the weighted Pearson corre-lation coefficient (WPCC) method is proposed in. In WPCC[33], the idea of detaining confi-dence is considered that can be placed on the neighbors. When the number of rated items increases, the confidence also increases and vice versa. Jamali et al.[34] propose a similarity measure, which is based on the sigmoid function. This similarity measure can weaken the sim-ilarity of small common rated items among users. J. Bobadilla[35] propose adjusted cosine similarity to overcome the deficiencies of traditional cosine similarity, however, it does not consider the users’ preferences.
Bobadilla et al.[36] propose a novel similarity measure, which utilizes two similarity mea-sures that are the mean squared difference and Jaccard similarity measure. Another metric called mean Jaccard difference (MJD) is proposed to address the cold start problem. Three steps are included in this metric to address the cold start problem. Firstly, the similarity metric is selected. The second step is an evaluation, in which weights are evaluated using neural net-works. The last step is a prediction, which is obtained according to the selected similarity met-ric. [35]proposed a novel similarity measure known as a singularity-based similarity measure. In this similarity measure, it is assumed that the obtained results can be improved by taking contextual information. The user ratings are grouped as positive and negative and the singular-ity value of user and item is computed. The experimental results show the effectiveness of the
proposed similarity. The significance-based similarity measure is proposed by Bobadilla et al. [35]. In this method, the significance of an item, the significance of a user, and the significance of an item for a user are computed. Then according to significance, similarity among users is computed using a standard Pearson correlation coefficient or cosine similarity. It also uses a data smoothing technique for similarity measure, which is the most widely used technique of recommender systems. Different sparsity measures are also used to improve the accuracy of the recommender system. H. Ma et al. [37] propose a similarity measure, in which information of users and items is taken into account and threshold for both are set, respectively. SongJie Gong et al.[38] propose another method to fill the missing ratings by merging SVD and item-based recommender. It uses the item-item-based method to recommend items to the user.
Szwabe et al. [39] propose a hybrid recommender system method that occupies two-stage data. It processes the data with content features that describe the items and users’ preferences. It improves the accuracy of a system without raising the computational complexity. Moreover, probabilistic matrix factorization is also merged in the recommender system to address issues like data sparsity, cold start, etc. N. Polatidis[40] also propose a novel similarity measure, which uses four different thresholds on a number of co-rated items using PCC to improve the accuracy of the recommender system. Liu et al.[33] also propose a novel similarity measure known as the new heuristic similarity method (NHSM). It computes three parameters, which are proximity, significance, and singularity for each co-rated item. After that, each computed parameter is multiplied by modified Jaccard similarity. The obtained similarity is then again multiplied with a function named as URP to obtain the resultant NHSM similarity [20]. The computation of NHSM-based similarity is complex and lengthy, which makes it difficult to produce a result in real time for the recommender system. All factors in NHSM are again and again multiplied, which ultimately weakens the performance and combining these results with some other similarity measure becomes difficult. A novel similarity measure based on the Bhattacharyya coefficient is proposed by Bidyut Kr. Patra et al. [41]. This method considers both co-rated and non-co-rated items for similarity measure. The resultant similarity measure is a linear combination of the Bhattacharyya coefficient, PCC similarity, and Jaccard similarity. Shuang-Bo Sun et al. [42] propose a novel similarity measure, which combines triangle and Jaccard similarities to improve the performance of the recommender system. Sadasivam et al. [43] propose a novel similarity measure for recommender system, which modifies the Bhatta-charyya coefficient using an exponential function and then combined it with Jaccard followed by proximity, significance, and singularity (PSS) measures using a weighted scheme.
Shortcomings of standard PCC
The standard PCC suffers from some shortcomings, which are discussed below in conjunction with Cosine and CPCC similarity measures.
Shortcoming 1: Flat value of ratings. In case user1 rating vector is flat such as (1,1,1) or (3,3,3) or (5,5,5) and user2 rating vector is (1,5,1), PCC will be not a number (NaN). Cosine value will be 0.777 and CPCC value depends upon whether the rating vector is above, equal to or below the median rating value of the rating scale. CPCC value will be +0.333, if rating vector consists of rating values less than median value (i.e. median value = 3), and will be -0.333 if rat-ing values are greater than median value and CPCC, is NaN if all ratrat-ing values are 3.
Shortcoming 2: Only single co-rated item. In case two users contain a single co-rated item, then PCC will be NaN and Cosine will be 1.0. There are two cases for CPCC. In the first case, when the value of rating for both users is equal then the value of CPCC is 1.0 for all values above or below than median value and NaN if rating value is equal to the median value. In the second case, if both users common rating value is different, then CPCC is also NaN.
Shortcoming 3: Ignorance of user rating preference behavior (RPB). The rating prefer-ences may vary from user to user. Some users may rate every item high and some may rate every item low. This scenario of user RPB is not considered in standard PCC.
Shortcoming 4: Ignorance of corresponding item average rating in case of user-based CF. In case of user-based CF, standard PCC only consider the average rating of users and ignores the average rating of the corresponding item. Similarly, in the case of item-based CF, user averages are also ignored.
Keeping in view the aforementioned shortcomings of the standard PCC, the proposed IPWR similarity measure method is named as improved PCC weighted with RPB (IPWR). In the IPWR similarity measure method, user RPB is modeled as a Cosine function of user aver-ages and variance or SD. Almost all the aforementioned method in the related work, as well as state-of-the-art similarity measure methods for recommender system, ignore this behavior of a user rating. After that, calculated user RPB is linearly combined with improved PCC to enhance the performance of the IPWR similarity measure method.
The IPWR similarity measure method
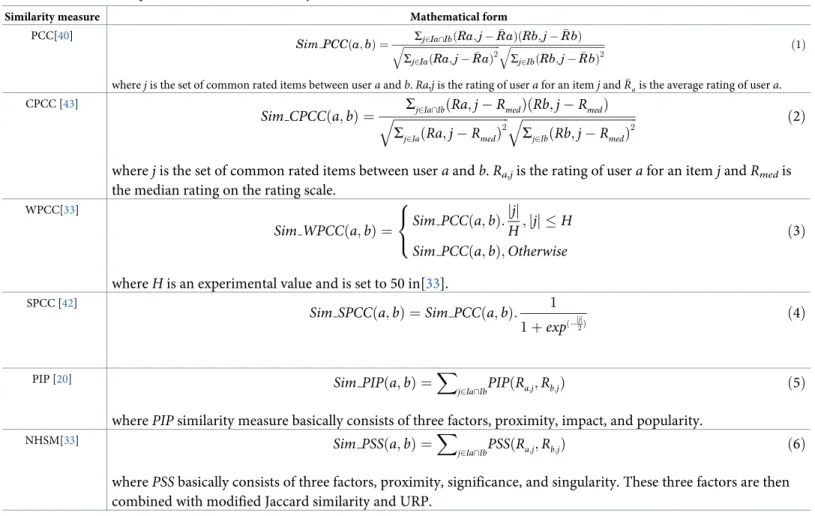
In this section, we explain the methodology of the IPWR similarity measure that is used in mem-ory-based CF to improve the performance of the recommender system. We denote the set of users byU= {a,b,c,. . .,z}3320 and a set of items are denoted byI= {i0,i1,i2,. . .,im}. Each user (e.g. denoted bya) rates a set of items denoted byIa. The rating of a userafor itemiis denoted byRa,i and it can be any real number (normally ratings are represented by real numbers in some range [min, max]). The mathematical representation of different similarity measures that are used as a performance comparison with the proposed IPWR similarity measure is presented inTable 1.
As discussed earlier, almost all methods of the similarity measure for the recommender sys-tem uses the co-ratings provided by the user. There are many users whose rating preference behavior is different than normal users. They tend to rate items according to their own behav-ior. Some users may rate every item low whether the item is good or bad. They may do this for bad items or even for good items. There is the second category of users who rate every item high whether that item is good or bad. These types of behavior of the user are termed as rating preference behavior (RPB). In this article, to handle such behaviors, the IPWR similarity mea-sure method uses variance or standard deviation (SD) of each user using a Cosine function. The variance for the userais calculated as follows:
vara¼ Sj2I aðRa;j R�aÞ 2 jIaj ð7Þ
whereRa,jrepresent the rating of userafor itemj,R�arepresents the mean of ratings for the useraandIarepresents a set of items rated by usera. The SD for the useracan be calculated as follows: SDa ¼ ffiffiffiffiffiffiffiffi vara p ð8Þ
wherevarain Eq (8) denotes the variance of usera. The calculated values of variance and SD can be used to calculate RPB for two users separately. TheRPB(a,b)function which uses vari-ance is denoted byRPB(a,b)using varand ifSDis used then it is denoted byRPB(a,b)using SD and mathematical represented using Eq (9) and Eq (10), respectively as follows:
RPBða;bÞusing var¼cosðjR�a R�bj:jvara varbjÞ ð9Þ
In Eq (9) and Eq (10),R�aandR�brepresents the mean of ratings by useraand mean of ratings for userb, respectively. The cosine function is used to model the RPB of two users. The cosine function is the most commonly used function, which is used by the similarity measure meth-ods either in CF or CB-based recommender systems in the literature. In addition, if two users have the same average rating and variance or SD value, then there RPB will be equal to 1. The use of the Cosine function also results in normalized values whose range is from -1 to +1, which is another reason to use cosine function. In the proposed IPWR similarity measure method, we intend to improve the standard PCC. The standard PCC works only on co-rated items and suffers from shortcoming 4 as discussed in the subsection of related work section entitled as “shortcomings of standard PCC”. To tackle shortcoming 4, both user and item aver-age ratings are used as mentioned in Eq (11). The resultant similarity is given the name of improved PCC similarity measure which is denoted bySim_IPCC. Furthermore, the standard PCC ignores users rating pattern, which is also estimated by IPWR similarity measure method using full rating information in the form of user averages and variance or SD.
Sim IPCCða;bÞ¼
Sj2I a\Ib½ðRa;j�R�aÞ ðRa;j�R�jÞ� � ½ðRb;j�R�bÞ ðRb;j�R�jÞ� ffiffiffiffiffiffiffiffiffiffiffiffiffiffiffiffiffiffiffiffiffiffiffiffiffiffiffiffiffiffiffiffiffiffiffiffiffiffiffiffiffiffiffiffiffiffiffiffiffiffiffiffiffiffiffiffiffi Sj2I a½ðRa;j�R�aÞ ðRa;j�R�jÞ� 2 q ffiffiffiffiffiffiffiffiffiffiffiffiffiffiffiffiffiffiffiffiffiffiffiffiffiffiffiffiffiffiffiffiffiffiffiffiffiffiffiffiffiffiffiffiffiffiffiffiffiffiffiffiffiffiffiffiffi Sj2I b½ðRb;j�R�bÞ ðRb;j�R�jÞ� 2 q ð11Þ
Table 1. A mathematical representation of different similarity measures.
Similarity measure Mathematical form
PCC[40] Sim PCC a;ð bÞ ¼ Sj2Ia\IbðRa;j � RaÞðRb;j Rb� Þ ffiffiffiffiffiffiffiffiffiffiffiffiffiffiffiffiffiffiffiffiffiffiffiffiffiffiffiffiffiffiffiffiffiffiffiffiffiffiffi Sj2IaðRa;j Ra� Þ2 q ffiffiffiffiffiffiffiffiffiffiffiffiffiffiffiffiffiffiffiffiffiffiffiffiffiffiffiffiffiffiffiffiffiffiffiffiffiffi Sj2IbðRb;j Rb� Þ2 q ð1Þ
wherejis the set of common rated items between useraandb.Ra,jis the rating of userafor an itemjandR�ais the average rating of usera.
CPCC [43]
Sim CPCC að ;bÞ ¼ ffiffiffiffiffiffiffiffiffiffiffiffiffiffiffiffiffiffiffiffiffiffiffiffiffiffiffiffiffiffiffiffiffiffiffiffiffiSj2Ia\IbðRa;j RmedÞðRb;j RmedÞ
Sj2IaðRa;j RmedÞ2
q ffiffiffiffiffiffiffiffiffiffiffiffiffiffiffiffiffiffiffiffiffiffiffiffiffiffiffiffiffiffiffiffiffiffiffiffiffi
Sj2IbðRb;j RmedÞ2
q ð2Þ
wherejis the set of common rated items between useraandb.Ra,jis the rating of userafor an itemjandRmedis the median rating on the rating scale.
WPCC[33] Sim WPCC að ;bÞ ¼ Sim PCCða;bÞ: jjj H;jjj �H Sim PCCða;bÞ;Otherwise ð3Þ 8 < :
whereHis an experimental value and is set to 50 in[33].
SPCC [42]
Sim SPCC að ;bÞ ¼Sim PCC að ;bÞ: 1
1þexpð j2jjÞ ð4Þ
PIP [20] Sim PIPða;bÞ ¼X
j2Ia\IbPIPðRa;j;Rb;jÞ ð5Þ wherePIPsimilarity measure basically consists of three factors, proximity, impact, and popularity.
NHSM[33] Sim PSSða;bÞ ¼X
j2Ia\IbPSSðRa;j;Rb;jÞ ð6Þ wherePSSbasically consists of three factors, proximity, significance, and singularity. These three factors are then combined with modified Jaccard similarity and URP.
where the variables involved in Eq (11) are the same as used inTable 1for standard PCC. The final similarity is named as improved PCC weighted withRPB(a,b)and denoted byIPWR(a,b)is mathematically represented using Eq (12). The IPWR similarity measure considers both
RPB(a,b)andSim_IPCC(a,b)by combining both factors using an adaptive weighting scheme. Two weightsαandβare chosen,αis applied toRPB(a,b)andβis applied toSim_IPCC(a,b). This also ensures that IPWR similarity measure method considers the user rating behavior and it also normalizes high rating effect as well as the low rating effect of each user.
IPWRða;bÞwith variance¼a:RPBða;bÞusing varþb:Sim IPCCða;bÞ ð12Þ
IPWRða;bÞwith SD¼a:RPBða;bÞusing SDþb:Sim IPCCða;bÞ ð13Þ
The weights ofαandβare determined in a separate subsequent section entitled as “Deter-mining best weights forαandβ”. The range of values forIPWR(a,b)are from -1 to +1 and thus a similarity thresholdθsis also required to be put on the similarity value generated by Eq (12) or Eq (13). The reason for adding bothRPB(a,b)andSim_IPCC(a,b)is that similarity range of Sim_IPCC(a,b)is from -1 to +1, whileRPB(a,b)similarity range is also from -1 to +1. Now if two users have a slightly negativeSim_IPCC(a,b)similarity but a high positive value forRPB(a,b) then the overall similarity value for Eq (12) will become greater than zero implying a positive similarity between these two users. However, ifRPB(a,b)is not used in conjunction with Sim_IPCC(a,b)then both users are treated as a dis-similar user bySim_IPCC(a,b). Similarly, if two users have a slightly positiveSim_IPCC(a,b)similarity while a high negative value for RPB(a,b)then overall similarityIPWR(a,b)consider these two users as dis-similar users.
The final recommendations are generated using Eq (14), which is known as Resnick’s for-mula [44] and either Eq (12) or Eq (13) can be used byIPWR(a,b)similarity measure method and defined mathematically as follows:
^
Ra;i ¼R�aþ
Sb2NNIPWRða;bÞ:ðRb;i R�bÞ
Sb2NNjIPWRða;bÞj
ð14Þ
wherepdenotes a user belonging to nearest neighbor (NN) network of the usera. The top sim-ilar users ofaare identified as nearest neighbors of the usera.
The pseudo code for the IPWR similarity measure method is outlined below and entitled as “Algorithm 1”. The experimental results of the IPWR similarity measure method are reported using five-fold cross validation[45] on each of the publically available dataset. The Pearson similarity is computed using Eq (11) and RPB is computed using either Eq (9) or Eq (10). The results of step 4 and step 5 are combined using Eq (12). Final prediction is generated using Eq (14).
___________________________________________________________________________ ________
Algorithm 1: Procedure of recommendation by the IPWR similarity mea-sure method
Input: Rated dataset Output: Predicted rating R^
___________________________________________________________________________ ________
1. Perform five-fold cross validation on ratings dataset to obtain test and training set.
2. Select target user a and test item i0 from the test set.
4. Find improved Pearson similarity Sim_IPCC(a,b) between a and b
using Eq (11).
5. Find rating preference behavior RPB(a,b) of a and b using either
Eq (9) or Eq (10).
6. Combine results from steps 4 and 5 using either Eqs (12) or (13).
7. Make prediction ^R on target item i0 of target user a using Eq
(14).
8. Return R^.
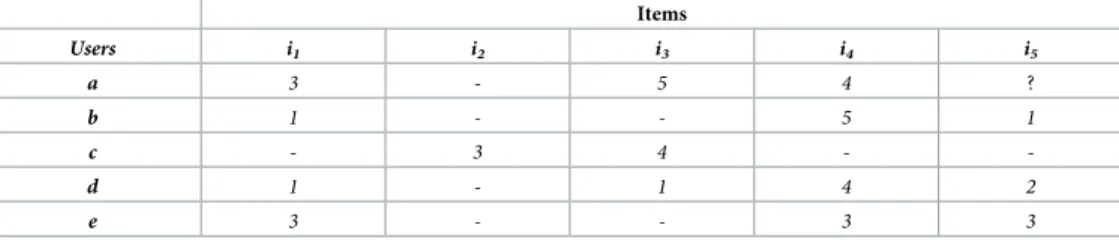
___________________________________________________________________________ Consider an example, which demonstrates the working of the IPWR similarity measure method. In this example,Table 2is showing an instance of a user-item based rating matrix. In the current situation, the rating matrix consist of five users and five items. The five users are denoted byatoe, while five items are denoted byi1toi5. In this example, we want to predict a rating of an itemi5for the usera. The distinct feature of this user-item based rating matrix is that usererating vector is flat which corresponds to shortcoming 1 of standard PCC as men-tioned earlier in the subsection entitled as “Shortcomings of standard PCC”. For this reason, although useraand usereconsist of exactly the same value of co-rated items, PCC is NaN. Useraand usercconsist of single co-rated item (i.e.i3only), which corresponds to the short-coming 2 of the standard PCC.
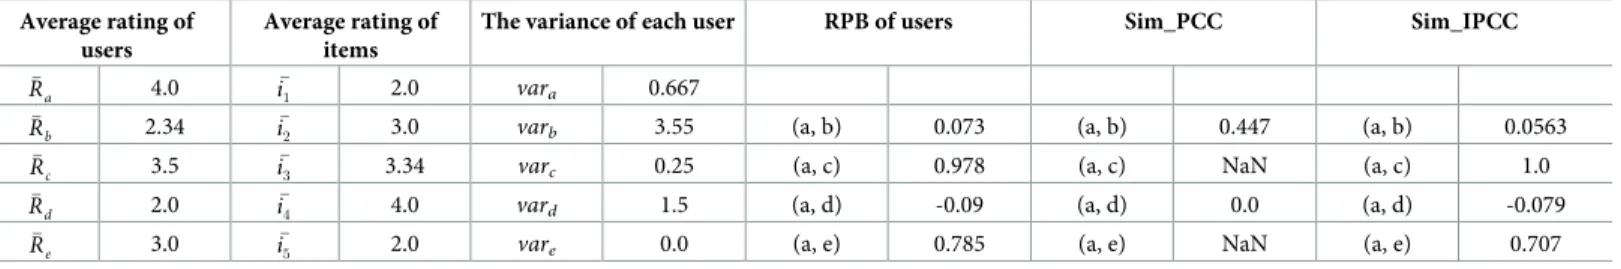
Table 3contain various parameters, which are computed fromTable 2. The variance of each user is computed using Eq (7),RPBof users is computed using Eq (9),Sim_PCCvalue is computed using Eq (1), andSim_IPCCvalue is computed using Eq (11).
IPWR(a,b)= 0.5�0.073+0.5�0.0563 = 0.0646 IPWR(a,c)= 0.5�0.978+0.5�1.0 = 0.744 IPWR(a,d)= 0.5�(-0.09) +0.5�(-0.079) = -0.084 IPWR(a,e)= 0.5�(0.785) +0.5�(0.707) = 0.372
FromTable 3, it can be noted thatSim_PCC(a,c)andSim_PCC(a,e)values areNaN, but at the same time values ofSim_IPCCandIPWRare real numbers that effectively abolishing short-comings 1 and 2 of the standard PCC. The value ofSim_PCCa,d= 0.0, which is very interesting. The usersb,d, anderated target itemi5. By applying the similarity thresholdθs, a set of nearest neighbors (NN) for the useraare identified andNN= {b,e}. The value of userbrating for an itemi5is 1.0 and the value of usererating for an itemi5is 3.0.
^ Ra;i5¼ 0:0646� ð1:0 2:34Þ þ0:372� ð3:0 3:0Þ 0:0646þ0:372 ¼4:0þ 0:085 0:436 ¼4:0 0:194¼3:8
Table 2. An example of a user-item based rating matrix.
Items Users i1 i2 i3 i4 i5 a 3 - 5 4 ? b 1 - - 5 1 c - 3 4 - -d 1 - 1 4 2 e 3 - - 3 3 https://doi.org/10.1371/journal.pone.0220129.t002
Experimental setup and performance evaluation metrics
Datasets
The standard datasets (namely Epinions [46], MovieLens-100K (ML-100K) [47], MovieLens-1M (ML-MovieLens-1M)[48], CiaoDVD[49], and MovieTweetings [50]) are used for the performance evaluation of the IPWR similarity measure method. The details about these datasets are as follows:
a) Epinions dataset:The Epinions is an online community website that allows users to review different products and services. Users can also rate the other user’s review on a numeri-cal snumeri-cale. This dataset contains 664823 ratings on the snumeri-cale of 1.0 (worst rating) to 5.0 (best rat-ing) with the step size of 1.0. This dataset contains 139738 items that are rated by 40163 users with 99.90% sparsity. The value of mean rating per user is 10.39 with a maximum of 1023 rat-ings per user. The value of mean rating per item is 4.75 with a maximum of 2026 ratrat-ings per item.
The sparsity is calculated as follows:
Sparsity¼ 1 non zero entries
all possible entries
� �
X100 ð15Þ
b) MovieLens-100K (ML-100K) dataset:The ML-100K dataset contains 943 users that rated different movies on a scale of 1.0 (worst rating) to 5.0 (best rating). The most rated value of this dataset is 4.0. This dataset includes 100000 user ratings over 1682 movies and each user rated at least 20 movies. This dataset is used by different state-of-the-art similarity measure methods for recommender system and its sparsity is 93.70%.
c) MovieLens-1M (ML-1M) dataset:The group lens research group collected and made publically available this dataset from the MovieLens website. On this web site, users can rate and review different movies. This dataset contains 6040 users, 3952 movies, and 1000209 user ratings. The ratings take values from 1.0 (worst rating) to 5.0 (best rating) with the step size of Table 3. Computed values of different statistics fromTable 2.
Average rating of users
Average rating of items
The variance of each user RPB of users Sim_PCC Sim_IPCC
�
Ra 4.0 i�1 2.0 vara 0.667
�
Rb 2.34 i�2 3.0 varb 3.55 (a, b) 0.073 (a, b) 0.447 (a, b) 0.0563
�
Rc 3.5 i�
3 3.34 varc 0.25 (a, c) 0.978 (a, c) NaN (a, c) 1.0
�
Rd 2.0 i�4 4.0 vard 1.5 (a, d) -0.09 (a, d) 0.0 (a, d) -0.079
�
Re 3.0 i�
5 2.0 vare 0.0 (a, e) 0.785 (a, e) NaN (a, e) 0.707
https://doi.org/10.1371/journal.pone.0220129.t003
Table 4. Rating distributions of the reported datasets.
Rating scale Ratings of users for each dataset
ML-1M dataset CiaoDVD dataset Epinions dataset ML-100K dataset
1.0 56174 2651 43228 6110 2.0 107557 4685 50678 11370 3.0 261197 10074 75525 27145 4.0 348971 22560 194339 34174 5.0 226310 32695 301053 21201 Total 1000209 72665 664823 100000 https://doi.org/10.1371/journal.pone.0220129.t004
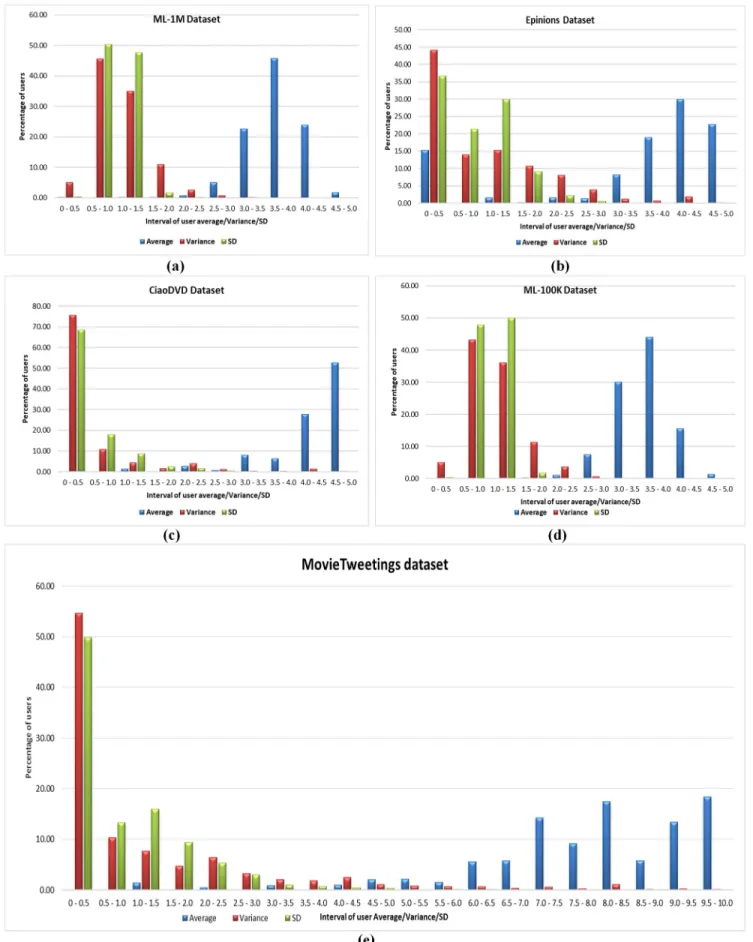
Fig 1. (a-e) Percentage of user average/variance/SD ratings for the reported datasets.
1.0. The sparsity of this dataset is 95.80%. The value of mean rating per user is 15.63 with a maximum of 2314 ratings per user and value of mean rating per item is 269.80 with a maxi-mum of 3428 ratings per user.
d)CiaoDVD dataset:The CiaoDVD dataset contains 72665 user ratings on the scale of 1.0 (worst rating) to 5.0 (best rating) with a step size of 1.0. This dataset contains 16121 items rated by 17615 users with 99.90% sparsity. The value of mean rating per user is 1.13 with a maximum of 1106 ratings per user. The value of mean rating per item is 4.48 with a maximum of 424 ratings per item.
The rating distribution for all four datasets is shown inTable 4. In the IPWR similarity measure method, RPB function comprises of user average rating and variance or SD, so the IPWR similarity measure method considers statistics of user average ratings, variance, and SD in intervals of 0.5. These statistics are shown in (Fig 1A–1E). It can be observed that maximum value of the variance/SD ratings occurs in the interval of 0.5–1.0 and a maximum value of aver-age ratings of the users occur in the interval of 3.5–4.0 for the ML-1M dataset. For the Epinions dataset, the variance/SD ratings of a maximum number of users occur in the interval 0–0.5 while the maximum value of average ratings of the users occurs in the interval of 4.0–4.5. For CiaoDVD dataset, the variance/SD ratings of a maximum number of users also occur in the interval of 0–0.5 and maximum average ratings of the users occur in the interval of 4.5–5.0. Similarly, for ML-100K dataset, the variance/SD ratings of a maximum number of users occur in the intervals of 0.5–1.0/1.0–1.5, while the maximum value of average ratings of the users occurs in the interval of 3.5–4.0. According to the details shown inFig 1(E)for the MovieT-weetings dataset, it can be noted that the variance/SD of more than 50% of users occurs in the interval of 0–0.5. Furthermore, maximum intervals for user average values are found to be 8.0–8.5 and 9.5–10.0. Keeping these facts into view, the RPB function of Eq (9) and Eq (10) give better performance for the Epinions, CiaoDVD, and MovieTweetings datasets as com-pared to the ML-1M and ML-100K datasets. Its reason is that variance/SD ratings of a maxi-mum number of users occur in the interval of 0–0.5. It is also obvious from the results of (Fig 1A–1E) that user averages and variances/SD ratings are not well distributed. The variance/SD occur in the interval of initial scale to median scale, while maximum average ratings of the users occur in the opposite side (i.e. median scale to maximum scale). This is the main reason behind the modeling of RPB function in terms of user average rating and variance/SD value.
Performance evaluation metrics
The performance of the IPWR similarity measure method is evaluated using five-fold cross-validation due to its extensive usage in state-of-the-art similarity measure methods for recom-mender system and average results are reported. An alternate choice to five-fold cross-valida-tion is Leave-one-out method which requires high computacross-valida-tional complexity as compared to five-fold cross-validation method[45]. The performance of the IPWR similarity measure method is measured in terms of MAE, RMSE, precision, recall, and F-measure. The MAE cal-culates the average absolute deviation among the predicted ratings given by the recommender system and true ratings given by the user. The RMSE takes an average of squared error result by giving more weight to higher value errors and less weight to smaller value errors. The math-ematical representation of the MAE and RMSE are as follows:
MAE¼ 1 N PN i¼1jRa;i ^Ra;ij ð16Þ RMSE¼ ffiffiffiffiffiffiffiffiffiffiffiffiffiffiffiffiffiffiffiffiffiffiffiffiffiffiffiffiffiffiffiffiffiffi 1 N PN i¼1jRa;i R^a;i r j2 ð17Þ
whereNdenotes the total number of items for which the prediction process is performed. The main goal of any recommender system is to decrease the MAE and RMSE.
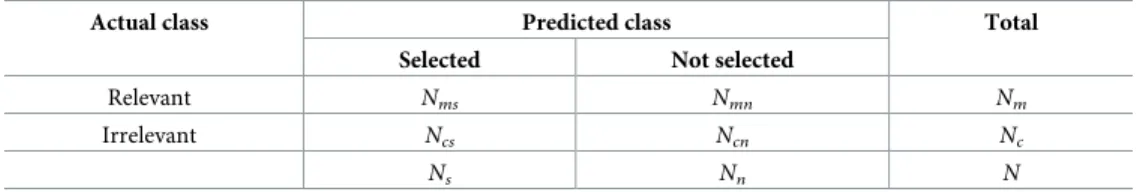
The precision and recall assess the specificity and sensitivity of a recommender system by measuring the frequency of items, respectively. The most suitable way to measure the precision and recall is to predict the topNitems for known ratings. All the experimental results of the IPWR similarity measure method are reported by settingN= 5. The fundamental supposition is the division among relevant and irrelevant items in every user’s dataset. Precision and recall are empirically defined inTable 5and are mathematically expressed in Eq (18) and Eq (19) as follows: Precision¼Nms Ns �100% ð18Þ Recall¼Nms Nm �100% ð19Þ
However, a tradeoff exists for precision and recall in the sense that if one value increases then other value decreases and vice versa. To overcome this tradeoff, the state-of-the-art simi-larity measure methods for recommender system also uses F-measure as a performance evalu-ation metric, which is mathematically defined using Eq (20) as follows:
F measure¼2�Precision�Recall
PrecisionþRecall ð20Þ
Experimental results and discussions
Three different cases are used to measure the performance of the IPWR similarity measure method. In the first case, the impact of the varying similarity threshold (denoted byθs) on the performance of the IPWR similarity measure method is analyzed. In the second case, the best weights ofαandβare determined for each dataset using an adaptive weighting scheme. In the third case, the impact on the performance of the IPWR similarity measure method is analyzed by varying neighbor’s size and its performance comparisons are performed with state-of-the-art similarity measure methods. The experimental details about these three cases are given in the following subsections.
Methods used for comparison
The performance of the IPWR similarity measure method is compared with state-of-the-art similarity measure methods. These similarity measure methods include PCC, CPCC, WPCC, SPCC, Cosine, PIP, Singularity measure. and NHSM. The detail about these state-of-the-art similarity measure methods is as follows:
a) PCC similarity measure. The value of PCC similarity measure method is calculated using Eq (1). The range of PCC value is from -1 to +1. The -1 corresponds to the worst Table 5.Confusion matrix:Each row represents an actual class and each column represents predicted class.
Actual class Predicted class Total
Selected Not selected
Relevant Nms Nmn Nm
Irrelevant Ncs Ncn Nc
Ns Nn N
similarity value and +1 corresponds to the best similarity value. For all similarity measure methods, a similarity threshold is also required to be imposed on produced similarity values. The value of the similarity threshold (denoted byθs) for PCC similarity measure is greater than zero. This implies that users having negative similarity are ignored.
b) CPCC similarity measure. This similarity measure method is calculated using Eq (2). The CPCC similarity measure categorizes all rating values as positive or negative. A rating value is positive if it is above the median rating of the rating scale and negative if it is below the median rating of the rating scale. For all reported datasets, the value of the median rating is set to 3. Like PCC, CPCC result range is also from -1 to +1 and the similarity threshold (θs) is also set to greater than zero.
c) WPCC similarity measure. This similarity measure method is calculated using Eq (3). This method gives more weight to users whose number of common rated items are greater than some threshold and its value is set to 50 [20]. The range of values for the WPCC similarity measure method is from -1 to +1.
d) SPCC similarity measure. This is an exponential version of the standard PCC similar-ity measure method and it is calculated using Eq (4). Its possible values are from -1 to +1 and the similarity threshold (θs) is set to greater than zero.
e) COSINE similarity measure. This similarity measure method is introduced by [12]. Its possible values are from 0 to 1, which indicate that all users with similarity greater than zero are selected for the prediction process.
f) PIP similarity measure. This similarity measure method first computes a Boolean function followed by an agreement between two user ratings. After that, it calculates PIP fac-tors based on whether the agreement is true or false. The value of the PIP similarity measure method is greater than zero and it can be any real number. The value of the PIP similarity mea-sure method is calculated using Eq (5).
g) Singularity measure. In this similarity measure, the user ratings are grouped as positive and negative, and the singularity value of user and item is computed. The prediction is gener-ated based upon computed singularity value.
h) NHSM similarity measure. This similarity measure method is calculated using Eq (6). This method considers both local and global preference of a user rating. Its value range is from 0 to 1.
Effect of the similarity threshold
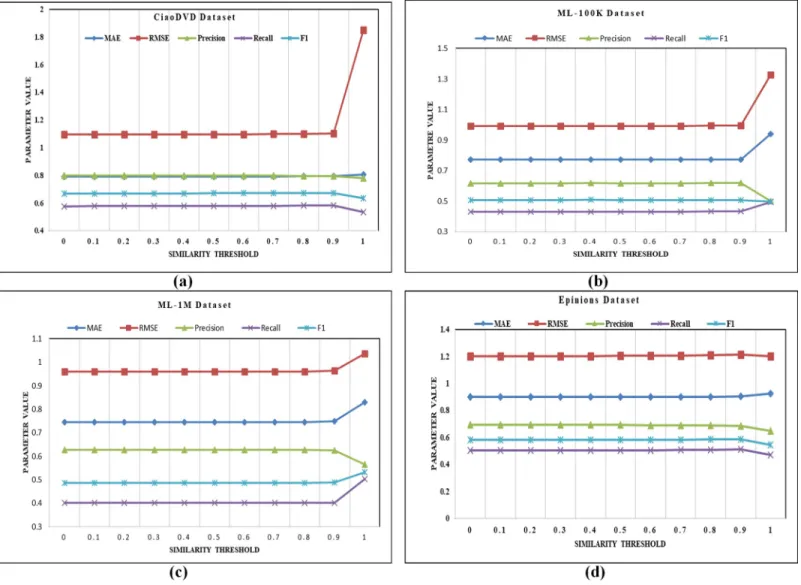
To estimate the impact of the similarity threshold (θs), its values are varied from 0 to 1.0 with a step size of 0.1 at a fixed nearest neighbor size of 5. It is obvious fromFig 2(A)of the CiaoDVD dataset that no significant change is observed untilθs= 0.9. The worst results for RMSE are produced whenθs= 1.0 and suddenly jumps from 1.102 to 1.85 when corresponding MAE results remain unchanged. The precision value decreases from 0.794 to 0.779. Similarly, the value of recall atθs= 1.0 decreases to 0.533 from 0.582. The value of F-measure reaches to 0.634 from 0.672. Similarly, inFig 2(B)of the ML-100K dataset, results of all evaluation param-eters remain almost the same tillθs= 0.9. Atθs= 1.0, MAE value increases from 0.773 to 0.939, RMSE value increases from 0.995 to 1.326. The value of precision atθs= 1.0 decreases from 0.619 to 0.499, recall increases from 0.432 to 0.495, and value of F-measure decreases from 0.507 to 0.497. InFig 2(C)of the ML-1M dataset, similar behavior of ML-100K dataset is observed. Afterθs= 0.9, MAE, and RMSE values are increases, while the value of the precision, recall, and F-measure is decreasing. InFig 2(D)of the Epinions dataset, MAE values remain almost constant tillθs= 0.7 and after that, it starts increasing. For RMSE, performance remains almost constant tillθs= 0.7, and atθs= 0.8 andθs= 0.9 its increases, while at threshold = 1.0,
performance decreases to 1.199. Which means that values of the precision, recall, and F-mea-sure are also decreasing due to an increase in the threshold value. After observing these experi-mental details of the reported datasets, it can be concluded that values of the MAE and RMSE increases with increase in the value of the similarity threshold (θs) while values of the precision, recall, and F-measure are decreases.
Determining best weights for
α
and
β
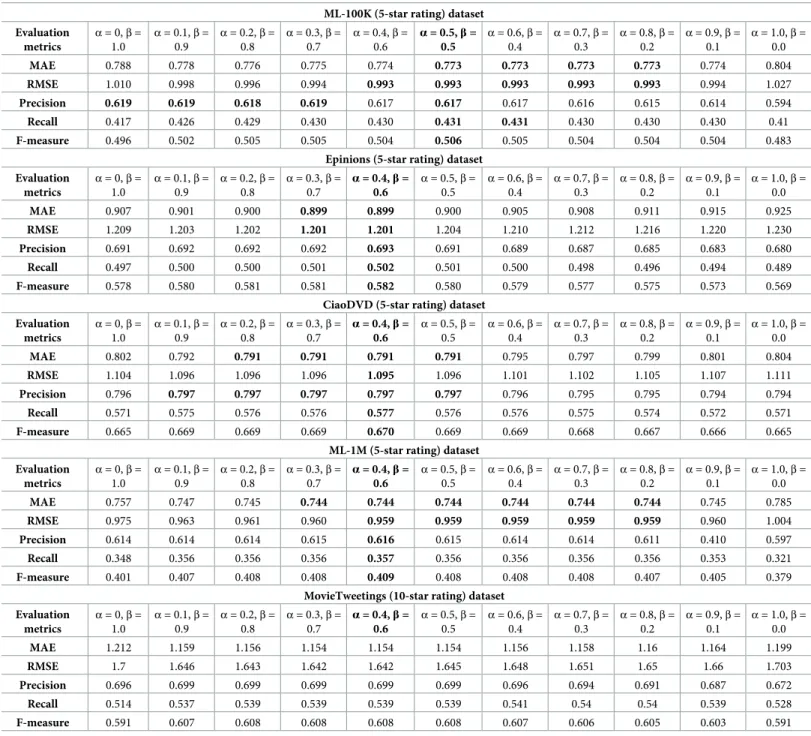
In order to determine the best weights ofαandβto achieve improved performance of the IPWR similarity measure method as compared with state-of-the-art similarity measure meth-ods, its performance is evaluated by varying different weights ofαandβfrom 0 to 1. The experimental details about the performance of the IPWR similarity measure method on differ-ent weights ofαandβare given inTable 6for all the reported datasets. InTable 6, the bold val-ues indicate the best weights ofαandβwhich gives the best performance of the IPWR
similarity measure method in terms of the performance evaluation metrics for all the reported datasets. For ML-100K dataset, the best results are found whenα=0.5 andβ=0.5. Similarly, Fig 2. (a-d) Effect of similarity threshold on reported datasets.
by settingα= 0.1 andβ= 0.9, better results are gathered as compared to the case, whenα= 0 andβ=1.0. This implies that RPB produces an important effect on the recommendation per-formance of the IPWR similarity measure method. For Epinions, CiaoDVD, and ML-1M data-sets, the best performance of the IPWR similarity measure method is obtained by setting weights ofα=0.4 andβ=0.6. In these datasets, it is also obvious that performance is improved when weights ofαandβare increased from0.0, 1.0 to 0.1, and 0.9. Furthermore, the worst per-formance is obtained, whenα=1.0 andβ=0.0, which indicates that RPB alone is not able to Table 6. Estimating the best weights ofαandβfor reported datasets (bold values in each row indicate the best performance, while bold values ofαandβindicate best weights selected on the bases of lowest MAE and highest F-measure values).
ML-100K (5-star rating) dataset Evaluation metrics α= 0,β= 1.0 α= 0.1,β= 0.9 α= 0.2,β= 0.8 α= 0.3,β= 0.7 α= 0.4,β= 0.6 α= 0.5,β= 0.5 α= 0.6,β= 0.4 α= 0.7,β= 0.3 α= 0.8,β= 0.2 α= 0.9,β= 0.1 α= 1.0,β= 0.0 MAE 0.788 0.778 0.776 0.775 0.774 0.773 0.773 0.773 0.773 0.774 0.804 RMSE 1.010 0.998 0.996 0.994 0.993 0.993 0.993 0.993 0.993 0.994 1.027 Precision 0.619 0.619 0.618 0.619 0.617 0.617 0.617 0.616 0.615 0.614 0.594 Recall 0.417 0.426 0.429 0.430 0.430 0.431 0.431 0.430 0.430 0.430 0.41 F-measure 0.496 0.502 0.505 0.505 0.504 0.506 0.505 0.504 0.504 0.504 0.483
Epinions (5-star rating) dataset Evaluation metrics α= 0,β= 1.0 α= 0.1,β= 0.9 α= 0.2,β= 0.8 α= 0.3,β= 0.7 α= 0.4,β= 0.6 α= 0.5,β= 0.5 α= 0.6,β= 0.4 α= 0.7,β= 0.3 α= 0.8,β= 0.2 α= 0.9,β= 0.1 α= 1.0,β= 0.0 MAE 0.907 0.901 0.900 0.899 0.899 0.900 0.905 0.908 0.911 0.915 0.925 RMSE 1.209 1.203 1.202 1.201 1.201 1.204 1.210 1.212 1.216 1.220 1.230 Precision 0.691 0.692 0.692 0.692 0.693 0.691 0.689 0.687 0.685 0.683 0.680 Recall 0.497 0.500 0.500 0.501 0.502 0.501 0.500 0.498 0.496 0.494 0.489 F-measure 0.578 0.580 0.581 0.581 0.582 0.580 0.579 0.577 0.575 0.573 0.569
CiaoDVD (5-star rating) dataset Evaluation metrics α= 0,β= 1.0 α= 0.1,β= 0.9 α= 0.2,β= 0.8 α= 0.3,β= 0.7 α= 0.4,β= 0.6 α= 0.5,β= 0.5 α= 0.6,β= 0.4 α= 0.7,β= 0.3 α= 0.8,β= 0.2 α= 0.9,β= 0.1 α= 1.0,β= 0.0 MAE 0.802 0.792 0.791 0.791 0.791 0.791 0.795 0.797 0.799 0.801 0.804 RMSE 1.104 1.096 1.096 1.096 1.095 1.096 1.101 1.102 1.105 1.107 1.111 Precision 0.796 0.797 0.797 0.797 0.797 0.797 0.796 0.795 0.795 0.794 0.794 Recall 0.571 0.575 0.576 0.576 0.577 0.576 0.576 0.575 0.574 0.572 0.571 F-measure 0.665 0.669 0.669 0.669 0.670 0.669 0.669 0.668 0.667 0.666 0.665
ML-1M (5-star rating) dataset Evaluation metrics α= 0,β= 1.0 α= 0.1,β= 0.9 α= 0.2,β= 0.8 α= 0.3,β= 0.7 α= 0.4,β= 0.6 α= 0.5,β= 0.5 α= 0.6,β= 0.4 α= 0.7,β= 0.3 α= 0.8,β= 0.2 α= 0.9,β= 0.1 α= 1.0,β= 0.0 MAE 0.757 0.747 0.745 0.744 0.744 0.744 0.744 0.744 0.744 0.745 0.785 RMSE 0.975 0.963 0.961 0.960 0.959 0.959 0.959 0.959 0.959 0.960 1.004 Precision 0.614 0.614 0.614 0.615 0.616 0.615 0.614 0.614 0.611 0.410 0.597 Recall 0.348 0.356 0.356 0.356 0.357 0.356 0.356 0.356 0.356 0.353 0.321 F-measure 0.401 0.407 0.408 0.408 0.409 0.408 0.408 0.408 0.407 0.405 0.379
MovieTweetings (10-star rating) dataset Evaluation metrics α= 0,β= 1.0 α= 0.1,β= 0.9 α= 0.2,β= 0.8 α= 0.3,β= 0.7 α= 0.4,β= 0.6 α= 0.5,β= 0.5 α= 0.6,β= 0.4 α= 0.7,β= 0.3 α= 0.8,β= 0.2 α= 0.9,β= 0.1 α= 1.0,β= 0.0 MAE 1.212 1.159 1.156 1.154 1.154 1.154 1.156 1.158 1.16 1.164 1.199 RMSE 1.7 1.646 1.643 1.642 1.642 1.645 1.648 1.651 1.65 1.66 1.703 Precision 0.696 0.699 0.699 0.699 0.699 0.699 0.696 0.694 0.691 0.687 0.672 Recall 0.514 0.537 0.539 0.539 0.539 0.539 0.541 0.54 0.54 0.539 0.528 F-measure 0.591 0.607 0.608 0.608 0.608 0.608 0.607 0.606 0.605 0.603 0.591 https://doi.org/10.1371/journal.pone.0220129.t006
yield good results. In the case of the MovieTweetings (10-star rating) dataset, the best perfor-mance of the IPWR similarity measure method is achieved by setting the weight ofα=0.4 and
β=0.6.
Effect of the number of neighbors and comparison of state-of-the-art
similarity measure methods with IPWR similarity measure method
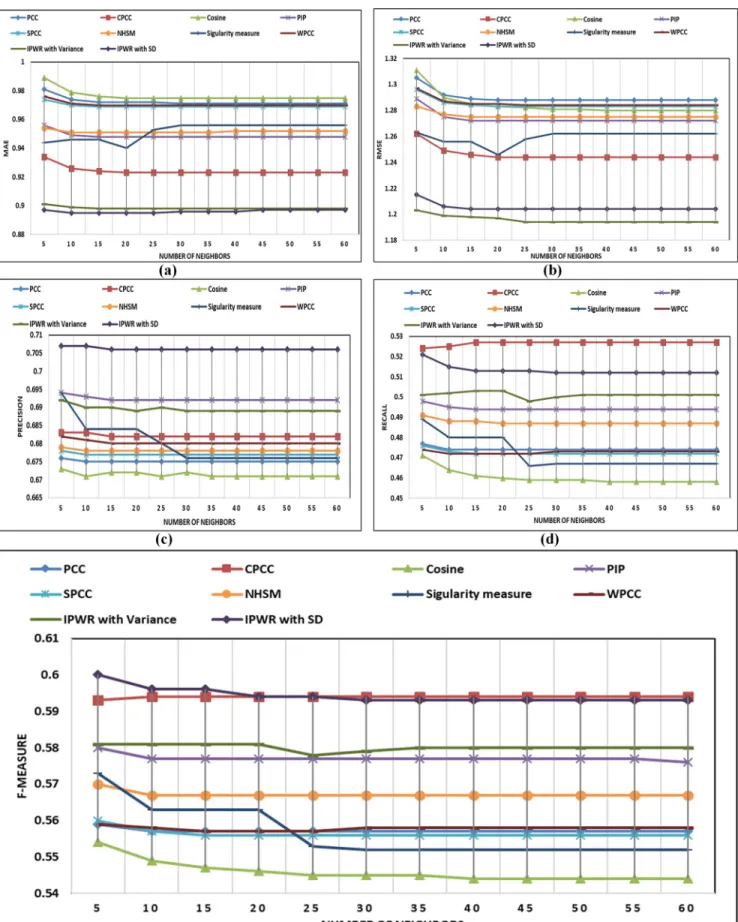
In this section, details about performance comparison of the IPWR similarity measure method with state-of-the-art similarity measure methods (i.e. Standard PCC, CPCC, WPCC, SPCC, COSINE, PIP, Singularity measure, and NHSM) is carried. The performance of the IPWR sim-ilarity measure method and its competitor methods are analyzed in terms of the performance evaluation metrics (i.e. MAE, RMSE, Precision, Recall, and F-measure) by varying a different number of neighbors whose details are shown in (Fig 3A–3E) to (Fig 7A–7E).
Performance analysis on the Epinions (5-star rating) dataset. The performance analysis of the IPWR similarity measure method with its competitor methods is presented in (Fig 3A– 3E) for the Epinions dataset. (Fig 3A–3E) present performance analysis of the IPWR similarity measure method with its competitor methods in terms of the performance evaluation metrics (i.e. MAE, RMSE, Precision, Recall, and F-measure) versus the different number of neighbors. The performance analysis indicates that IPWR similarity measure method outperforms as compared to its competitor similarity measure methods in terms of the performance evalua-tion metrics. In order to verify the results of the IPWR similarity measure method among its competitor methods, statistical analysis is performed on the experimental results of the reported datasets using non-parametric Wilcoxon matched-pairs signed-rank test and paired t-test whose details are presented in Tables7–10. The statistical analysis is performed by setting a standard value of the level of significance at 0.05 (95%) and results are analyzed in terms of thez-score,p-value, andt-score. For all the reported datasets, the value ofpis less than the value of the significance level (i.e.α�0.05), which proof the robust performance of the IPWR similarity measure method as compared to its competitor similarity measure methods. Thep -value also indicate that the performance of the IPWR similarity measure method is strongly significant. It means that there is significant differences exist between IPWR similarity mea-sure method and its competitor similarity meamea-sure methods. The negative sign ofz-score also indicates the robustness of the IPWR similarity measure method as compared to its competitor similarity measure methods. Moreover, we have applied paired t-test to reassess the statistical significance of the experimental results of the IPWR similarity measure method and its com-petitor similarity measure methods. The value of the degrees of freedom (df) for the paired t-test is set to 11. The negative sign oft-score also indicates that the IPWR similarity measure method gives the best performance as compared to its competitor similarity measure methods. Furthermore, all the results of t-score are highly significant which shows that there is signifi-cant difference exist between IPWR similarity measure method and its competitor similarity measure methods.
Performance analysis on the MovieLens-100K (ML-100K) (5-star rating) dataset. The performance comparisons in terms of the performance evaluation metrics (i.e. MAE, RMSE, Precision, Recall, and F-measure) of the IPWR similarity measure method with its competitor similarity measure methods is presented in (Fig 4A–4E) for the ML-100K dataset. After analyz-ing the experimental details of (Fig 4A–4E), it can be concluded that IPWR similarity measure method outperforms as compared to its competitor similarity measure methods. Furthermore, performance analysis of the IPWR similarity measure method in terms of accuracy is also bet-ter than its competitor similarity measure methods because it considers the average rating of an item and an average rating of a user simultaneously. Similarly, the RPB of a user is ignored
Fig 3. (a-e) Performance comparison of state-of-the-art similarity measure methods with the IPWR similarity measure method in terms of MAE, RMSE, precision, recall, and F-measure on the Epinions dataset.
Table 7. Statistical significance of the experimental results of the IPWR similarity measure method based on the MAE with state-of-the-art similarity measure methods on the Epinions dataset (�indicate the best performance).
Evaluation metrics
PCC CPCC Cosine PIP SPCC WPCC NHSM Singularity
measure IPWR with variance IPWR with SD� Mean error 0.972 0.924 0.977 0.949 0.970 0.971 0.952 0.952 0.898 0.896 Std. error 0.0008288 0.000922 0.0011772 0.000664 0.000417 0.0004994 0.000256 0.0017238 0.0002562 0.000259 Confidence interval 0.9705092 -0.9741575 0.922220 -0.926279 0.9739924 -0.9791743 0.947287 -0.950212 0.968581– 0.970418 0.9694842 -0.9716824 0.951102 -0.952230 0.9479559 -0.9555441 0.8977694 -0.8988973 0.895511 -0.896655 Statistical significance using non-parametric Wilcoxon matched-pairs signed-rank test
z-score -3.081 -3.077 -3.077 -3.081 -3.081 -3.081 -3.126 -3.077 -3.082 NA
p-value 0.0021 0.0021 0.0021 0.0021 0.0021 0.0021 0.0018 0.0021 0.0021 NA
Statistical significance using paired t-test (df-indicate degrees of freedom)
Df 11 11 11 11 11 11 11 11 11 11
t-score -87.7877 -29.3989 -66.7761 -73.8322 -1.5e+02 -1.3e+02 -1.5e+02 -31.9315 -6.1648 NA
p-value 0.0000 0.0000 0.0000 0.0000 0.0000 0.0000 0.0000 0.0000 0.0000 NA
https://doi.org/10.1371/journal.pone.0220129.t007
Table 8. Statistical significance of the experimental results of the IPWR similarity measure method based on the MAE with state-of-the-art similarity measure methods on the MovieLens-100K dataset (�indicate the best performance).
Evaluation metrics
PCC CPCC Cosine SPCC WPCC PIP NHSM Singularity
measure IPWR with variance� IPWR with SD Mean error 0.851 0.757 0.818 0.833 0.779 0.795 0.752 0.794 0.746 0.755 Std. error 0.010891 0.006580 0.0100396 0.0077409 0.004230 0.0060382 0.0018 0.0059817 0.0026327 0.003584 Confidence interval 0.826778– 0.874721 0.742350– 0.771316 0.7962364 -0.8404303 0.8157957 -0.849871 0.770104– 0.788728 0.7813767 -0.8079566 0.7478 -0.7561 0.7803344 -0.8066656 0.7397888 -0.7513779 0.747110 -0.762889 Statistical significance using non-parametric Wilcoxon matched-pairs signed-rank test
z-score -3.063 -1.806 -3.068 -3.063 -3.064 -3.063 -1.927 -3.063 NA -3.07
p-value 0.0022 0.0709 0.0022 0.0022 0.0022 0.0022 0.054 0.0022 NA 0.0021
Statistical significance using paired t-test (df-indicate degrees of freedom)
Df 11 11 11 11 11 11 11 11 11 11
t-score -9.3856 -1.5873 -7.0093 -10.6710 -6.7895 -7.4514 -1.9882 -7.3319 NA -2.1173
p-value 0.0000 0.1267 0.0000 0.0000 0.0000 0.0000 0.0594 0.0000 NA 0.0458
https://doi.org/10.1371/journal.pone.0220129.t008
Table 9. Statistical significance of the experimental results of the IPWR similarity measure method based on the MAE with state-of-the-art similarity measure methods on the MovieLens-1M dataset (�indicate the best performance).
Evaluation metrics PCC CPCC Cosine SPCC WPCC PIP NHSM Singularity measure IPWR with variance� IPWR with SD Mean error 0.823 0.727 0.786 0.825 0.768 0.814 0.712 0.733 0.716 0.721 Std. error 0.00813 0.00327 0.00233 0.00548 0.00187 0.00855 0.00125 0.00408 0.00271 0.00271 Confidence interval 0.8045976 -0.8404024 0.719540 -0.733959 0.7805382 -0.7907951 0.812763 -0.836903 0.763873 -0.772126 0.794925 -0.832575 0.70931 -0.71485 0.7236798 -0.741653 0.7104351 -0.7223982 0.715182 -0.727150 Statistical significance using non-parametric Wilcoxon matched-pairs signed-rank test
z-score -3.059 -3.066 -3.065 -3.061 -3.069 -3.061 1.532 -3.084 NA -3.078
p-value 0.0022 0.0022 0.0022 0.0022 0.0021 0.0022 0.1255 0.002 NA 0.0021
Statistical significance using paired t-test (df-indicate degrees of freedom)
df 11 11 11 11 11 11 11 11 11 11
t-score -12.3700 -2.4279 -19.3446 -17.7141 -15.6235 -10.8457 1.4470 -3.3131 NA -1.2357
p-value 0.0000 0.0238 0.0000 0.0000 0.0000 0.0000 0.1620 0.0032 NA 0.2296
by its competitor similarity measure methods, while IPWR similarity measure also considers user RPB, which result in improved performance.
Performance analysis on the MovieLens-1M (ML-1M) (5-star rating) dataset. (Fig 5A– 5E) present performance analysis of the IPWR similarity measure method with its competitor similarity measure methods by a varying number of neighbors and analyzing performance in terms of the MAE, RMSE, Precision, Recall and F-measure on the ML-1M dataset. It is a large dataset with a sparsity of 95.80%. For this dataset, the IPWR similarity measure method also performs better than its competitor similarity measure methods except for the NHSM similar-ity measure method. The reason for the better performance of the NHSM similarsimilar-ity measure method is its proximity, significance, and singularity (PSS) factors, which are calculated for each common rating individually. However, the results of the NHSM similarity measure method are very close to IPWR similarity measure method. In the case of RMSE, the perfor-mance of the IPWR similarity measure method is better as compared to the NHSM similarity measure method.
Performance analysis on the CiaoDVD (5-star rating) dataset. (Fig 6A–6E) present per-formance analysis for a different number of neighbors in terms of perper-formance evaluation metrics for the CiaoDVD dataset. In this dataset, mean ratings per user are 1.13 and mean rat-ings per item are 4.48. The IPWR similarity measure method also performs better on this data-set because of the consideration of the user RPB and improved PCC. It is also observed that the increase in the number of neighbors does not affect the performance of the IPWR similar-ity measure method. This implies that a small number of neighbors give the same results as a large number of neighbors, which also reduces the computational cost of the IPWR similarity measure method as compared to its competitor similarity measure methods.
Performance analysis on the MovieTweetings (10-star rating) dataset. The MovieT-weetings dataset is also publicly available dataset which is crawled from twitter. This dataset consists of movie ratings in the range of [1–10]. In this rating scale, 1 indicates the worst rating and 10 indicates the best rating of a movie given by a user. This dataset contains a total of 759746 user ratings given by 56304 users using a total of 32810 movies. The detail of the user rating scales and user rating distribution for the MovieTweetings dataset is presented in
Table 11. The sparsity of MovieTweetings dataset is 99.90%. The best performance of the IPWR similarity measure method is achieved by setting the weight ofα=0.4 andβ=0.6 whose experimental details are presented inTable 6for the MovieTweetings dataset. The Table 10. Statistical significance of the experimental results of the IPWR similarity measure method based on the MAE with state-of-the-art similarity measure methods on the CiaoDVD dataset (�indicate the best performance).
Evaluation metrics
PCC CPCC Cosine SPCC PIP WPCC NHSM Singularity
measure IPWR with variance IPWR with SD� Mean error 0.823 0.800 0.821 0.820 0.800 0.817 0.810 0.807 0.789 0.784 Std. error 0.0010 0.0015625 0.001798 0.000417 0.000499 0.0004994 0.000228 0.0003658 0.0002289 0.00025 Confidence interval 0.8204601 -0.8248732 0.796811 -0.803689 0.817458– 0.825374 0.818581– 0.820418 0.798484 -0.800682 0.8154842 -0.8176824 0.809412 -0.810420 0.8063615 -0.8079719 0.7884128 -0.7894205 0.7836998 -0.7848002 Statistical significance using non-parametric Wilcoxon matched-pairs signed-rank test
z-score -3.129 -3.129 -3.076 -3.274 -3.274 -3.274 -3.176 -3.09 -3.176 NA
p-value 0.0018 0.0018 0.0021 0.0011 0.0011 0.0011 0.0015 0.002 0.0015 NA
Statistical significance using paired t-test (df-indicate degrees of freedom)
df 11 11 11 11 11 11 11 11 11 11
t-score -49.6847 -10.1116 -20.4698 -72.4471 -27.4568 -57.8981 -75.7201 -51.7188 -13.7673 NA
p-value 0.0000 0.0000 0.0000 0.0000 0.0000 0.0000 0.0000 0.0000 0.0000 NA
performance comparisons in terms of the performance evaluation metrics (i.e. MAE, RMSE, Precision, Recall, and F-measure) of the IPWR similarity measure method with its competitor similarity measure methods is presented in (Fig 7A–7E) for the MovieTweetings dataset. After analyzing the experimental details of (Fig 7A–7E), it can be concluded that IPWR similarity measure method outperforms in terms of evaluation metrics (i.e. MAE, RMSE, and Precision) as compared to its competitor similarity measure methods because it considers the average rat-ing of an item and an average ratrat-ing of a user simultaneously. Similarly, the RPB of a user is ignored by its competitor similarity measure methods, while IPWR similarity measure method also considers user RPB, which result in improved performance.
The statistical details of the IPWR similarity measure and its competitor similarity measure methods for the MovieTweetings dataset are presented inTable 12. The statistical analysis is performed using a non-parametric Wilcoxon matched-pairs signed-rank test and paired t-test to investigate and provide statistical evidence regarding the robust performance of the IPWR similarity measure method as compared to its competitor similarity measure methods. The value of the degrees of freedom (df) for the pairedt-test is set to 11 for the MovieTweetings dataset. According to the statistical results presented inTable 12, the negative sign ofz-score andt-score shows that IPWR similarity measure method shows the best performance as com-pared to its competitor methods. Furthermore,z-score results of the IPWR similarity measure are highly significant in all cases as itsp-values are less than the level of significance at 0.05 (95%) however in case oft-score, all the results are significant except of NHSM and IPWR with SD similarity measure methods which give insignificant results due to least significant dif-ference exist between these two methods.
Conclusion and future work
In this article, we identify and analyze some limitations of the state-of-the-art similarity mea-sure methods, especially the PCC similarity meamea-sure method. These similarity meamea-sures are used by collaborative filtering based methods to find similar users’ and items’ profiles. User RPB is one of the most important aspects, which is ignored by traditional similarity measure-ment methods. Typically, different users have different RPB and based upon this behavior, they tend to rate items with values that have not many variations. In this article, we have pro-posed an improved similarity measure method that uses the user’s RPB pattern to find similar users. The RPB pattern is modeled as a function of user rating averages and user variance or standard deviation. The proposed IPWR similarity measure method overcomes some inherent shortcomings of a standard PCC similarity measure and it also considers the RPB pattern of users to achieve better performance. The extensive experiments are performed to check the effectiveness of the IPWR similarity measure method. The performance of the IPWR similarity measure method is compared against state-of-the-art similarity measure methods using four publically available datasets. The results show that the IPWR similarity measure performs bet-ter than conventional and state-of-the-art similarity measure methods like NHSM and PIP. It is also observed from experimental results that IPWR similarity measure method performs better on sparse datasets (i.e. Epinions, CiaoDVD, and MovieTweetings datasets) than dense datasets (i.e. ML-100K and ML-1M datasets). In future work, we intend to learn weights ofα andβusing various machine learning methods such as support vector machine (SVM), parti-cle swarm intelligence (PSO), and artificial neural networks (ANN). Although the IPWR simi-larity measure method considers both local and global information of user ratings in terms of Fig 4. (a-e) Performance comparison of state-of-the-art similarity measure methods with the IPWR similarity measure method in terms of MAE, RMSE, precision, recall, and F-measure on the ML-100K dataset.
Fig 5. (a-e) The performance comparison of state-of-the-art similarity measure methods with the IPWR similarity measure method in terms of MAE, RMSE, precision, recall, and F-measure on the ML-1M dataset.
Fig 6. (a-e) The performance comparison of state-of-the-art similarity measure methods with the IPWR similarity measure method in terms of MAE, RMSE, precision, recall, and F-measure on the CiaoDVD dataset.
Fig 7. (a-e) The performance comparison of state-of-the-art similarity measure methods with the IPWR similarity measure method in terms of MAE, RMSE, precision, recall, and F-measure on the MovieTweetings dataset.