Portland State University
Portland State University
PDXScholar
PDXScholar
Civil and Environmental Engineering Faculty
Publications and Presentations
Civil and Environmental Engineering
2020
Factors Affecting Injury Severity in Vehicle-
Factors Affecting Injury Severity in
Vehicle-Pedestrian Crashes: A Day-of-Week Analysis Using
Pedestrian Crashes: A Day-of-Week Analysis Using
Random Parameter Ordered Response Models and
Random Parameter Ordered Response Models and
Artificial Neural Networks
Artificial Neural Networks
Seyedmirsajad Mokhtarimousavi
Florida International University
Jason C. Anderson
Portland State University
Atorod Azizinamini
Florida International University
Mohammed Hadi
Florida International University
Follow this and additional works at:
https://pdxscholar.library.pdx.edu/cengin_fac
Part of the
Transportation Engineering Commons
Let us know how access to this document benefits you.
Citation Details
Citation Details
Mokhtarimousavi, S., Anderson, J. C., Azizinamini, A., & Hadi, M. (2020). Factors affecting injury severity in
vehicle-pedestrian crashes: A day-of-week analysis using random parameter ordered response models
and Artificial Neural Networks. International Journal of Transportation Science and Technology.
This Article is brought to you for free and open access. It has been accepted for inclusion in Civil and
Environmental Engineering Faculty Publications and Presentations by an authorized administrator of PDXScholar.
For more information, please contact
.
Factors affecting injury severity in vehicle-pedestrian crashes: A
day-of-week analysis using random parameter ordered
response models and Artificial Neural Networks
Seyedmirsajad Mokhtarimousavi
a,⇑, Jason C. Anderson
b, Atorod Azizinamini
c,
Mohammed Hadi
daDepartment of Civil and Environmental Engineering, Florida International University, Miami, FL 33174, United States bDepartment of Civil and Environmental Engineering, Portland State University, Portland, OR 97201, United States c
Accelerate Bridge Construction University Transportation Center, Moss School of Construction, Infrastructure and Sustainability, Florida International University, Miami, FL 33174, United States
d
Department of Civil and Environmental Engineering, Florida International University, Miami, FL 33174, United States
a r t i c l e i n f o
Article history:
Received 15 August 2019
Received in revised form 28 December 2019 Accepted 9 January 2020
Available online xxxx Keywords:
Crash injury severity
Random Parameter Ordered Probit Model Random Parameter Ordered Logit Model Artificial Neural Networks
Whale Optimization Algorithm
a b s t r a c t
The high number of vehicle–pedestrian crashes in the United State has gained increased attention among transportation safety analysts in recent years. Being directly exposed to the collision force makes pedestrians more prone to becoming severely injured when in crash than other road users. Considering the fact that pedestrian-involved crashes is a seri-ous public health problem, the current study’s aim is to investigate the contributing factors associated with injury severity of pedestrian crashes by time-of-week. Separate injury severity models for weekday and weekend crashes were developed, and the overall stabil-ity of the model estimates was examined through likelihood ratio tests. For this purpose, random parameter ordered-response models were employed to specify the ordinal nature of injury severity levels and capture the potential unobserved heterogeneity. In addition, Artificial Neural Network (ANN) was used to explore the nonlinear relationship between explanatory variables and severity outcomes. Comparison of the prediction performance demonstrated that optimized ANN provides superior results compared to conventional sta-tistical approaches. A variable impact analysis was then conducted on the optimized ANN to investigate the effects of the explanatory variables on injury severity. The results revealed the factors that are significantly associated with pedestrian fatalities. These find-ings further provide insights for a better understanding of pedestrian injury severity in weekday vs. weekend crashes through the impact analysis of various explanatory variables. Ó2020 Tongji University and Tongji University Press. Publishing Services by Elsevier B.V. This is an open access article under the CC BY-NC-ND license (http://creativecommons.org/ licenses/by-nc-nd/4.0/).
1. Introduction
Pedestrian crashes have a considerable impact on society as a leading cause of deaths and serious injuries. According to the Governors Highway Safety Association (GHSA), the number of pedestrian fatalities in traffic crashes in the United States
https://doi.org/10.1016/j.ijtst.2020.01.001
2046-0430/Ó2020 Tongji University and Tongji University Press. Publishing Services by Elsevier B.V. This is an open access article under the CC BY-NC-ND license (http://creativecommons.org/licenses/by-nc-nd/4.0/). Peer review under responsibility of Tongji University and Tongji University Press.
⇑Corresponding author.
E-mail address:[email protected](S. Mokhtarimousavi).
Contents lists available atScienceDirect
International Journal of Transportation
Science and Technology
has grown dramatically over the last ten years. Pedestrian deaths have increased 35% from 4414 in 2008 to 5977 in 2017, and this alarming rise has continued in 2018, although at a slower pace. California is among five states that accounted for 46% of all pedestrian fatalities in the first half of 2018. More specifically, with a total number of 432 deaths, California stands with the highest number of pedestrian fatalities across the nation (Retting et al., 2019).
Despite the fact that recent efforts to enhance pedestrian safety have achieved some success, pedestrians continue to be exposed to a high risk of being injured or killed, especially in poorly designed roadways with less consideration for pedes-trian safety. Crash characteristics differ from location to location, and over time, varying features of participants at fault, environmental conditions, and social factors. As reported by the National Highway Traffic Safety Administration (NHTSA), crashes that occurred during the weekend in 2016 as compared to 2015, accounted for 5.9% increase in crash fatalities, while weekday crashes increased by 5.3% (NHTSA, 2017). An analysis of crash statistics in California between the years 2010 to 2014 shows that although there were 1322 and 712 fatalities in vehicle–pedestrian crashes on weekdays and weekends, respectively, accounting for 17.88% and 25.83% of the total number of crashes (HSIS 2019). In addition, results of recent stud-ies have shown a significant association between crash severity and weekend as a crash contributing factor (Adanu et al.,
2018; Chen and Fan, 2019). That being said, weekend crashes may be more prone to result in fatalities than weekday crashes.
Several previous injury severity studies affirmed that distinguishing different crash types and causes by disaggregating crash records by crash type are categorized as follows: single-vehicle crashes (Behnood and Mannering, 2015), work zone crashes (Mokhtarimousavi et al., 2019), rollover crashes (Chen et al., 2016); location of occurrence: intersections (Lee and
Abdel-Aty, 2005), mountainous freeways (Yu and Abdel-Aty, 2014), roadway type (Anderson and Hernandez, 2017); time
of occurrence: daytime vs. nighttime (Mokhtarimousavi, 2019), day-of-week (Anderson and Dong, 2017), etc. However, the relationship between pedestrian-involved crash characteristics, injury severity risk factors, and day of the week (week-days vs. weekends) are not clearly understood. Moreover, there has been no statistical investigation of whether weekday and weekend crashes should be modeled holistically or independently. With this in mind, there is a clear need to better under-stand the effects of day-of-week and the associated contributing factors (observed and unobserved) on injury severity.
2. Literature review
Statistical modeling has been the primary method used in crash severity analysis for over 50 years. Among the utilized statistical models, regression models are the most common techniques to identify the contributing factors associated with pedestrian-involved crashes. Some examples include the use of Multinomial Logit (ML) model (Mokhtarimousavi, 2019), Mixed Logit (ML) model (Haleem et al., 2015), Ordered Probit (OP) model (Kwigizile et al., 2011), Ordered Logit (OL) model
(Yasmin et al., 2014), etc.
Machine Learning techniques (MLs) have been recently widely applied in transportation studies including traffic safety research. Compared to statistical methods which provide good indications of the likelihood, MLs have been frequently applied as to provide more accurate prediction models due to their ability to deal with more complex functions. Different methods have been employed to solve classification problems such as studying injury severity in safety analysis, including Support Vector Machine (SVM) (Li et al., 2012; Mokhtarimousavi, 2019; Mokhtarimousavi et al., 2019), Artificial Neural Net-work (ANN) (Delen et al., 2006; Moghaddam et al., 2011; Zeng and Huang, 2014; Alkheder et al., 2017; Arhin and Gatiba, 2019), K-Nearest Neighbor (KNN) (Beshah and Hill, 2010; Iranitalab and Khattak, 2017), and decision tree (Kashani and
Mohaymany, 2011; Chang and Chien, 2013). In recent studies that compared the prediction performance of MLs to
conven-tional statistical models, it was demonstrated that MLs provide either superior or comparable prediction performance results
(Li et al., 2012; Zeng and Huang, 2014; Alkheder et al., 2017; Iranitalab and Khattak, 2017; Mokhtarimousavi, 2019;
Mokhtarimousavi et al., 2019). Previous model comparisons have been performed with a number of statistical models such
as Ordered Probit (OP) (Li et al., 2012; Alkheder et al., 2017), Ordered Logit (OL) (Zeng and Huang, 2014), Multinomial Logit (MNL) (Iranitalab and Khattak, 2017; Mokhtarimousavi, 2019), and Binary Mixed Logit (BMXL) (Mokhtarimousavi et al., 2019). However, comparisons between MLs, Random Parameter Ordered Probit, and Random Parameter Ordered Logit mod-els are still lacking in the context of vehicle–pedestrian crash severity analysis. These two modmod-els can address both the ordi-nal nature of injury severity levels and unobserved heterogeneity commonly present in crash data. However, the results of these statistical models may be biased for their two major limitations: pre-assumption of data distribution, and considering a linear form of utility functions (Li et al., 2012; Zeng and Huang, 2014). Without these limitations, ANN can also employed to model the potentially non-linear relation between dependent and explanatory variables in injury severity studies
(Moghaddam et al., 2011; Zeng and Huang, 2014).
The prediction performance of MLs highly depends on the selection of the learning factors and model coefficients
(Mokhtarimousavi et al., 2019). This is usually determined by experience and trial and error methods, which may not result
in proper prediction performance. Evolutionary Algorithms (EAs), compared to conventional search methods such as grid-search and gradient descent (previously widely used), are promising optimization methods used to find a global optimal solution (Ghaedi et al., 2015; Huang et al., 2015; Taghiyeh and Xu, 2016). Taking this into consideration, the Whale Opti-mization Algorithm (WOA), a recent swarm-intelligence metaheuristic algorithm developed byMirjalili and Lewis (2016), was used in this research to train the ANN algorithm.
Aside from the advantages of utilizing ANN, its major limitation lies in the fact that the model works as a black-box. In the course of identifying the effects of explanatory variables on the dependent variable, only a few injury severity studies
conducted a sensitivity analysis (Delen et al., 2006; Moghaddam et al., 2011). Through the applied methods, the importance of each factor is prioritized; however, such methods may not be enough to reveal the detailed impact of explanatory vari-ables on injury severity patterns in the crash. In this regard, as in previous research that performed a sensitivity analysis on SVM and ANN models (Li et al., 2012; Yu and Abdel-Aty, 2013; Zeng and Huang, 2014; Chen et al., 2016), a two-stage sen-sitivity analysis was conducted on the optimized ANN models to explore each explanatory variable’s effect on each injury severity outcome.
In light of this, the purpose of this study is three-fold. First, the current work provides a detailed investigation of vehicle– pedestrian crashes by day-of-week in the state of California from 2010 to 2014. Second, this work performs a parameter transferability test to determine if weekday and weekend crashes need to be considered separately for safety analyses. Third, this study demonstrates the application of ANN trained by WOA in injury severity analysis. The rest of this paper is organized as follows: In the next section, the data description and processing procedure are introduced. A brief description of the meth-ods utilized in this research and their applications are discussed inSection 4, followed by models estimation results pre-sented inSection 5. Finally, the manuscript is concluded by a discussion of the results, and key findings are addressed.
3. Data description
The data used for the analysis were extracted from the Highway Safety Information System (HSIS) crash dataset and con-sisted of a large sample of vehicle–pedestrian crashes that occurred in California from 2010 to 2014 (5 years). Two crash files (accident and vehicle) from the HSIS database were merged based on the variable ‘‘caseno,” and the final dataset was filtered based on the variable ‘‘severity,” which represents the most severe injuries in weekday crashes (i.e., Monday to Friday) and weekend crashes (i.e., Saturday and Sunday) (Nujjetty et al., 2014). After identifying these crashes and performing data cleaning, 10,146 crashes remained for model development, which consisted of 7390 and 2756 weekday and weekend crash records, respectively.
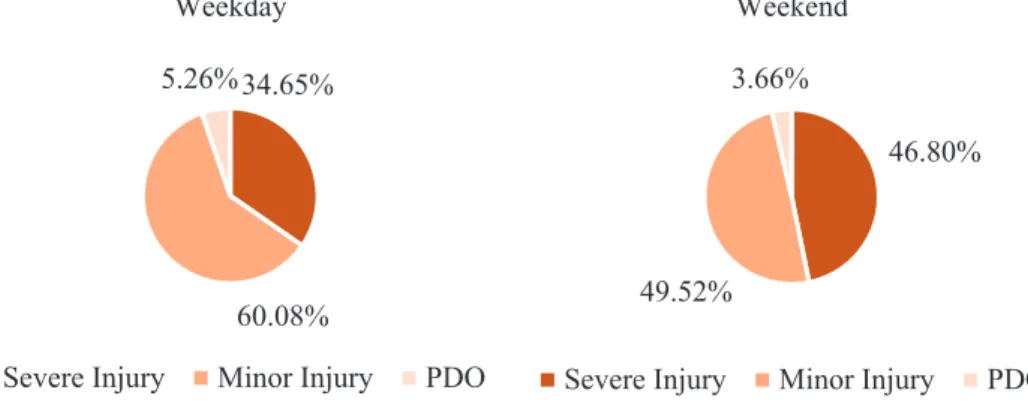
The HSIS data classifies injury severity into five distinct categories: (1) fatal; (2) severe or incapacitating injury; (3) visible or non-incapacitating injury; (4) complaint of pain; and, (5) Property Damage Only (PDO) or no injury. Due to the low fre-quency of crash records in some severity levels and to reach a reasonable percentage of data for modeling purposes, three injury severity categories were used in the analysis: (1) fatal and incapacitating injuries were combined into one severity category called ‘‘Severe Injury,” (2) visible or non-incapacitating injury and complaint of pain were combined in the ‘‘Minor Injury” category, and (3) ‘‘No Injury.” The obtained crashes composed of a total number of 3851 (38.0 percent) severe inju-ries, 5805 (57.2 percent) minor injuinju-ries, and 490 (4.8 percent) no injuries or PDO crashes. Additionally, 43 explanatory vari-ables in the collected data were classified into 14 categories describing driver, pedestrian, vehicle, and crash characteristics, and used in the empirical analysis for each disaggregated dataset of weekday and weekend crashes in order to identify the contributing factors.Fig. 1demonstrates the proportional distribution of injury severity in crash records by day-of-week.
Based on the observed severity proportions, weekend crashes accounted for more severe injury crashes by 12.15% com-pared to weekday crashes.
4. Model specifications
Injury severity is categorized into discrete and ordinal levels. Hence, non-ordinal models cannot capture the ordinal nat-ure inherent to the level of injury severities and therefore may not be appropriate for multi-level injury severity investiga-tion (Paleti et al., 2010; Savolainen et al., 2011). In addition, fixed effects (or non-random parameter) models restrict the effects of explanatory variables to be the same across the crash observations, therefore cannot address unobserved hetero-geneity and can yield biased and inefficient parameter estimates (Christoforou et al., 2010; Kim et al., 2010; Savolainen et al.,
2011; Shaheed et al., 2013; Mamdoohi et al., 2018; Sharifi et al., 2019).
34.65%
60.08%
5.26%
Severe Injury
Minor Injury
PDO
Weekday
46.80%
49.52%
3.66%
Severe Injury
Minor Injury
PDO
Weekend
As mentioned in the previous section, the pedestrian injury severity (dependent variable) in the present study represents an ordered outcome (descending from serious injury to no injury). Therefore, two random parameter ordered-response mod-els, including random parameter order probit and random parameter order logit models alongside ANN were used for pedes-trian crash severity prediction and analysis. The econometric software LIMDEP was used to model the statistical frameworks, and the ANN was coded in MATLAB (R2018b).
Since the applied models have been discussed and are well documented in great details in previous studies, they are not repeated here but are summarized in the sections below.
4.1. Random parameter ordered probit model
Random parameter ordered probit model specification starts from the standard ordered probability model, which cap-tures the effect of independent variables on the ordinal-natured response variable representing injury severity levels. This is derived from a latent variableyand specified as a linear function for each crash observation, such that:
y¼Xbþ
e
ð1ÞwhereXis the vector of considered explanatory variables,bis the vector of estimable parameters, and
e
is a random error term assumed to follow the standard normal distribution (zero mean and unit variance) across crash observations. Taking Eq.(1), each injury severity outcome can be represented as observable:
y¼0 if y60 y¼1 if 0<y6
l
1 y¼2 ifl
2<y6l
1 ... y¼0 ifl
J16y ð2Þwhere
l
are the threshold values used to define the injury severity outcomes. Threshold parameters,l
, are estimated simul-taneously withballowing integer ordering, whereJ is the highest integer. For the current study, the highest integer is defined as no injury. Under the assumption thate
follows a standard normal distribution, the probabilities ofJare computed:Probðy¼0jX¼
U
ðbXÞ Probðy¼1jX¼U
ðl
1bXÞU
ðbXÞ Probðy¼2jX¼U
ðl
2bXÞU
ðl
1bXÞ ... Probðy¼JjX¼1U
ðl
J1bXÞ ð3ÞwhereJrepresents the highest ordered value. In this work, with three severity outcomes,J¼0 for severe injury,J¼1 for minor injury and,J¼2 for no injury.
Next, to address a common limitation in crash data, the ordered probit model is extended to include estimation of random parameters. The key limitation stems from potential variation within observable variables and variation due to unobserv-ables. Therefore, parameters are estimated as:
bq¼bþ
u
q ð4Þwhere
u
q is a randomly distributed term. For the randomly distributed term, several distributions can be assumed for parameters, such as normal, uniform, triangular, etc. For this work,u
qis specified to be normally distributed, where the parameter is determined to be random if the estimated standard deviation is statistically different from zero. In regard to the likelihood function, the Maximum Simulated Likelihood (MLS) method is used in this paper to approximate the value of the complex likelihood integrals with Halton draws. For a detailed explanation, readers are referred to (Greene, 2000;Christoforou et al., 2010; Washington et al., 2010).
4.2. Random parameter ordered logit model
The difference between ordered logit and ordered probit models is the assumption of the distribution of error terms. The error term is assumed to have a standard normal distribution in the ordered probit model, while in the ordered logit model the error term is assumed to follow a logistic distribution (Greene, 2000). Using NLOGIT for the current study, the estimation procedure remains the same with probabilities of the ordered logit model now following the logistic distribution.
The random parameters ordered logit model has been applied in many discrete outcome models in transportation studies, including injury severity analysis (Srinivasan, 2002; Abay, 2013; Naik et al., 2016). Similar to the random parameters ordered probit models, the observed injury severityyis the realization of a latent injury risk propensity for each individual
observation. The parameters are then randomized by incorporating an error term in the model to translate individual hetero-geneity to parameter heterohetero-geneity. Like the probit model, the MSL approach is used for parameter estimations.
4.3. Temporal stability tests
Likelihood ratio tests were conducted to statistically assess if vehicle–pedestrian crash severity models are significantly different across weekdays and weekends. This likelihood ratio test examines the overall stability of model estimates across the considered day-of-week periods. It follows a chi-square distribution in which the degree of freedom is equal to the num-ber of estimated parameters and can be calculated through Eq.(5)(Washington et al., 2010):
x2¼ 2LL b MX1MX2 LLðbMX1Þ ð5Þ whereLLbMX1MX2
is the log-likelihood at the convergence of modelMX1based on using time-period data for modelMX2, and
LLðbMX1Þis the log-likelihood at the convergence of modelMX1. Suppose that the model for weekday crashes is fit using the
data from weekend crashes and vice-versa, and then the original log-likelihood values are used to calculate the chi-square statistics. Finally, by considering the degree of freedom (which is the number of estimated parameters in the model using the other model’s data), the significance is determined.
4.4. Artificial Neural Network (ANN)
Generally, ANN can be classified as a Feedforward Neural Network (FNN) and feedback or a Recurrent Neural Network (RNN) model (Ojha et al., 2017; Neshatpour et al., 2019). The Multi-Layer Perceptron (MLP) is a class of feedforward neural networks that consist of at least three layers of nodes: input layer, hidden layer, and output layer. Incorporating hidden lay-ers and utilizing the non-linear activation function makes MLP capable of capturing complex nonlinear relationships between inputs and outputs through an appropriate learning process. In fact, the classification results of MLP are obtained from all weighted inputsðwÞand biasðbÞ, which are summed up in each artificial neuron. The purpose of training MLP net-works is to find the best set of connection weights and bias to minimize the classification error.
In machine learning algorithms, the training process is an important task that can highly affect the prediction perfor-mance of the model. Training MLP networks is also a complex task in terms of finding the most appropriate training function for classification problems. Among ANN approaches, backpropagation (BP) is the most common method applied for MLP training and is included in safety research, as shown in (Zeng and Huang, 2014) and (Taamneh et al., 2017). In this study, feedforward and cascade forward backpropagation training algorithms were applied to train the base MLP model. In the feedforward network, information moves from the inputs nodes to the output nodes through the hidden nodes all in one direction while there is no loop in the network. Cascade forward networks are similar to the feedforward network, except it includes weighted connection from the input layer and every previous layer to subsequent layers (Goyal and Goyal,
2011; Ojha et al., 2017). A Cross-Validation (CV) based experimental design was used to simultaneously obtain the best
training algorithm with the corresponding optimal number of hidden layers.
4.5. Whale Optimization Algorithm (WOA)
Although the Backpropagation Neural Network (BPNN) as a gradient-based algorithm is a successful learning algorithm for ANN, it suffers from high dependency on the initial solution and the weakness of being trapped in local optima (Yang
et al., 2002; Mokhtarimousavi et al., 2018). To this end, WOA was employed as an alternative to BP for training MLP networks
to optimize connection weights and biases.
WOA is a new metaheuristic algorithm that mimics the foraging of humpback whales. The WOA mathematical modeling is inspired by their three main hunting strategies (Mirjalili and Lewis, 2016):
1. Encircling prey, in which the prey location is identified and encircled by the whale. The position will be updated through the best search agent in the search space.
2. Bubble-net feeding, in which the whale swims around the prey by hunting the prey within a shrinking circle and follow-ing a spiral path concurrently. The distance between whale located and prey located is then calculated.
3. Search for prey, in which the whale searches for the position of the prey either randomly or through the best obtained solution so far.
The fitness function (i.e., minimizing classification error in this study) for each whale is calculated at each iteration, and the best obtained function is determined with its corresponding position. Although the search mechanism of WOA starts with a set of random solutions, it proposed a hyper-cube mechanism. This searching strategy defines a search space around the best found solution and allows other search agents to explore the current best record, which in fact expedites the con-vergence rate. This makes WOA able to adaptively train the ANN algorithm while guarantees exploration and exploitation phases as a population-based algorithm.
4.6. Proposed WOA-MLP training
The WOA global optimization algorithm was employed in this study to train the MLP network. The MLP with initial set-tings was first fitted to obtain the initial solutions, and then the WOA optimized the weights, including the weights connect-ing the input layers with hidden layer, and with hidden layer to output layer, and set of biases. The classification error rate is considered as the fitness function, which is based on calculating the difference between the actual and predicted values by the generated agents for all of the training samples through the use of Eq. (6) (Aljarah et al., 2018):
MSE¼1 n Xn i¼1 yy^ ð Þ2 ð6Þ
where MSE represents the Mean Square Error,yand y^ are the actual and predicted values, andnis the number of instances in the training dataset. The goal is to find the MLP network with the minimum MSE (or maximum model prediction accu-racy) based on the training samples in the dataset. The general framework of the proposed method is illustrated inFig. 2.
4.7. Prediction performance assessment
To assess the prediction performance of the estimated models, the following criteria were calculated (Sokolova and
Lapalme, 2009): Accuracy¼TPþTNTPþþTNFPþFN100% ð7Þ SensitivityðRecallÞ ¼ TP TPþFN100% ð8Þ Specificity¼ TN TNþFP100% ð9Þ F-Score¼2TPþ2TPFNþFP100% ð10Þ
AUC¼12ðTPTPþFNþTNTNþFPÞ ð11Þ
where the parameters in the equations refer to true positive (TP), true negative (TN), false positive (FP), and false negative (FN) counts. From the abovementioned criteria, ‘‘Accuracy” measures the overall effectiveness of a classifier. ‘‘Sensitivity” shows the effectiveness of a classifier to identify positive labels. ‘‘Specificity” illustrates how effectively a classifier identifies negative labels. The ‘‘F-score” shows the relation between the data’s positive labels and those given by a classifier, and ‘‘AUC,” which is the area under the receiver operating characteristic curve, demonstrates the classifier’s ability to avoid false classification. Since we have three levels of injury severity which is considered as a multi-class classification problem, the prediction performance measures are a generalization of the abovementioned criteria.
5. Results
This study estimated and assessed a number of prediction models, including the random parameter ordered probit, ran-dom parameter ordered logit models, and the MLP Neural Network, utilizing the vehicle–pedestrian crash datasets sepa-rately for weekday and weekend days. The MATLAB R2018b programming environment was used to implement machine learning models. The statistical models estimations were undertaken using NLOGIT, Econometric Software version 6. The results are presented in the subsections below.
5.1. Model selection
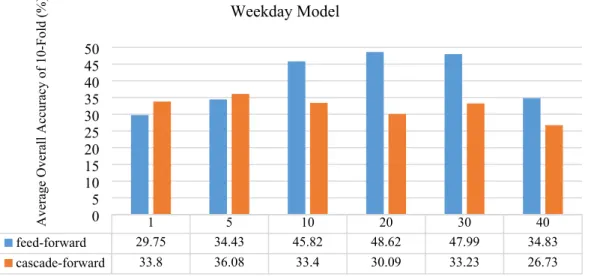
This section provides the prediction performance comparison of the proposed models. To achieve the best training algo-rithm for ANN models and in order to avoid the bias associated with the random splitting of training and testing datasets, a 10-fold cross-validation was employed in each step based on different numbers of hidden layers. The results are summarized
inFig. 3.
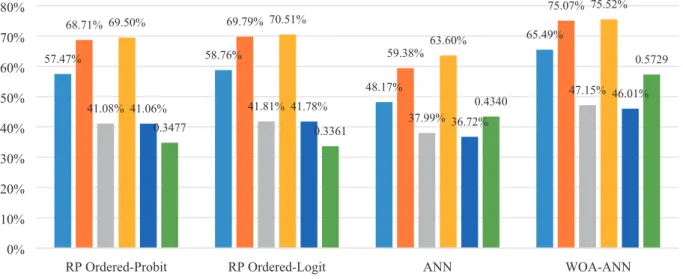
As shown inFig. 3, the feed-forward training algorithms with 20 hidden layers provides the best model accuracy for both weekday and weekend models, hence this model is considered as the base ANN model. To better assess the model prediction performance and taking the data characteristics, such as dimension and unbalanced structure, into account, the whole week-day and weekend datasets were randomly separated into two sub-datasets (a training set and a testing set) with a ratio of 7:3 (i.e., 70% for training and 30% for testing) and 8:2. Preliminary performance test results revealed that feedforward ANN models with the split of 8:2 performed better in both models in terms of overall prediction accuracy. The entire prediction performance comparison of all models is presented inFig. 4.
As shown inFig. 4, although ANN cannot provide a comparable performance when compared with the investigated sta-tistical models, WOA-ANN, with the overall accuracy of 62.25% and average accuracy (i.e., the average per-class) of 72.41%, outperforms the other models. Therefore, WOA-ANN was considered to investigate the impacts of the explanatory variables. In addition, since the RP ordered logit model yield better modeling results (i.e., higher prediction accuracy as well as higher McFadden’s PseudoR2) than RP ordered probit model, it was used for the model transferability test and results comparison.
5.2. Transferability test
In regard to examining the temporal stability of model estimates across day-of-week periods (weekday vs. weekend), applying Eq.(5) results in a chi-square statistic of 1014.25 and 293.80 with the corresponding degrees of freedom of 4 and 2 forMX1 andMX2, respectively. The significant difference between weekday and weekend models suggests that vehi-cle–pedestrian crashes need to be modeled separately for safety analysis with well over 99% confidence. In other words, parameter estimates are statistically different for weekday and weekend crash estimations and are not transferable. This finding is in line with a number of recent safety analysis studies that demonstrated separate injury-severity models that need to be estimated for different time periods (Behnood and Mannering, 2015; Anderson and Dong, 2017;
Mokhtarimousavi, 2019).
5.3. Model estimates and variables impacts
The RP ordered logit estimation results for the weekday and weekend periods with corresponding marginal effects are presented inTables 1and2, respectively. During model estimation, all independent variables were assessed for correlation. If two independent variables were both significant and highly correlated, a log-likelihood ratio test was used to determine which variable should remain in the model specifications. In the estimation results, the random parameters were selected considering the statistically significant standard deviations for the normal distribution. In addition, the marginal effects for the most severe crashes was used to illustrate the injury-severity probability change due to a one-unit change in the explanatory variables.
Although the optimized ANN provides superior prediction results, it has been criticized for performing as a black-box, in which the effect of explanatory variables on severity outcomes cannot be identified. In the concept of machine learning, sen-sitivity analysis is one of the methods used to extract the variable impacts on model output, and is therefore applied in the
current study. In this method, each explanatory variable in the WOA-ANN model was replaced with a user-defined value (considered as a reference case), while the others remain unchanged, and then the probability of each severity outcome after this perturbation was simulated and recorded. The comparative probability results of crash severity outcomes are shown in
Tables 3 and 4for weekday and weekend models, respectively.
6. Discussion
A total of 15 and 12 indicator variables were found to be significant throughout the weekday and weekend RP ordered logit models, with ten variables being significant in both models (weekday and weekend). Of the ten variables found to be significant in both models, three have heterogeneous effects on crash severity outcomes in the weekday model: driving under the influence, dark with no street lights, and vehicle traveling straight. Four effects were found in the weekend mod-els: age greater or equal to 65 years, driving under the influence, crashes that occurred between 4:00 p.m. and 8:00 p.m., and dark with no street lights. To facilitate the discussion, the contributing factors according to the RP ordered logit and WOA-ANN weekday and weekend crash severity models and their effects will be discussed separately in the following subsections. For a results comparison purpose and in order to have a more comprehensive interpretation of the obtained results, the investigation used marginal effects of the variables that were found to have significant impacts in the RP ordered logit model.
1
5
10
20
30
40
feed-forward
29.75
34.43
45.82
48.62
47.99
34.83
cascade-forward
33.8
36.08
33.4
30.09
33.23
26.73
0
5
10
15
20
25
30
35
40
45
50
Weekday Model
Number of Hidden Layers
Average Overall Accuracy of 10-Fold (%)
1
5
10
20
30
40
feed-forward
37.53
32.84
45.46
49.56
45.02
31.01
cascade-forward
38.94
33.76
33.24
23.22
34.83
20.63
0
5
10
15
20
25
30
35
40
45
50
Weekend Model
Number of Hidden Layers
Average Overall Accuracy of 10-Fold (%)
6.1. Weekday crash severity model 6.1.1. Driver parameters
Among driver characteristics, considering the marginal effects results from the RP ordered logit model, driver age groups between 16 to 24, 45 to 54, and greater than 65 are more likely to experience severe injuries in vehicle–pedestrian crashes. The corresponding positive marginal effects of 0.038, 0.074, and 0.069 illustrates that the drivers who are in the age group between 45 to 54 are the most prone to result in severe injuries. Examination of variable impact results based on the WOA-ANN for these three variables shows that with the probability of 0.294, drivers between 45 to 54 are associated with a 1.03% and 3.89% higher probability of being in severe crashes compared to the 16 to 24 and over 65 age groups with the probability of 0.291 and 0.283, respectively. Among these groups, drivers over 65 are less probable to be involved in severe crashes. A
57.47% 58.76% 48.17% 65.49% 68.71% 69.79% 59.38% 75.07% 41.08% 41.81% 37.99% 47.15% 69.50% 70.51% 63.60% 75.52% 41.06% 41.78% 36.72% 46.01% 0.3477 0.3361 0.4340 0.5729
0%
10%
20%
30%
40%
50%
60%
70%
80%
RP Ordered-Probit
RP Ordered-Logit
ANN
WOA-ANN
Overall Accuracy
Average Accuracy
Average Sensitivity
Average Specificity
Average F-Score
AUC
Weekday Models
58.84% 60.09% 45.92% 62.25% 70.39% 71.40% 57.98% 72.41% 42.57% 43.12% 35.71% 45.21% 72.14% 73.06% 62.68% 74.54% 42.54% 43.12% 34.51% 44.84% 0.3353 0.3242 0.4557 0.55920%
10%
20%
30%
40%
50%
60%
70%
80%
RP Ordered-Probit
RP Ordered-Logit
ANN
WOA-ANN
Overall Accuracy
Average Accuracy
Average Sensitivity
Average Specificity
Average F-Score
AUC
Weekend Models
Table 1
Best Fit Ordered Logit Model Specifications for Weekday Crashes.
Variable Coefficient Std. Error t-statistic Marginal Effect
Constant 1.45 0.15 9.82
Driver Parameters
Age (1 if 16 Years to 24 Years, 0 Otherwise) 0.17 0.08 2.05 0.038 Age (1 if 45 Years to 54 Years, 0 Otherwise) 0.32 0.08 3.99 0.074 Age (1 if Greater or Equal to 65 Years, 0 Otherwise) 0.30 0.09 3.27 0.069 Driving Under the Influence (1 if Yes, 0 Otherwise) 1.37 0.14 9.49 0.328
Standard Deviation of Random Parameter 1.25 0.14 8.74
Pedestrian Parameters
Pedestrian Location (1 if in Crosswalk at Intersection, 0 Otherwise) 1.07 0.06 16.75 0.229 Pedestrian Location (1 if in Midblock Crosswalk, 0 Otherwise) 0.88 0.18 4.91 0.164 Pedestrian Location (1 if Not in Roadway, 0 Otherwise) 0.75 0.16 4.77 0.144
Standard Deviation of Random Parameter 0.83 0.15 5.63
Crash Parameters
Time-of-Day (1 if 6:00 a.m. to 10:00 a.m., 0 Otherwise) 0.79 0.09 8.38 0.155 Time-of-Day (1 if 10:00 a.m. to 4:00p.m., 0 Otherwise) 1.15 0.08 14.15 0.224 Time-of-Day (1 if 4:00p.m. to 8:00p.m., 0 Otherwise) 0.80 0.07 11.07 0.165
Weather Condition (1 if Clear, 0 Otherwise) 0.24 0.07 3.39 0.055
Lighting Condition (1 if Dark With No Street Lights, 0 Otherwise) 1.08 0.10 10.51 0.255
Standard Deviation of Random Parameter 2.41 0.10 23.75
Vehicle Parameters
Vehicle Movement (1 if Traveling Straight, 0 Otherwise) 0.52 0.06 8.04 0.118
Standard Deviation of Random Parameter 0.96 0.05 17.67
Vehicle Movement (1 if Turning Right, 0 Otherwise) 0.32 0.13 2.42 0.067
Number of Vehicles Involved in Crash 0.70 0.05 14.30 0.154
Threshold Parameters l1 4.46 0.06 69.68 Model Summary Number of Observations 7390 Log-Likelihood at Zero 6121.36 Log-Likelihood at Convergence 5106.94
McFadden Pseudo R-Squared 0.17
Table 2
Best Fit Ordered Logit Model Specifications for Weekend Crashes.
Variable Coefficient Std. Error t-statistic Marginal Effect
Constant 2.44 0.27 8.93
Driver Parameters
Age (1 if Greater or Equal to 65 Years, 0 Otherwise) 0.40 0.15 2.60 0.097
Standard Deviation of Random Parameter 1.03 0.15 7.01
Driving Under the Influence (1 if Yes, 0 Otherwise) 2.06 0.25 8.09 0.412
Standard Deviation of Random Parameter 2.51 0.24 10.38
Pedestrian Parameters
Pedestrian Location (1 if in Crosswalk at Intersection, 0 Otherwise) 1.12 0.12 9.39 0.270 Pedestrian Location (1 if in Crossing Road Not in Crosswalk, 0 Otherwise) 0.24 0.12 2.05 0.060
Crash Parameters
Time-of-Day (1 if 6:00 a.m. to 10:00 a.m., 0 Otherwise) 0.73 0.17 4.18 0.177 Time-of-Day (1 if 10:00 a.m. to 4:00p.m., 0 Otherwise) 1.26 0.14 9.32 0.298 Time-of-Day (1 if 4:00p.m. to 8:00p.m., 0 Otherwise) 1.08 0.12 8.91 0.259
Standard Deviation of Random Parameter 0.99 0.10 10.14
Weather Condition (1 if Clear, 0 Otherwise) 0.65 0.15 4.21 0.160
Lighting Condition (1 if Dark With No Street Lights, 0 Otherwise) 1.01 0.14 7.09 0.242
Standard Deviation of Random Parameter 1.47 0.13 11.57
Road Surface Conditions (1 if Wet, 0 Otherwise) 0.61 0.22 2.77 0.149
Vehicle Parameters
Vehicle Movement (1 if Traveling Straight, 0 Otherwise) 0.51 0.10 4.90 0.125
Number of Vehicles Involved in Crash 0.88 0.09 9.58 0.219
Threshold Parameters l1 4.53 0.12 37.23 Model Summary Number of Observations 2,756 Log-Likelihood at Zero 2,272.32 Log-Likelihood at Convergence 1,808.98
possible explanation for this finding may be attributed to older drivers driving more cautiously at lower speeds, which is in line with the findings of (Kim et al., 2008).
The other variable found to be statistically significant with a random and normally distributed parameter is DUI. A mean of1.366 and a standard deviation of 1.249 indicates that 86.30% (less than zero) of the crash occurrences are DUIs, and the resultant severity outcome is more likely to be severe. In addition, the WOA-ANN results indicate that with the probability of 0.312, DUI is associated with a 13.45% higher probability of severe injuries compared to non-DUI conditions with the prob-ability of 0.275. This heterogeneous nature is consistent with findings from previous works in which the majority have found alcohol to increase the likelihood of a severe injury crash (Russo et al., 2014; Fountas and Anastasopoulos, 2017).
6.1.2. Pedestrian parameters
Investigating the WOA-ANN results for pedestrian action in the crash reveals that with the probability of 0.350, pedes-trians in roadways were associated with an 11.82%, 25.0%, 27.27%, and 58.37% higher probability of being in severe crashes compared to crossing not in crosswalk, midblock crosswalk, not in roadway, and crossing in crosswalk at intersection con-ditions. Comparing the marginal effects of0.229 for pedestrian crossing in crosswalk at intersection and0.164 not at intersection also indicates that pedestrian crossing in crosswalk at intersection was less likely to experience severe injuries. Driver awareness (or lack thereof) of the presence of pedestrians at a crosswalk can also be a possible explanation for crashes that occur at crosswalk locations, which tends to be less severe compared to roadways. The same results were obtained in previous works, including (Pour-Rouholamin and Zhou, 2016) and (Kim et al., 2013). In addition, pedestrian action not in roadway was found to have a random and normally distributed parameter with a mean of 0.7521 and a standard deviation of 0.826. Thus, in 81.87% (greater than zero) of these crashes, pedestrians were less likely to sustain a severe injury.
6.1.3. Vehicle parameters
When the number of vehicles involved in vehicle–pedestrian crashes increases, the level of injury severity also increases. This variable is statistically significant, with a marginal effect of 0.154 for severe crashes, indicating the positive impact of number of vehicles involved. The WOA-ANN results also show that vehicle–pedestrian crashes with more than two vehicles are associated with a 13.68% higher probability of severe injuries.
Table 3
WOA-ANN Weekday Model Variable Impact Analysis.
Variable Severity Variable Severity
1(a) 2(b) 3(c) 1(a) 2(b) 3(c)
Driver Parameters Vehicle Parameters (Cont.)
Age Vehicle Type
16 to 24 years 0.291 0.621 0.089 Passenger Car 0.295 0.626 0.078
25 to 34 years 0.297 0.612 0.091 Pickup Truck 0.285 0.615 0.100
35 to 44 years 0.285 0.621 0.093 Crash Parameters
45 to 54 years 0.294 0.617 0.089 Time-of-Day
55 to 64 years 0.291 0.615 0.094 6:00 a.m. to 10:00 a.m. 0.267 0.640 0.093 Greater than 65 0.283 0.623 0.094 10:00 a.m. to 4:00p.m. 0.251 0.661 0.088
Gender 4:00p.m. to 8:00p.m. 0.271 0.646 0.083
Male 0.312 0.627 0.060 8:00p.m. to 12:00 a.m. 0.358 0.565 0.078
Female 0.275 0.647 0.077 Weather Condition
Contributing Factor Clear 0.306 0.646 0.047
Driver Inattention 0.280 0.617 0.103 Cloudy 0.292 0.615 0.093
Alcohol Rainy 0.282 0.615 0.103
Not Been Drinking 0.275 0.672 0.053 Surface Conditions
Under the Influence 0.312 0.587 0.101 Dry 0.312 0.648 0.040
Pedestrian Parameters Wet 0.284 0.616 0.100
Pedestrian Action Location Type
Crossing in Crosswalk at Intersection 0.221 0.706 0.074 Intersection 0.264 0.641 0.095
Midblock Crosswalk 0.280 0.617 0.104 Ramp or Collector 0.277 0.625 0.098
Crossing Not in Crosswalk 0.313 0.598 0.089 Lighting Condition
In Roadway, Including Shoulder 0.350 0.568 0.082 Daylight 0.232 0.694 0.074
Not in Roadway 0.275 0.622 0.103 Dusk or Dawn 0.280 0.618 0.102
Vehicle Parameters Dark with Street Lights 0.318 0.601 0.081
Number of Vehicles Dark with No Street Lights 0.341 0.567 0.092
Two Vehicles 0.285 0.669 0.046 Roadway Type
More than two vehicles 0.324 0.585 0.091 Urban Freeway 0.324 0.600 0.076
Vehicle Movement Urban Two-Lane Road 0.279 0.622 0.099
Traveling Straight 0.324 0.591 0.085 Urban Multilane Divided 0.270 0.654 0.076 Turning Right 0.262 0.640 0.098 Urban Multilane Undivided 0.272 0.628 0.101
Turning Left 0.273 0.626 0.101 Rural Two-Lane Road 0.291 0.609 0.100
(a)
Indicates a Severe Injury.
(b)
Indicates a Minor Injury.
(c)
Vehicle movement when traveling straight was found to be statistically significant with a random parameter that is nor-mally distributed with a mean of0.518 and standard deviation of 0.959. This corresponds to 70.55% (less than zero) of the crash occurrences in which a vehicle was traveling straight to result in a higher level of injury severity. Variable impact anal-ysis results also show that traveling straight with the probability of 0.324 is 23.66% and 18.68% higher than those turning right or turning left, respectively. These findings are plausible due to higher speeds associated with a vehicle that is traveling straight compared to turning conditions and consistent with the findings in (Kitali et al., 2017). It was also recently shown that higher speed volatility is associated with a higher likelihood of crash occurrence (Kamrani et al., 2018; Arvin et al., 2019;
Parsa et al., 2019; Parsa et al., 2020).
6.1.4. Crash parameters
Time of crash occurrence is among the most important variables which has been found to be significant in many previous injury severity studies, including (Tay et al., 2011; Anderson and Hernandez, 2017; Mokhtarimousavi et al., 2019). The results from this study show that the vehicle–pedestrian collisions occurred during the nighttime, from 8:00 p.m. to 12:00 a.m. (0.358), were more likely to be associated with severe crashes compared to collisions occurring in daylight. The results of marginal effects for crashes between 6:00 a.m. to 10:00 a.m. (0.155), 10:00 a.m. to 4:00 p.m. (0.224), and 4:00 p.m. to 8:00 p.m. (0.165) all show a negative impact on severe injuries, which are consistent with the results found in (Behnood and Mannering, 2017).
Of the weather parameters, clear conditions were found to be significant in the RP ordered logit model. It shows that under clear weather, the probability of having a severe vehicle–pedestrian crash decreases by 0.055. In addition, for lighting conditions, the dark with no street lights indicator was found to have a random parameter. With a mean of1.075 and stan-dard deviation of 2.407, 67.24% (less than zero) of crashes were more likely to result in a higher severity level. A possible explanation for both conditions could be restricted sight distance at night, especially when there are no lighting facilities on the roadway, and vice-versa for clear weather conditions. It was found that while light shortage led to increase the prob-ability of vehicle–pedestrian collisions (Razi-Ardakani et al., 2018), it has a negative impact on performing proper maneuver by drivers (Mahmoudzadeh et al., 2019).
Table 4
WOA-ANN Weekend Model Variable Impact Analysis.
Variable Severity Variable Severity
1(a) 2(b) 3(c) 1(a) 2(b) 3(c)
Driver Parameters Vehicle Parameters (Cont.)
Age Vehicle Type
16 to 24 years 0.423 0.487 0.090 Passenger Car 0.432 0.493 0.075
25 to 34 years 0.426 0.482 0.092 Pickup Truck 0.414 0.484 0.102
35 to 44 years 0.420 0.485 0.095 Crash Parameters
45 to 54 years 0.413 0.493 0.095 Time-of-Day
55 to 64 years 0.407 0.495 0.098 6:00 a.m. to 10:00 a.m. 0.390 0.507 0.102 Greater than 65 0.409 0.491 0.100 10:00 a.m. to 4:00 p.m. 0.367 0.541 0.092
Gender 4:00 p.m. to 8:00 p.m. 0.396 0.513 0.091
Male 0.461 0.484 0.055 8:00 p.m. to 12:00 a.m. 0.514 0.422 0.064
Female 0.404 0.514 0.082 Weather Condition
Contributing Factor Clear 0.475 0.488 0.037
Driver Inattention 0.399 0.493 0.108 Cloudy 0.407 0.495 0.098
Alcohol Rainy 0.399 0.494 0.108
Not Been Drinking 0.408 0.538 0.054 Surface Conditions
Under the Influence 0.442 0.458 0.100 Dry 0.473 0.496 0.031
Pedestrian Parameters Wet 0.404 0.493 0.103
Pedestrian Action Location Type
Crossing in Crosswalk at Intersection 0.346 0.571 0.083 Intersection 0.385 0.514 0.101
Midblock Crosswalk 0.392 0.500 0.108 Ramp or Collector 0.397 0.506 0.098
Crossing Not in Crosswalk 0.453 0.461 0.086 Lighting Condition
In Roadway, Including Shoulder 0.491 0.435 0.075 Daylight 0.356 0.564 0.080
Not in Roadway 0.397 0.495 0.108 Dusk or Dawn 0.401 0.492 0.108
Vehicle Parameters Dark with Street Lights 0.455 0.468 0.077
Number of Vehicles Dark with No Street Lights 0.485 0.430 0.084
Two Vehicles 0.431 0.526 0.043 Roadway Type
More than two vehicles 0.461 0.454 0.086 Urban Freeway 0.473 0.457 0.070
Vehicle Movement Urban Two-Lane Road 0.402 0.494 0.103
Traveling Straight 0.464 0.457 0.079 Urban Multilane Divided 0.396 0.522 0.082 Turning Right 0.385 0.510 0.105 Urban Multilane Undivided 0.393 0.502 0.105
Turning Left 0.389 0.504 0.107 Rural Two-Lane Road 0.409 0.489 0.102
(a)
Indicates a Severe Injury.
(b)
Indicates a Minor Injury.
(c)
6.2. Weekend crash severity model 6.2.1. Driver parameters
Like weekday crashes, the drivers aged over 65 variable was found to have a positive impact on injury severity, with the marginal effect of 0.097. It was also found to have varying effects on injury severity. With a mean of0.395 and a standard deviation of 1.027, the estimated mean for the parameter is 64.97% less than zero and 35.03% greater than zero. This implies that 64.97% of vehicle–pedestrian crashes that involved drivers over 65 years old were more likely to result in severe crashes during the weekend. Driver age were found to have heterogeneous impacts on injury severity in previous studies, including
(Fountas and Anastasopoulos, 2017) and (Haleem and Gan, 2013). This is related to the fact that age is correlated with other
conditions such as physical fragility and cognitive function, which differ across individuals. Aside from the overall variable impact on severe injuries, WOA-ANN results show that as driver age increased, the propensities of severe injury decreased: age 25–34 (42.6%), age 35–44 (42.0%), 45–54 (41.3%), 55–64 (40.7%), which is in line with the findings of (Kim et al., 2008). However, it slightly increased for the age group over 65.
6.2.2. Pedestrian parameters
Although pedestrian not crossing in a crosswalk experienced a higher probability of being in severe injury crashes of 0.060, the marginal effects show that crossing in a crosswalk at an intersection is associated with a 0.270 lower probability of resulting in a severe injury. WOA-ANN variable impact results also show that the crossing not in crosswalk condition is the second most probable pedestrian action in weekend vehicle–pedestrian crashes, with a probability of 0.453. This is 30.92% higher than the pedestrian crossing in crosswalk at intersection. This is consistent with the results found byHaleem et al.
(2015)where it was demonstrated that crosswalks are associated with a 1.36% reduction in pedestrian severe injuries.
6.2.3. Vehicle parameters
Like weekday crashes, traveling straight was found to be statistically significant. The marginal effect shows that 0.125 is more likely to result in severe crashes. The same pattern as the weekday crash model found in the WOA-ANN variable impacts illustrates that traveling straight tends to increase crash severity by 20.51% and 19.28% compared to turning right or turning left, respectively.
6.2.4. Crash parameters
Regarding time of day, the same variable was found to be as statistically significant as the weekday model, with the same impacts of marginal effects. However, the indicator for crashes between 4:00 p.m. and 8:00 p.m. was found to have a random parameter. With a mean of 1.081 and standard deviation of 0.994, 86.16% (greater than zero) of the crashes occurred during evening peak, resulting in less severe crashes. This is consistent with previous works, in which time-of-day periods were found to have varying effects on injury severity, as well as different contributing factors associated with different time-of-day periods (Pahukula et al., 2015).
Results fromTable 4show that when compared with crashes on dry surface conditions (0.473), the wet surface condition tends to decrease severe crashes by 17.07%. However, the marginal effects show that being in severe crashes is more prob-able on wet surface conditions by 0.149. The results show that the dry surface condition has a positive impact on crash sever-ity, while the wet surface condition is associated with lower probability. Although wet surface condition affects the friction between the tire and the roadway’s surface, drivers are more cautious when experiencing a slippery road surface, which is consistent with the results of recent studies that showed that serious crashes rarely occur during the rainy season (Huang
et al., 2010; Ahangari et al., 2018).
7. Conclusion
Vehicle-pedestrian crashes are a major source of fatal traffic crashes in the United State, and in-depth investigations of the contributing factors are of practical importance to enhancing pedestrian safety. In this study, injury severity was exam-ined through the estimation of two random parameter ordered response models, ordered probit and logit. These models were selected because they account for two main crash data features: the ordered nature of injury severity levels and hetero-geneous effects of factor impacts, both of which cannot be captured by traditional non-heterogeneity-based probability models. However, presumption of crash data distribution and their restrictions on the linear relationship between severity outcomes and explanatory variables are fundamental limitations of such statistical models. With this in mind, ANN models were also proposed for their capability of modeling complex non-linear functions. In addition, WOA was employed for MLP-ANN training. In order to quantify the contribution of the explanatory variables and due to the black-box nature of MLP-ANN, a two-stage sensitivity analysis was conducted through data perturbation comparison techniques.
Comparison of the prediction performance of the proposed models illustrated that while MLP-ANN is not able provide a comparable result compared to RP ordered logit and probit models, the WOA-based training algorithm provided a superior prediction performance. The model prediction performance was evaluated using a number of performance metrics, including prediction accuracy, sensitivity, specificity, f-score and AUC. It was shown that not only can WOA-ANN produce higher pre-diction accuracy in terms of both overall and average accuracy, it is able to avoid false classification. The AUC values of
0.5729 and 0.5592 for WOA-ANN weekday and weekend models illustrates a 32% and 22.71% improvement in model per-formance compared to ANN models, respectively. Notably, it can be noted that WOA-ANN can be employed to overcome ANN sensitivity to unbalanced crash data.
A likelihood ratio test was conducted to justify the use of different models for different day-of-week. The results demon-strated substantial and statistically significant differences between the estimated parameters across days of week (i.e., week-days and weekends should be modeled independently for vehicle–pedestrian crash severity analysis).
This paper jointly explored the contributing factors of vehicle–pedestrian crashes by day-of-week through statistical and WOA-ANN models, where the statistical models deals with likelihood estimation and the relative probability are calculated through the ANN models. Conjunction of the results from these approaches can provide a more comprehensive interpreta-tion of the injury severity outcome, which can help decision-makers in the effective and efficient implementainterpreta-tion of targeted countermeasures. The presence of the temporal instability found in this research can significantly impact the pedestrian-safety practice where accurate prediction of the countermeasures impacts is sought. The analysis sheds light on the internal probability patterns of crash variables in different injury severity levels, as well as their overall impacts. The results of the current study showed that the factors that significantly increased the likelihood of severe crashes included age, alcohol con-sumption, pedestrian presence location, time of day, light, and surface conditions. There are some key findings that are evi-dent from the empirical analysis. For instance, the built environment attributes, such as providing more crossing aides and better lighting, can significantly reduce the likelihood of severe vehicle–pedestrian crashes. Severe injury crashes can also be addressed by the development and better implementation of educational plans for pedestrians and drivers alike. Some states have adopted pedestrian workshops as it pertains to severe pedestrian crashes, which can be a viable option for California agencies, pedestrians, and drivers.
Conflict of interest
The authors declare that they have no known competing financial interests or personal relationships that could have appeared to influence the work reported in this paper.
Acknowledgments
The authors would like to acknowledge Dr. Carol Tan, FHWA, Office of Safety and Research Development, Anusha Patel Nujjetty, Manager at the Highway Safety Information System (HSIS) Laboratory, and all of the staff involved in providing accident data used in this study. This study was financially supported by the University Graduate School of Florida Interna-tional University (FIU) through a Dissertation Year Fellowship, which we gratefully acknowledge. In addition, the support provided by the Accelerated Bridge Construction University Transportation Center (ABC-UTC) at FIU is appreciated.
References
Abay, K.A., 2013. Examining pedestrian-injury severity using alternative disaggregate models. Res. Transp. Econ. 43 (1), 123–136.
Adanu, E.K., Hainen, A., Jones, S., 2018. Latent class analysis of factors that influence weekday and weekend single-vehicle crash severities. Accid. Anal. Prev. 113, 187–192.
Ahangari, S., Jeihani, M., Jarju, A., 2018. Drivers’ behavior analysis under rainy weather conditions using a driving simulator. Proceedings of the Transportation Research Board 97th Annual Meeting, Washington DC, United States.
Aljarah, I., Faris, H., Mirjalili, S., 2018. Optimizing connection weights in neural networks using the whale optimization algorithm. Soft. Comput. 22 (1), 1– 15.
Alkheder, S., Taamneh, M., Taamneh, S., 2017. Severity prediction of traffic accident using an artificial neural network. J. Forecast. 36 (1), 100–108.
Anderson, J., Hernandez, S., 2017. Roadway classifications and the accident injury severities of heavy-vehicle drivers. Anal. Meth. Accid. Res. 15, 17–28.
Anderson, J.C., Dong, S., 2017. Heavy-vehicle driver injury severity analysis by time of week: a mixed logit approach using hsis crash data. ITE J. 87 (9), 41.
Arhin, S., Gatiba, A., 2019. Predicting injury severity of angle crashes involving two vehicles at unsignalized intersections using artificial neural networks. Eng. Technol. Appl. Sci. Res. 9 (2), 3871–3880.
Arvin, R., Kamrani, M., Khattak, A.J., 2019. How instantaneous driving behavior contributes to crashes at intersections: extracting useful information from connected vehicle message data. Accid. Anal. Prev. 127, 118–133.
Behnood, A., Mannering, F., 2017. The effect of passengers on driver-injury severities in single-vehicle crashes: a random parameters heterogeneity-in-means approach. Anal. Meth. Accid. Res. 14, 41–53.
Behnood, A., Mannering, F.L., 2015. The temporal stability of factors affecting driver-injury severities in single-vehicle crashes: Some empirical evidence. Anal. Meth. Accid. Res. 8, 7–32.
Beshah, T., Hill, S., 2010. Mining road traffic accident data to improve safety: Role of road-related factors on accident severity in Ethiopia. In: Proceedings of the AAAI Artificial Intelligence for Development (AI-D ’10), pp. 14–19.
Chang, L.-Y., Chien, J.-T., 2013. Analysis of driver injury severity in truck-involved accidents using a non-parametric classification tree model. Saf. Sci. 51 (1), 17–22.
Chen, C., Zhang, G., Qian, Z., Tarefder, R.A., Tian, Z., 2016. Investigating driver injury severity patterns in rollover crashes using support vector machine models. Accid. Anal. Prev. 90, 128–139.
Chen, Z., Fan, W.D., 2019. A multinomial logit model of pedestrian-vehicle crash severity in north carolina. Int. J. Transp. Sci. Technol. 8 (1), 43–52.
Christoforou, Z., Cohen, S., Karlaftis, M.G., 2010. Vehicle occupant injury severity on highways: an empirical investigation. Accid. Anal. Prev. 42 (6), 1606– 1620.
Delen, D., Sharda, R., Bessonov, M., 2006. Identifying significant predictors of injury severity in traffic accidents using a series of artificial neural networks. Accid. Anal. Prev. 38 (3), 434–444.
Fountas, G., Anastasopoulos, P.C., 2017. A random thresholds random parameters hierarchical ordered probit analysis of highway accident injury-severities. Anal. Meth. Accid. Res. 15, 1–16.
Ghaedi, M., Ansari, A., Bahari, F., Ghaedi, A., Vafaei, A., 2015. A hybrid artificial neural network and particle swarm optimization for prediction of removal of hazardous dye brilliant green from aqueous solution using zinc sulfide nanoparticle loaded on activated carbon. Spectrochim. Acta Part A Mol. Biomol. Spectrosc. 137, 1004–1015.
Goyal, S., Goyal, G.K., 2011. Cascade and feedforward backpropagation artificial neural networks models for prediction of sensory quality of instant coffee flavoured sterilized drink. Canadian J. Artif. Intell., Mach. Learn. Pattern Recognit. 2 (6), 78–82.
Greene, W.H., 2000. Econometric Analysis 4th Edition. Prentice Hall, New Jersey, pp. 201–215.
Haleem, K., Alluri, P., Gan, A., 2015. Analyzing pedestrian crash injury severity at signalized and non-signalized locations. Accid. Anal. Prev. 81, 14–23.
Haleem, K., Gan, A., 2013. Effect of driver’s age and side of impact on crash severity along urban freeways: a mixed logit approach. J. Saf. Res. 46, 67–76.
Hsis, 2019. Highway Safety Information System Crash Database. U.S. Department of Transportation, Federal Highway Administration (FHWA).
Huang, H.-X., Li, J.-C., Xiao, C.-L., 2015. A proposed iteration optimization approach integrating backpropagation neural network with genetic algorithm. Expert Syst. Appl. 42 (1), 146–155.
Huang, H., Abdel-Aty, M., Darwiche, A., 2010. County-level crash risk analysis in florida: Bayesian spatial modeling. Transp. Res. Rec.: J. Transp. Res. Board 2148, 27–37.
Iranitalab, A., Khattak, A., 2017. Comparison of four statistical and machine learning methods for crash severity prediction. Accid. Anal. Prev. 108, 27–36.
Kamrani, M., Arvin, R., Khattak, A.J., 2018. Extracting useful information from basic safety message data: an empirical study of driving volatility measures and crash frequency at intersections. Transp. Res. Rec. 2672 (38), 290–301.
Kashani, A.T., Mohaymany, A.S., 2011. Analysis of the traffic injury severity on two-lane, two-way rural roads based on classification tree models. Saf. Sci. 49 (10), 1314–1320.
Kim, J.-K., Ulfarsson, G.F., Kim, S., Shankar, V.N., 2013. Driver-injury severity in single-vehicle crashes in california: a mixed logit analysis of heterogeneity due to age and gender. Accid. Anal. Prev. 50, 1073–1081.
Kim, J.-K., Ulfarsson, G.F., Shankar, V.N., Kim, S., 2008. Age and pedestrian injury severity in motor-vehicle crashes: a heteroskedastic logit analysis. Accid. Anal. Prev. 40 (5), 1695–1702.
Kim, J.-K., Ulfarsson, G.F., Shankar, V.N., Mannering, F.L., 2010. A note on modeling pedestrian-injury severity in motor-vehicle crashes with the mixed logit model. Accid. Anal. Prev. 42 (6), 1751–1758.
Kitali, A.E., Kidando, E., Sando, T., Moses, R., Ozguven, E.E., 2017. Evaluating aging pedestrian crash severity with bayesian complementary log–log model for improved prediction accuracy. Transp. Res. Rec. 2659 (1), 155–163.
Kwigizile, V., Sando, T., Chimba, D., 2011. Inconsistencies of ordered and unordered probability models for pedestrian injury severity. Transp. Res. Rec. 2264 (1), 110–118.
Lee, C., Abdel-Aty, M., 2005. Comprehensive analysis of vehicle–pedestrian crashes at intersections in florida. Accid. Anal. Prev. 37 (4), 775–786.
Li, Z., Liu, P., Wang, W., Xu, C., 2012. Using support vector machine models for crash injury severity analysis. Accid. Anal. Prev. 45, 478–486.
Mahmoudzadeh, A., Razi-Ardakani, H., Kermanshah, M., 2019. Studying crash avoidance maneuvers prior to an impact considering different types of driver’s distractions. Transp. Res. Procedia 37, 203–210.
Mamdoohi, S., Song, Z., Sharifi, M.S., Nasr-Isfahani, H., 2018. Estimation of standard pedestrian equivalent factors for heterogeneous pedestrian stream containing individuals with disabilities. No.18-06248.
Mirjalili, S., Lewis, A., 2016. The whale optimization algorithm. Adv. Eng. Softw. 95, 51–67.
Moghaddam, F.R., Afandizadeh, S., Ziyadi, M., 2011. Prediction of accident severity using artificial neural networks. Int. J. Civil Eng. 9 (1), 41.
Mokhtarimousavi, S., 2019. A time of day analysis of pedestrian-involved crashes in california: investigation of injury severity, a logistic regression and machine learning approach using hsis data. ITE J. 89 (10), 25–33.
Mokhtarimousavi, S., Anderson, J.C., Azizinamini, A., Hadi, M., 2019. Improved support vector machine models for work zone crash injury severity prediction and analysis. Transp. Res. Rec. 2673 (11), 680–692.
Mokhtarimousavi, S., Talebi, D., Asgari, H., 2018. A non-dominated sorting genetic algorithm approach for optimization of multi-objective airport gate assignment problem. Transp. Res. Rec. 2672 (23), 59–70.
Naik, B., Tung, L.-W., Zhao, S., Khattak, A.J., 2016. Weather impacts on single-vehicle truck crash injury severity. J. Saf. Res. 58, 57–65.
Neshatpour, K., Behnia, F., Homayoun, H., Sasan, A., 2019. Exploiting energy-accuracy trade-off through contextual awareness in multi-stage convolutional neural networks. In: Proceedings of the 20th International Symposium on Quality Electronic Design (ISQED), pp. 265–270.
Nhtsa, 2017, 2016 fatal motor vehicle crashes: Overview. National Highway Traffic Safety Administration, U.S. Department of Transportation, DOT HS 812 456.
Nujjetty, A., Sharma, S., Council, F., 2014. Guidebook for Data Files: California. Washington, DC.
Ojha, V.K., Abraham, A., Snášel, V., 2017. Metaheuristic design of feedforward neural networks: a review of two decades of research. Eng. Appl. Artif. Intell. 60, 97–116.
Pahukula, J., Hernandez, S., Unnikrishnan, A., 2015. A time of day analysis of crashes involving large trucks in urban areas. Accid. Anal. Prev. 75, 155–163.
Paleti, R., Eluru, N., Bhat, C.R., 2010. Examining the influence of aggressive driving behavior on driver injury severity in traffic crashes. Accid. Anal. Prev. 42 (6), 1839–1854.
Parsa, A.B., Movahedi, A., Taghipour, H., Derrible, S., Mohammadian, A.K., 2020. Toward safer highways, application of xgboost and shap for real-time accident detection and feature analysis. Accid. Anal. Prev. 136,105405.
Parsa, A.B., Taghipour, H., Derrible, S., Mohammadian, A.K., 2019. Real-time accident detection: coping with imbalanced data. Accid. Anal. Prev. 129, 202– 210.
Pour-Rouholamin, M., Zhou, H., 2016. Investigating the risk factors associated with pedestrian injury severity in illinois. J. Saf. Res. 57, 9–17.
Razi-Ardakani, H., Mahmoudzadeh, A., Kermanshah, M., 2018. A nested logit analysis of the influence of distraction on types of vehicle crashes. Eur. Transp. Res. Rev. 10 (2), 44.
Retting, R., Rothenberg, H., Schwartz, S., Pedestrian traffic fatalities by state: 2017 preliminary data. Governors Highway Safety Association, Washington, D. C.,https://www.ghsa.org/resources/spotlight-pedestrians18, Accessed Jannuary 10, 2019.
Russo, B.J., Savolainen, P.T., Schneider Iv, W.H., Anastasopoulos, P.C., 2014. Comparison of factors affecting injury severity in angle collisions by fault status using a random parameters bivariate ordered probit model. Anal. Meth. Accid. Res. 2, 21–29.
Savolainen, P.T., Mannering, F.L., Lord, D., Quddus, M.A., 2011. The statistical analysis of highway crash-injury severities: a review and assessment of methodological alternatives. Accid. Anal. Prev. 43 (5), 1666–1676.
Shaheed, M.S.B., Gkritza, K., Zhang, W., Hans, Z., 2013. A mixed logit analysis of two-vehicle crash severities involving a motorcycle. Accid. Anal. Prev. 61, 119–128.
Sharifi, M.S., Song, Z., Esfahani, H.N., Christensen, K., 2019. Exploring heterogeneous pedestrian stream characteristics at walking facilities with different angle intersections. Phys. A: Stat. Mech. Appl. 123112.
Sokolova, M., Lapalme, G., 2009. A systematic analysis of performance measures for classification tasks. Inf. Process. Manage. 45 (4), 427–437.
Srinivasan, K.K., 2002. Injury severity analysis with variable and correlated thresholds: Ordered mixed logit formulation. Transp. Res. Rec. 1784 (1), 132– 141.
Taamneh, M., Alkheder, S., Taamneh, S., 2017. Data-mining techniques for traffic accident modeling and prediction in the united arab emirates. J. Transp. Safety Secur. 9 (2), 146–166.
Taghiyeh, S., Xu, J., 2016. A new particle swarm optimization algorithm for noisy optimization problems. Swarm Intell. 10 (3), 161–192.
Tay, R., Choi, J., Kattan, L., Khan, A., 2011. A multinomial logit model of pedestrian–vehicle crash severity. Int. J. Sustainable Transp. 5 (4), 233–249.
Washington, S.P., Karlaftis, M.G., Mannering, F., 2010. Statistical and Econometric Methods for Transportation Data Analysis. Chapman and Hall/CRC, Boca Raton, FL.
Yang, B., Su, X.-H., Wang, Y.-D., 2002. Bp neural network optimization based on an improved genetic algorithm. In: Proceedings of the International Conference on Machine Learning and Cybernetics, pp. 64–68.
Yasmin, S., Eluru, N., Ukkusuri, S.V., 2014. Alternative ordered response frameworks for examining pedestrian injury severity in new york city. J. Transp. Safety Secur. 6 (4), 275–300.
Yu, R., Abdel-Aty, M., 2013. Utilizing support vector machine in real-time crash risk evaluation. Accid. Anal. Prev. 51, 252–259.
Yu, R., Abdel-Aty, M., 2014. Analyzing crash injury severity for a mountainous freeway incorporating real-time traffic and weather data. Saf. Sci. 63, 50–56.