Dispatch and bidding strategy of active distribution network
in energy and ancillary services market
Yao JIN1, Zhengyu WANG1, Chuanwen JIANG1, Yu ZHANG2
Abstract The active distribution network (ADN) is able to manage distributed generators (DGs), active loads and storage facilities actively. It is also capable of purchasing electricity from main grid and providing ancillary services through a flexible dispatching mode. A competitive market environment is beneficial for the exploration of ADN’s activeness in optimizing dispatch and bidding strategy. In a bilateral electricity market, the decision variables such as bid volume and price can influence the market clearing price (MCP). The MCP can also have impacts on the dispatch strategy of ADN at the same time. This paper proposes a bi-level coordinate dispatch model with fully consideration of the information interaction between main grid and ADN. Simulation results on a typical ADN validate the feasibility of the proposed method. A balanced proportion between energy market and ancillary services market can be achieved.
Keywords Active distribution network (ADN), Energy market, Ancillary services market, Optimal dispatch, Bidding Strategy
1 Introduction
Distributed energy resources (DERs) such as distributed generators (DGs), active loads and storage devices are effective ways for the sustainable development of energy resources. With the integration of DERs into distribution networks, the active distribution network (ADN) is pre-sented [1–4]. ADN is defined as the distribution network with the system controlling a combination of DERs [1]. ADNs are entitled with high dispatch autonomy right, making it possible to provide ancillary services such as spinning reserve service and peak regulation.
Various factors should be considered when making an ADN dispatch plan. The scheduling of DERs as well as the exchanged power between ADN and main grid should be made for dispatch strategy. In addition, the bid price and volume need to be decided for bidding strategy. Lots of researches on the strategy of ADN have been carried out in recent years. A coordinated method is presented to manage ADN concerning the cost of DGs and purchasing electricity in [5]. The scheduling procedure [6] is composed of two stages: a day-ahead scheduler to reduce cost and an intra-day scheduler to meet the operation requirements. Dynamic optimal power flow is applied in active network manage-ment [7]. An optimal schedule model is proposed for ADN to minimize the operation cost of a complete dispatch cycle [8]. A decentralized decision-making framework is pre-sented to determine a secure and economical schedule in
CrossCheck date: 16 August 2015
Received: 28 June 2015 / Accepted: 16 August 2015 / Published online: 30 October 2015
The Author(s) 2015. This article is published with open access at
Springerlink.com & Yao JIN
[email protected] Zhengyu WANG [email protected] Chuanwen JIANG [email protected] Yu ZHANG [email protected]
1 School of Electronic Information and Electrical Engineering,
Shanghai Jiao Tong University, Shanghai 200240, China DOI 10.1007/s40565-015-0161-8
Most of the researches focus on the scheduling of DERs and purchasing electricity when the market clearing price (MCP) is given. However, few efforts have been made to study the coordination between main grid and distribution network. In fact, bidding strategy of ADN can influence the MCP as well. Therefore, the information interaction should be taken into consideration when making an ADN strategy.
Although research work has been seldom conducted on the market participation mechanism of ADN, there are many existing researches focusing on the related concepts, such as power plant, micro-grid and plug-in electric vehi-cles (PEVs), which are of great meaning. Bidding strategy is solved as a bi-level optimization problem in most researches [11–13]. The upper level is a market clearing problem, and the lower level is a dispatch model. Micro-grid resembles ADN in many aspects and the market par-ticipation mechanism is widely studied [14, 15]. When ADN takes part in energy and ancillary services markets at the same time, the balance between the two markets should be considered [16–18].
This paper proposes an optimal dispatch and bidding strategy of ADN considering the combination of energy and ancillary services market. The scheduling of DERs and bid volumes is determined to minimize the total cost. Finally, the proposed method is applied to a typical ADN and the impact of DERs on ancillary services market is investigated.
The remaining sections of this paper are organized as follows. The market framework is presented including energy and ancillary services market clearing problem and the bidding strategy is discussed in Section2. Then, an ADN dispatch model is proposed in Section3. A case study is tested to illustrate the validity of the proposed method in Section4. Section5 concludes this paper.
2 Market framework
Though a fixed electricity market mechanism for ADN does not exist, a competitive market environment can be helpful to the exploration of ADN activeness in optimizing dispatch and bidding strategy. This paper utilizes a pool based bilateral electricity market mechanism, which enables ADN to schedule in response to price signals. Compared with traditional power systems, ADN has more flexibility in dispatch. ADN can not only purchase elec-tricity in energy market, but also provide ancillary services. Specifically, conventional load, storage devices and inter-mittent resources such as wind energy can participate in energy market, while active load can be utilized in
ancillary services market. Controllable DGs such as micro-turbine can be applied in both markets.
2.1 Energy market
In the bilateral electricity market environment, buyers and suppliers both offer bid volume and price to indepen-dent system operator (ISO). MCP is the uniform marginal cost represented as kt. The objective of energy market clearing problem is to maximize the surplus of buyers and suppliers considering the security of power systems. Mathematically, it can be formulated as
maxX T t¼1 XNb j¼1 CbtjPtbjþCDNt PtDNX Ns i UitCtsiPtsi ! ð1Þ s:t: P Ns i¼1 Ut iP t si¼ PNd j¼1 Pt bjþP t DN ð2Þ UitPminsi PtsiUtiPmaxsi ð3Þ 0PtbjPmaxbj ð4Þ
whereT is the total numbers of hours; NbandNs are the numbers of buyers and suppliers, respectively; Cbjt , CDNt andCsit are the bid prices ofjthbuyer, ADN andithsupplier;
Pbjt ,PDNt andPsit are the bid volume ofjthbuyer, ADN and
ith supplier;Uit is the status of ithsupplier (0 is OFF, 1 is ON);Psiminand Psimax are the lower and upper bound ofith supplier’s bid volume; Pdjmax is the upper bound of jth buyer’s load demand.
2.2 Ancillary services market
With the deregulation of power systems, competition mechanism is introduced into the ancillary services market [19, 20]. The ancillary services market mechanism pro-posed in this paper is a bid-based auction model, and the reserve market is taken into account. The participants of reserve market submit two types of bids: capacity bids and energy bids. All bidders are paid capacity price whether reserve capacity is dispatched or not. However, only the dispatched part will be paid energy price. Ancillary ser-vices market clearing problem aims to achieve social cost minimization subject to the required reserve capacity and limits of suppliers.
minX T t¼1 XNs i¼1 UitCrt;iþxCet;iRstiþCrt;DNþxCet;DNRtDN " # ð5Þ s:t: P Ns i¼1 UtiRtsiþRtDNRt ð6Þ 0RtsiminUtiPmaxsi Ptsi; Rui ð7Þ
where Cr,it and Ce,it are reserve capacity and energy bid price ofithsupplier, respectively;Cr,DNt andCe,DNt are bid reserve capacity and energy price of ADN, respectively;Rsit andRDNt are reserve capacity bid volume ofithsupplier and ADN;Rtis the required reserve capacity of the system;RUi is the limit of ramp-up rate;xis the probability that reserve capacity is assumed to be 20 % in this paper. ISO presets the probability x and informs ancillary services market participants in advance.
2.3 Bidding strategy of ADN
ADN can provide ancillary services in addition to chasing energy. In day-ahead market, ADN submits pur-chasing electricity bid to ISO in energy market and reserve capacity bid in ancillary services market. The market framework is shown in Fig.1.
Load demand would be satisfied if the bid price is slightly higher than the MCP in energy market. Similarly, bid volume would be accepted if the bid price is marginally lower than the MCP in ancillary services market. There-fore, only bid volumes need to be determined when designing the strategy of ADN. In order to obtain the MCP, other bidding strategies of market participants are required
in advance. It is assumed that there is a simple linear relationship between the bid price and bid volume, i.e.,
Ci=aiPi?bi, where ai and bi are bidding coefficients which can be estimated based on historical data [21].
3 Dispatch strategy of ADN
3.1 Objective functionThe optimal dispatch problem is defined as the sum of electricity purchasing cost, ancillary services market rev-enues and cost of DGs. The objective function can be formulated as f ¼X T t¼1 ktPtDNCrtþxCet;DNRtDN þ X NDG i¼1 1x ð ÞFi Pti þxFi PtiþR t gi h i ð8Þ Fi Pti ¼U t i ai Pti 2 þbiPtiþciþCsi 1Uit h i ð9Þ
whereNDGis the total number of DGs;PitandRgit are the output and reserve capacity of ith DG in the tth period, respectively;ai,biandciare the coefficients of production cost function; Csiis the start-up cost ofithDG.
3.2 Constraints
1) Power balance
If reserve capacity is not dispatched, Eq. (10) should be satisfied. Otherwise, Eq. (11) holds.
PtDNþX NDG i¼1 PtiUitþPtwþPtdisPtch¼PtL ð10Þ PtDNþX NDG i¼1 PtiþRtgi UitþPtwþPtdisPtch¼PtLRtshift ð11Þ where Pw t
is the wind power;Pch t
andPdis t
are the charge and discharge power of storage device, respectively; PLt is the load demand of ADN;Rshiftt is the shiftable load (pos-itive and negative indicate shifting out and shifting in).
2) DGs constraints
Pmini PtiPmaxi ð12Þ
ADN ISO
Energy market Ancillary service market
Storage devices Active load DGs Suppliers Buyers
TionXion; TioffXioffs ð14Þ
where Pimin and Pimax are the minimum and maximum power output ofithDG;RUiandRDiare the limits of ramp-up and ramp-down rates, respectively;TionandTioffare the continuous up and down time, respectively;XionandXioff are the minimum continues up and down time, respectively.
3) Constraints for active load
Active load can fulfill the target of peak load shifting and hence achieve considerable electricity purchasing cost reduction. Equation (15) ensures that total load demand over the scheduling horizon is satisfied.
XT t¼1
Rtshift¼0 ð15Þ
RminshiftRtshiftRmaxshift ð16Þ
where Rshiftmin and Rshiftmax are the minimum and maximum bounds of shiftable load; respectively, andRshift
min \0. 4) Constraints for storage units
Equation (21) ensures that the state of storage units at the end of scheduling period remains the same with that at the beginning.
0PtdisPmaxdis ð17Þ
0PtchPmaxch ð18Þ SminStSmin ð19Þ St¼St1þPtchgchP t disg 1 dis ð20Þ S1¼ST ð21Þ
wherePchmaxandPdismax are the maximum charging and dis-charging power, respectively;Stis the storage state at time
t; SminandSmaxare the lower and upper bounds of storage capacity, respectively;gchandgdisare the charge and dis-charge efficiency, respectively.
5) Reserve constraints
DGs and active load are utilized for energy and ancillary market. RtDN¼RtgiþRtshift ð22Þ 0Rtgimin UitPmaxi Pti; Rui ð23Þ 6) Security constraints
Voltage levels and line limits are taken into account.
ViminVitVimax ð24Þ
Sti
Smaxi ð25Þ
whereVitis the voltage amplitude at busi;ViminandVimax are the maximum and minimum voltage amplitude, respectively;Sitis the power flow of brunchi;Simaxis the transmission capacity.
Security constraints are satisfied by adding penalty terms to the objective function in this paper.
Penv¼ XNbus i¼1 DVt i Vmax i Vimin ð26Þ Pens¼ X Nbran i¼1 DSt i Smax i ð27Þ
whereNbusandNbranare the number of buses and branches, respectively.
DVitandDSitcan be computed by
DVit¼ max Vmin 0 satisfyð24Þ
i Vit; VitVimax else ð28Þ DSti¼ St 0 satisfyð25Þ i Smax i else ð29Þ
Therefore, the original objective function is modified into fnew.
fnew ¼f þxvPenvþxsPens ð30Þ
wherexvandxsare the penalty factors and are assumed to be 107in this paper.
4 Case study
4.1 Solution procedure
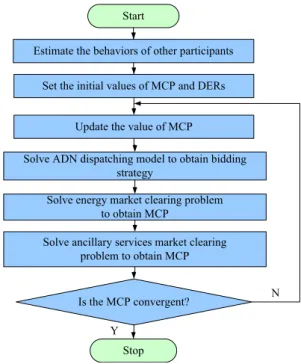
The solution procedure of ADN strategy is shown in Fig.2. The behaviors of other participants are estimated and the initial values are set in advance. Then bid volume and price, which are obtained by solving the ADN dispatch model, are applied to market clearing problem to get the updated value of MCP. This iterative process ends till the convergence of MCP. The ADN dispatch model is a non-linear mixed integer program, and particle swarm
optimization (PSO) algorithm is applied to solve the problem. Simulation process shows that the algorithm has a fast convergence speed.
4.2 Results and analysis
The method proposed in this paper is tested on a system comprised of four suppliers, a buyer and an ADN. The bidding information of market participants is shown in Table1. The maximum and minimum output of Supplier 1 and 3 are 200 MW and 15 MW, respectively. The maxi-mum and minimaxi-mum output of Supplier 2 and 4 are 300 MW and 25 MW, respectively. The ratio of required reserve capacity to system load demand is 20 %. Reserve energy bid price is assumed to be the same with energy market.
As shown in Fig.3, the proposed ADN consists of two DGs at Bus 2 and Bus 5, a wind turbine at Bus 6 and a
storage device at Bus 6. Four active loads are connected to ADN through Bus 3, Bus 4, Bus 5 and Bus 6. The load percent of L1, L2, L3 and L4 are 20 %, 30 % 40 % and 10 %, respectively. Load power factor is assumed to be 0.95. The distribution network is connected to main grid through an interconnecting line with a maximum capacity of 200 MW. Voltage limits are taken to be ±10 % of nominal.
The parameters of distribution network and DGs are shown in Table2 and Table3. The minimum up/down time are 2 h. The limit of ramp up/down is 30 MW/h. It is assumed that 3 % load can be shifted and additional 10 % load can be accepted. The upper and lower bounds of storage capacity are 100 MWh and 10 MWh, respectively. The maximum charging and discharging power are 5 MW and 10 MW, respectively, and the efficiency is 90 %. The hourly load demand and wind power output of a typical day are shown in Fig.4.
Accordingly, the schedule of DERs, bidding strategy and MCP can be obtained through the solution procedure above. This paper fully considers the coordination between the main grid and ADN. A case study is carried out to show the effectiveness of the coordinate dispatch model, com-pared with dispatch model without information interaction. If ADN makes dispatch and bidding strategy independently
Start
Estimate the behaviors of other participants
Is the MCP convergent? Y
Stop
Solve ADN dispatching model to obtain bidding strategy
Update the value of MCP Set the initial values of MCP and DERs
Solve energy market clearing problem to obtain MCP
Solve ancillary services market clearing problem to obtain MCP
N
Fig. 2 Solution procedure of ADN strategy
Table 1 Bidding information
Participant Energy market Ancillary services market
ai($/MW) bi($) ai($/MW) bi($) Supplier 1 0.20 4 0.5 6 Supplier 2 0.12 5 0.3 4 Supplier 3 0.25 4 0.4 4 Supplier 4 0.10 6 0.3 5 Buyer -0.15 30 DG1 Bus 6 DG2 WT Bus 1 Bus 2 Bus 3 Bus 4 Bus 5 L1 L2 L3 L4 ADN Main grid
Fig. 3 Distribution network
Table 2 Parameters of distribution network
From To Resistance Reactance Flow limit (MW)
Bus 1 Bus 2 0.02 0.08 200
Bus 2 Bus 3 0.04 0.15 120
Bus 2 Bus 4 0.03 0.12 120
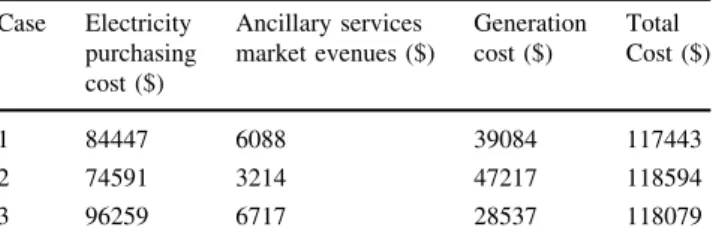
without consideration of market clearing process, elec-tricity price needs to be forecasted in advance. The ana-lyzed cases are as follows.
Case 1: Coordinate dispatch model proposed in this paper.
Case 2: Dispatch model without information interaction, and forecasted electricity price is 1.2 times of MCP.
Case 3: Dispatch model without information interaction, and forecasted electricity price is 0.8 times of MCP.
The cost and benefit of ADN under different cases are shown in Table4, from which we can see the proposed coordinate dispatch model costs the least. The forecasted electricity price of Case 2 is relatively higher, so ADN prefers to generate electricity using DGs rather than pur-chase from main grid. As a consequence, generation cost increases and DGs spare less capacity for ancillary services market. Instead, a lower forecasted electricity price will lead to the increase of electricity purchasing cost as shown in Case 3. Above all, optimal economic benefit can be achieved through information interaction between main grid and distribution network.
In order to analyze the impact of DERs on the economic efficiency of ADN, three different cases are considered as follows.
Case 1: ADN with active load and storage device. Case 2: ADN only with storage device.
Case 3: ADN only with active load.
Table5 shows the cost and benefit of ADN in three different cases. The results show that DERs are beneficial to cost reduction. Electricity purchasing cost reduction can be achieved through load shifting from high price period to low price period by active load and storage device. Addi-tionally, benefit can be made through providing reserve capacity in ancillary services market.
The bid volumes in energy and ancillary services market are shown in Fig.5. It can be observed that the trend of bid volume in energy market and load demand is roughly consistent. Hence ADN bidding strategy is mainly
Table 3 Parameters of DGs DG Upper limit of output (MW) Lower limit of output (MW) ai($/MW2) bi(MW) ci($) Start cost ($) 1 70 10 0.18 4 100 120 2 110 30 0.12 3 70 150
Fig. 5 Bids for energy market and ancillary services market
Table 4 Cost and benefit of ADN under different cases
Case Electricity purchasing cost ($) Ancillary services market evenues ($) Generation cost ($) Total Cost ($) 1 84447 6088 39084 117443 2 74591 3214 47217 118594 3 96259 6717 28537 118079
Table 5 Cost and benefit of ADN under different cases
Case Electricity purchasing cost ($) Ancillary services market revenues ($) Generation cost ($) Total cost ($) 1 84447 6088 39084 117443 2 85745 5459 38022 118308 3 84844 5467 38353 117730
determined by energy market. Bid volume is relatively higher during 1:00–3:00, because DGs are shut down due to low economic efficiency, making purchasing electricity become the only energy source. The bid volume in ancil-lary services market is influenced by the limit of dis-patchable reserve capacity as well as MCP. DGs are in the state of nearly full capacity operation during peak hours, so the corresponding bid volume is relatively less.
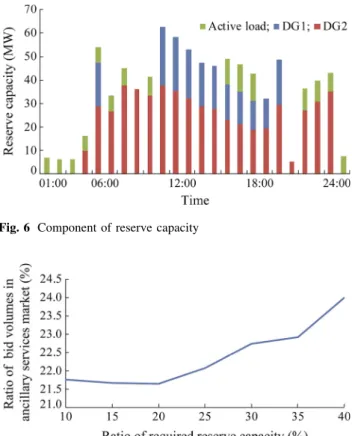
The component of reserve capacity is shown in Fig.6. The total demand of reserve capacity is supplied by DGs and active load. It can be found that DG2 with a larger capacity works as the main source of reserve capacity. Active load mainly provide reserve capacity during 1:00–9:00 and 21:00–24:00, when MCP and load demand are low.
The bid volume in ancillary services market is proportional to system required reserve capacity shown in Fig.7. This is mainly because MCP increases with the reserve capacity demand when other conditions keep constant. Therefore, ADN would adjust the ratio of bid volume between two markets to achieve benefit maximization accordingly.
5 Conclusion
In this paper, a dispatch and bidding strategy of ADN in energy and ancillary services market is introduced to
demonstrate the effectiveness of the proposed model. Results show that ADN can reduce electricity purchasing cost in energy market and get revenue from ancillary ser-vices market through flexible dispatch of DERs. In addi-tion, the obtained strategy can proportion the bid of the two markets according to MCP and security constraints.
Acknowledgments This work was supported by the National High Technology Research and Development Program of China (No. 2014AA051902) and State Grid Science & Technology Project (No. 5217L0140009).
Open Access This article is distributed under the terms of the
Creative Commons Attribution 4.0 International License (http://
creativecommons.org/licenses/by/4.0/), which permits unrestricted use, distribution, and reproduction in any medium, provided you give appropriate credit to the original author(s) and the source, provide a link to the Creative Commons license, and indicate if changes were made.
References
[1] D’Adamo C, Jupe S, Abbey C (2009) Global survey on planning and operation of active distribution networks—update of CIGRE C6.11 Working Group activities. In: Proceedings of the 20th International conference and exhibition on electricity distribution (CIRED’09): Part 1. IET, Prague, Czech, 8–11 June 2009, pp 1–4 [2] Fan MT, Zhang ZP, Su AX et al (2013) Enabling technologies for active distribution systems. Proc CSEE 33(22):12–18 (in Chinese) [3] McDonald J (2008) Adaptive intelligent power systems: active
distribution networks. Energy Policy 36(12):4346–4351 [4] Esau Z, Jayaweera D (2014) Reliability assessment in active
distribution networks with detailed effects of PV systems. J Mod Power Syst Clean Energy 2(1):59–68
[5] Peikherfeh M, Seifi H, Sheikh-El-Eslami MK (2011) Active management of distribution networks in presence of distributed generations. In: Proceedings of the 2011 International confer-ence on clean electrical power (ICCEP’11). IEEE, Ischia, Italy, 14–16 June 2011, pp 725–729
[6] Borghetti A, Bosetti M, Grillo S et al (2010) Short-term scheduling and control of active distribution systems with high penetration of renewable resources. IEEE Syst J 4(3):313–322 [7] Gill S, Kockar I, Ault GW (2014) Dynamic optimal power flow
for active distribution networks. IEEE Trans Power Syst 29(1):121–131
[8] You Y, Liu D, Zhong Q et al (2014) Research on optimal schedule strategy for active distribution network. Autom Electr Power Syst 38(9):177–183 (in Chinese)
[9] Kargarian A, Fu Y (2014) System of systems based security-constrained unit commitment incorporating active distribution grids. IEEE Trans Power Syst 29(5):2489–2498
[10] Zhang JT, Cheng HZ, Wang C (2009) Technical and economic impacts of active management on distribution network. Int J Electr Power Energy Syst 31(2/3):130–138
[11] Jain AK, Srivastava SC, Singh SN et al (2011) Demand respon-sive bidding strategy of a buyer in uniform price electricity market. In: Proceedings of the 2011 IEEE PES international conference on innovative smart grid technologies-India (ISGT India’11). IEEE, Kollam, India, 1–3 Dec 2011, pp 268–273 [12] Huang H, Li FX (2015) Bidding strategy for wind generation
considering conventional generation and transmission con-Fig. 6 Component of reserve capacity
[13] Gonzalez Vaya M, Andersson G (2013) Optimal bidding strat-egy of a plug-in electric vehicle aggregator in day-ahead elec-tricity markets. In: Proceedings of the 10th international conference on European energy market (EEM’13). IEEE, Stockholm, Sweden, 27–31 May 2013, pp 1–6
[14] Venkatesan N, Solanki J, Solanki SK (2011) Market optimiza-tion for microgrid with demand response model. In: Proceedings of the North American power symposium (NAPS’11). IEEE, Boston, MA, USA, 4–6 Aug 2011, pp 1–6
[15] Palizban O, Kauhaniemi K, Guerrero JM (2014) Microgrids in active network management—Part I: hierarchical control, energy storage, virtual power plants, and market participation. Renew Sustain Energy Rev 36:428–439
[16] Mashhour E, Moghaddas-Tafreshi SM (2011) Bidding strategy of virtual power plant for participating in energy and spinning reserve markets—Part I: problem formulation. IEEE Trans Power Syst 26(2):949–956
[17] Foster JM, Caramanis MC (2010) Energy reserves and clearing in stochastic power markets: the case of plug-in-hybrid electric vehicle battery charging. In: Proceedings of the 49th IEEE conference on decision and control (CDC’10). IEEE, Atlanta, GA, USA, 15–17 Dec 2010, pp 1037–1044
[18] Zhang SQ, Mishra Y, Ledwich G et al (2013) The operating schedule for battery energy storage companies in electricity market. J Mod Power Syst Clean Energy 1(3):275–284 [19] Wang JX, Wang XF, Wu Y (2005) Operating reserve model in
the power market. IEEE Trans Power Syst 20(1):223–229 [20] Yu CW, Zhao XS, Wen FS et al (2005) Pricing and procurement
of operating reserves in competitive pool-based electricity markets. Electr Power Syst Res 73(1):37–43
[21] Ma L, Wen FS, Ni YX et al (2003) Optimal bidding strategies for generation companies in electricity markets with transmis-sion capacity constraints taken into account. In: Proceedings of
the 2003 IEEE Power Engineering Society general meeting, vol 4. IEEE, Toronto, Canada, 13–17 July 2003, p 4
Yao JIN received the B.S. degree in electrical engineering from Shanghai Jiao Tong University, Shanghai, China, in 2013. Currently, he is pursuing the M.S. degree in the School of Electronic Information and Electrical Engineering, Shanghai Jiao Tong University, Shanghai, China. His research interests include power system optimization and power market.
Zhengyu WANGreceived the B.S. degree in electrical engineering from Xi’an Jiao Tong University, Shanghai, China, in 2012. Currently, he is pursuing the M.S. degree in the School of Electronic Information and Electrical Engineering, Shanghai Jiao Tong Univer-sity, Shanghai, China. His research focuses on power system economics and optimization.
Chuanwen JIANG received the M.S. and Ph.D. degrees from Huazhong University of Science and Technology, Wuhan, China, in 1996 and 2000, respectively, and completed his postdoctoral research in the School of Electronic Information and Electrical Engineering, Shanghai Jiao Tong University, Shanghai, China, in 2002. He is a Professor with the School of Electronic Information and Electrical Engineering, Shanghai Jiao Tong University. He is currently researching reservoir dispatch, load forecast in power systems, and electrical power market.
Yu ZHANG is now a senior engineer in Guizhou Power Grid Corporation Power Grid Planning and Research Center. His research interests include power network planning and line loss management.