Evaluation of prognostic models developed using standardised image features 1
from different PET automated segmentation methods 2
3
Authors
4
Craig Parkinsona ([email protected]), 5
Kieran Foleyb ([email protected]), 6
Phil Whybraa ([email protected]), 7
Robert Hillsc ([email protected]), 8
Ashley Robertsd ([email protected]), 9
Chris Marshalle ([email protected]), 10
John Staffurthb,f ([email protected]), 11
Emiliano Spezia,f ([email protected]) 12
13
Affiliations
14
aCardiff School of Engineering, Cardiff University, Queen’s Buildings, 14-17 The Parade, 15
Cardiff, CF24 3AA, UK. 16
bDivision of Cancer & Genetics, School of Medicine, UHW Main Building, Heath Park, Cardiff, 17
CF14 4XN, UK. 18
cClinical Trials Unit, Cardiff University, Cardiff, CF10 3AT, UK. 19
dClinical Radiology, University Hospital of Wales, Heath Park, Cardiff, CF14 4XW 20
Cardiff, UK. 21
eWales Research & Diagnostic PET Imaging Centre, Cardiff University, School of Medicine, 22
Ground Floor, C Block, UHW Main Building, Heath Park, Cardiff, CF14 4XN, UK. 23
fVelindre Cancer Centre, Velindre Rd, Cardiff, CF14 2TL, UK. 24
25
Corresponding author
26
Kieran Foleyb ([email protected]) 27
28
Acknowledgements
29
This work was partially funded by EPSRC-DTP grant ref EP/M507842/1, Velindre NHS 30
Trust grant Number 2016/1 and Tenovus Cancer Care (TIG2016/04). 31
Highlights
1
Texture features are dependent on the segmentation method 2
Prognostic scores differ between models derived using different segmentation methods 3
Patient risk stratification using identical clinical data is dependent on the segmentation 4
method 5
1
Background. 2
Prognosis in oesophageal cancer (OC) is poor. The 5-year overall survival (OS) rate 3
is approximately 15%. Personalised medicine is hoped to increase the 5 and 10-year 4
OS rates. Quantitative analysis of PET is gaining substantial interest in prognostic 5
research, but requires the accurate definition of the metabolic tumour volume. This 6
study compares prognostic models developed in the same patient cohort using 7
individual PET segmentation algorithms and assesses the impact on patient risk 8 stratification. 9 10 Methods. 11
Consecutive patients (n=427) with biopsy-proven OC were included in final analysis. 12
All patients were staged with PET/CT between September 2010 and July 2016. Nine 13
automatic PET segmentation methods were studied. All tumour contours were 14
subjectively analysed for accuracy and segmentation methods with <90% accuracy 15
were excluded. Standardised image features were calculated and a series of 16
prognostic models were developed using identical clinical data. The proportion of 17
patients changing risk classification group were calculated. 18
19
Results.
20
Out of 9 PET segmentation methods studied, Clustering Means (KM2), General 21
Clustering Means (GCM3), Adaptive Thresholding (AT) and Watershed Thresholding 22
(WT) methods were included for analysis. Known clinical prognostic factors (age, 23
treatment and staging) were significant in all of the developed prognostic models. AT 24
and KM2 segmentation methods developed identical prognostic models. Patient risk 25
stratification was dependent on the segmentation method used to develop the 26
prognostic model with up to 73 patients (17.1%) changing risk stratification group. 27
28
Conclusion.
29
Prognostic models incorporating quantitative image features are dependent on the 30
method used to delineate the primary tumour. This has a subsequent effect on risk 31
stratification, with patients changing groups depending on the image segmentation 32
Keywords 1
Prognostic Model, Esophageal Cancer, PET/CT, Automated Segmentation 2
Introduction 1
Prognosis in oesophageal cancer (OC) is poor. The 1- and 5-year overall survival 2
(OS) rate is 44% and 15%, respectively [1]. The aim of precision medicine and 3
prognostic models is to ensure each patient is managed with the most appropriate 4
treatment, which may improve patient OS [2–4]. The avoidance of futile aggressive 5
therapies prevents unnecessary treatment and improves quality of life. In addition, 6
better patient stratification may also allow more efficient trial designs. 7
8
Prognostic models are formulated from patient specific information such as age, 9
pathological subtype, molecular characterisation and tumour staging. However, the 10
advanced quantitative analysis of medical images, especially CT, MR and PET, is 11
gaining substantial interest in prognostic research as more accurate prognostic 12
models may be developed. Radiomic features characterise tumour phentotypes 13
through extraction of high dimensional data [5] and can be associated with 14
metastatic growth, recurrence and survival in several solid cancers [6]. These 15
methods may also have added prognostic value in cancer staging pathways [7]. 16
17
The accurate delineation of the relevant metabolic tumour volume (MTV) on PET/CT 18
is challenging due to low spatial resolution and the high noise characteristics of PET 19
imaging [8]. Many different PET segmentation techniques have been proposed as a 20
solution to the delineation of the MTV [9]. Numerous PET based radiomic features 21
have been described, but the results of radiomic analysis are highly dependent on 22
the method used to derive the MTV [10]. Few studies have compared results of 23
radiomic analysis derived from each segmentation method (cf. [11] and references 24
therein) or have investigated their effect on patient risk stratification derived from 25
prognostic models [12–14]. 26
27
This study aimed to develop a series of prognostic models in the same patient cohort 28
using identical clinical data and standardised radiomic features derived from different 29
segmentation methods. The impact of using different segmentation methods on 30
patient risk stratification was assessed. 31
32 33
Materials and Methods 1
2
Patient Cohort 3
This is a retrospective cohort study of consecutive patients with biopsy-proven OC, 4
including gastro-oesophageal junctional (GOJ) tumours, radiologically staged 5
between 16th September 2010 and 31st July 2016. Patients were identified from a
6
database of OC patients used in a previous study [15]. Institutional Review Board 7
approval was granted and requirement for informed consent was waived (Wales 8
REC 1, UK reference 14/WA/1208). 9
10
Overall, 486 patients with FDG-avid primary oesophageal and GOJ tumours were 11
considered for inclusion. Fourteen patients were excluded due to missing clinical 12
data. All patients were deemed to have potentially curable disease following 13
contrast-enhanced CT staging investigation. All PET/CT examinations were 14
performed separately, following the initial CT, and reported in the same centre by 15
Consultant Radiologists with an interest in Nuclear Medicine. Radiological staging 16
was performed according to the International Union Against Cancer (UICC) TNM 7th
17
edition [16]. Following exclusions, 472 patients were studied. 18
19
PET/CT protocol 20
Patients were fasted for at least 6 hours prior to tracer administration. Serum glucose 21
levels were routinely checked and confirmed as less than 7.0 mmol/L prior to 22
imaging. Patients received a dose of 4MBq of 18F-FDG/kg. Uptake time was 90
23
minutes, standard practice at our institution. A GE 690 scanner (GE Healthcare, 24
Buckinghamshire, UK) was used. CT images were acquired in a helical acquisition 25
with a pitch of 0.98 and tube rotation speed of 0.5 seconds. Tube output was 120 26
kVp with output modulation between 20 and 200 mA. Matrix size for the CT 27
acquisition was 512 x 512 pixels with a 50 cm field of view. No oral or intravenous 28
contrast was administered. PET images were acquired at 3 minutes per field of view. 29
The length of the axial field of view was 15.7 cm (skull base to mid-thigh). Images 30
were reconstructed with the ordered subset expectation maximisation algorithm, with 31
24 subsets and 2 iterations. Matrix size was 256 x 256 pixels, using the VUE Point™ 32
time of flight algorithm. All PET based data was obtained using the same PET/CT 33
scanner and reconstruction method with voxel dimensions of 2.73 x 2.73 x 3.27 mm. 34
1 2
Treatment Protocols 3
Patients began treatment 2-4 weeks after staging FDG PET/CT imaging. Patients 4
either had endoscopic mucosal resection (EMR), surgery alone, neo-adjuvant 5
chemotherapy (NACT) or neo-adjuvant chemoradiotherapy (NACRT) prior to 6
surgery, definitive chemo-radiotherapy (dCRT) or palliative therapy. The optimum 7
treatment strategy was decided by consensus at the MDT. In general, fit patients 8
with tumours pre-operatively staged as T3/T4a, N0/N1 were pre-operatively treated 9
with NACT or NACRT. Less fit patients, or those with T1/2 N0 disease, had surgery 10
alone. Patients deemed unsuitable for surgery due to co-morbidity and/or 11
performance status, extensive loco-regional disease, or personal choice received 12
dCRT. 13
14
Data Preparation and PET Segmentation 15
Manual delineation of the metabolic tumour volume (MTV) is limited by intra and inter 16
observer variability and is time consuming [17–19]. Semi-automated and automated 17
segmentation methods are favourable alternatives by reducing variability in 18
delineation and decreasing the contouring time [20]. Fixed percentage thresholding 19
has been shown to be dependent upon the SUVmax of a tumour as well as the MTV
20
[21]. Furthermore, it has been shown that texture analysis of PET imaging is 21
dependent upon the segmentation method used to define the MTV [12,22,23]. 22
However, more complex segmentation algorithms such as adaptive iterative 23
thresholding (AT) have been shown to be independent of SUVmax as well as being
24
correlated to the MTV. Segmentation methods adopting clustering techniques such 25
as Fuzzy C-means (FCM), Gaussian Fuzzy C-means (GCM) and K-means (KM) 26
using 2,3 and 4 clusters (FCM2, GCM3 - 4, KM2 - KM4), as well as region growing 27
(RG) and watershed transform (WT) methods, are promising segmentation methods 28
in the delineation of the MTV. These segmentation methods are reviewed in detail in 29
the report by Hatt et al [9], are described in detail previously [24] and are 30
summarised in Table 1. In each case, the MTV was defined using AT, FCM2, GCM3, 31
GCM4, KM2, KM3, KM4, RG and WT PET segmentation methods. 32
Table 1: Name and description of PET-AS methods used in this study, with references of
1
published work using similar segmentation approaches
2
Algorithm Description Key References
AT
3D Adaptive iterative thresholding, using
background subtraction Jentzen et al [25], Drever et al [26]
RG
3D Region-growing with automatic seed finder and
stopping criterion Day et al [27]
KM
3D K-mean iterative clustering with custom
stopping criterion Zaidi and El Naqa [8]
FCM
3D Fuzzy C-mean iterative clustering with custom
stopping criterion Belhassen and Zaidi [28]
GCM
3D Gaussian Mixture Models based clustering with custom stopping criterion
Hatt et al [29]
WT
Watershed Transform-based algorithm, using sobel filter
Geets et al [30], Tylski et al [31]
3
A clinical radiologist subjectively assessed each tumour contour produced by all 9 4
PET segmentation methods for accurate tumour representation. All tumour contours 5
were visualised using the same software and image settings to ensure consistent 6
methodology. Segmentation methods were considered inadequate for further 7
analysis if less than 90% of contours were non-representative. This pre-defined 8
value was decided upon prior to image visualisation. Contours were assessed 9
individually and classified as not representative if contours were greatly different 10
from the primary tumour, or included bone, lung or medistinial tissue. In addition, 11
segmentation methods that had failed and conformed to the boundary of the 12
bounding box were defined as not representative of the primary tumour. 13
14
Clinical Data & image analysis 15
Only primary tumours were analysed to ensure consistent methodology across all 1
patients. Before quantitative image analysis and texture feature extraction, PET 2
images were re-sampled into 0.5 SUV bins. A fixed bin width maintains a constant 3
intensity resolution when compared to approaches based on fixed number of bins 4
[32]. In the development of the prognostic models, age at diagnosis (number of 5
years), radiological stage (stage IA-IV) and treatment (curative vs palliative) were 6
included because these are strong predictors of survival [33]. Curative and palliative 7
treatments were coded as 1 and 2 respectively. Radiological staging was modelled 8
categorically. 9
10
Radiomic analysis was performed using features implemented as part of the Image 11
Biomarker Standardisation Initiative (IBSI), a multicenter, international collaboration 12
aimed at improving the reproducibility and validation of quantitative medical image 13
analysis studies [5]. The radiomic features selected for inclusion in this study were 14
chosen as they have shown prognostic and predictive significance in other radiomic 15
studies investigating OC [12,34,35]. These have been summarised in Table 2. 16
Moreover, many radiomic feature implementations have been described [6,7,34,36] 17
and are divided into three groups for which a summary is provided. In this study the 18
MTV was analysed as a 3D volume with no thresholding applied to the MTV mask. 19
20
Table 2: Summary of quantitative imaging features
21
Type / Order of statistics
Feature Brief Definition
Morphological Volume Sum of voxels delineated multiplied by the volume of one voxel
Pre-discretisation SUVmax Maximum uptake of FDG in the MTV
Energy Sum squared SUV values in the MTV
First order Skewness Measures symmetry of intensity histogram
Kurtosis Measures flatness of intensity histogram
Second order Dissimilarity Variation of grey level pairs (GLCM). Features were calculated for each unique direction and averaged with a distance setting of 1.
Higher order Grey-level Non-uniformity Distribution of zone counts for each intensity value (GLSZM)
Zone Percentage Fraction of recorded zones compared to maximum possible
Coarseness Measures spatial rate of change in intensity using a distance of 1.
1
First Order metrics 2
First order statistical metrics summarise the voxel intensity distribution within the 3
segmented MTV, without concern for spatial relationships[37]. First order metrics are 4
typically histogram based and reduce the MTV to singular values describing the 5
mean, minimum, maximum, median, uniformity of the intensities within the MTV. 6
Included in first order stastical analysis is Skewness (asymmetry measure), Kurtosis 7
(pointiness measure) and Entropy (randomness measure). Kurtosis and skewness 8
have been shown to be independent predictors of survival [15], and of prognostic 9
significance in the literature [38]. 10
11
Higher Order metrics 12
Higher order statistical metrics retain spatial information and are used to quantify 13
inter-voxel intensity relationships. Dissimilarity is the quantification of variation in 14
voxel pairs and is calculated using a Grey Level Co-occurrence Matrix (GLCM) 15
generated for each unique direction and averaged. A low dissimilarity is resultant of 16
neighboring voxels having similar values [39]. Zone percentage is calculated from a 17
Grey Level Size Zone matrix (GLSZM) by assessing the fraction of recorded zones 18
compared to the maximum number of possible zones. Heterogeneous MTV’s have 19
high zone percentage scores. Grey Level Non-Uniformity (GLNU) is an evaluation of 20
the distribution of zone counts for each intensity value. The feature value is low when 21
the number of zones associated with each intensity value are similar. Coarseness is 22
a neighborhood grey-tone difference matrix (NGTDM) feature that gives an indication 23
of the level of spatial rate of change in intensity [40]. GLCM, GLSZM, NGTDM can 24
be computed in 2D or 3D. The matrices in this study were computed in 3D as this 25
may highlight the multi-scale, directional properties of tumour tissue [41]. 26
1
Outcome Data 2
The primary outcome of the study was OS, defined as number of months survived 3
from date of diagnosis. Patients were followed-up 3-monthly for the first year, 6-4
monthly until 5 years then annually thereafter, or until death. All included patients 5
were followed-up for at least 12 months. Date of death was obtained from the 6
Cancer Network Information System Cymru database (CaNISC, Velindre NHS Trust, 7 Wales). 8 9 Statistical Analysis 10
Categorical variables were described as frequency (percent) and continuous 11
variables as median (range) and differences assessed with appropriate non-12
parametric tests. Cumulative survival was calculated by the Kaplan-Meier life-table 13
method. Cox Regression models with backward conditional method were 14
constructed using identical clinical data and imaging data derived from each of the 15
segmentation methods. An individual prognostic score was calculated from each 16
segmentation method by summation of the products of variables and their 17
corresponding parameter estimate. Using this score, patients were separated into 18
low, intermediate and high-risk groups (higher prognostic score deemed higher risk) 19
and a log-rank test evaluated significant differences in OS. The number of patients 20
that changed risk stratification group depending on the segmentation method used 21
was calculated, and the OS for the different risk groups between models was 22
analysed. A p-value of < 0.05 was considered statistically significant. Statistical 23
analysis was performed using SAS version 9.4 (SAS, North Carolina, USA) and 24
SPSS version 23.0 (IBM, Chicago, USA). Imaging data, software and delineated 25
MTV’s are not available publicly. 26
27
Results 28
Four hundred and seventy-two patients, each with 9 MTV contours delineated by AT, 29
FCM2, GCM3, GCM4, KM2, KM3, KM4, RG and WT PET segmentation methods 30
were assessed by a Clinical Radiologist with five-years research experience for 31
accurate tumour representation. Forty-five patients and 5 segmentation methods 32
were excluded due to poor MTV delineation. FCM2 failed to delineate an acceptable 33
tumour representation in 145 (30.8%) of cases. KM3 and KM4 failed in 88 (18.6%) 1
and 215 (45.6%) of cases, respectively. RG failed in 389 (82.5%), and GCM4 in 33 2
(7%) of cases. Therefore, 427 cases with MTV’s delineated with KM2, GCM3, AT 3
and WT PET segmentation methods deemed to have accurate tumour 4
representation and included for further analysis. 5
6
The 427 cases included for analysis were used to develop the prognostic models for 7
KM2, WT, GCM3 and AT methods. Baseline characteristics of patients are detailed 8
in Table 3. The median OS of the cohort was 17.0 months (95% confidence interval 9
(95% CI) 14.8-19.2). Median follow-up was 35.0 months (95% CI 28.7-41.3). Overall 10
1- and 2-year survival in the development cohort was 65.3% and 30.1%, 11
respectively. 12
13 14
Table 3: Baseline characteristics of patient cohort
15
Median age 67.0 year (range 24-84)
Gender Male 315 (73.8): Female 112 (26.2)
Histology
Adenocarcinoma
Squamous Cell Carcinoma Undifferentiated
High-grade Dysplasia Neuro-endocrine Small Cell Carcinoma Sarcoma 313 (73.3) 100 (23.4) 5 (1.2) 4 (0.9) 3 (0.7) 1 (0.2) 1 (0.2) Tumour Location Oesophagus Upper third Middle third Lower Third Gastro-oesophageal junction Siewert I Siewert II 268 (62.8) 14 (5.2) 71 (26.5) 183 (68.3) 159 (37.2) 67 (42.1) 42 (26.4)
Siewert III 50 (31.4) Stage Group IA IB IIA IIB IIIA IIIB IIIC IV 10 (2.3) 17 (4.0) 70 (16.4) 13 (3.0) 97 (22.7) 52 (12.2) 76 (17.8) 92 (21.5) Treatment Curative NACT dCRT Surgery Alone NACRT EMR Palliative 224 (52.5) 86 (38.4) 86 (38.4) 31 (13.8) 20 (8.9) 1 (0.5) 203 (47.5) Mortality Alive Dead 132 (30.9) 295 (69.1) 1 2
Development of Prognostic Models 3
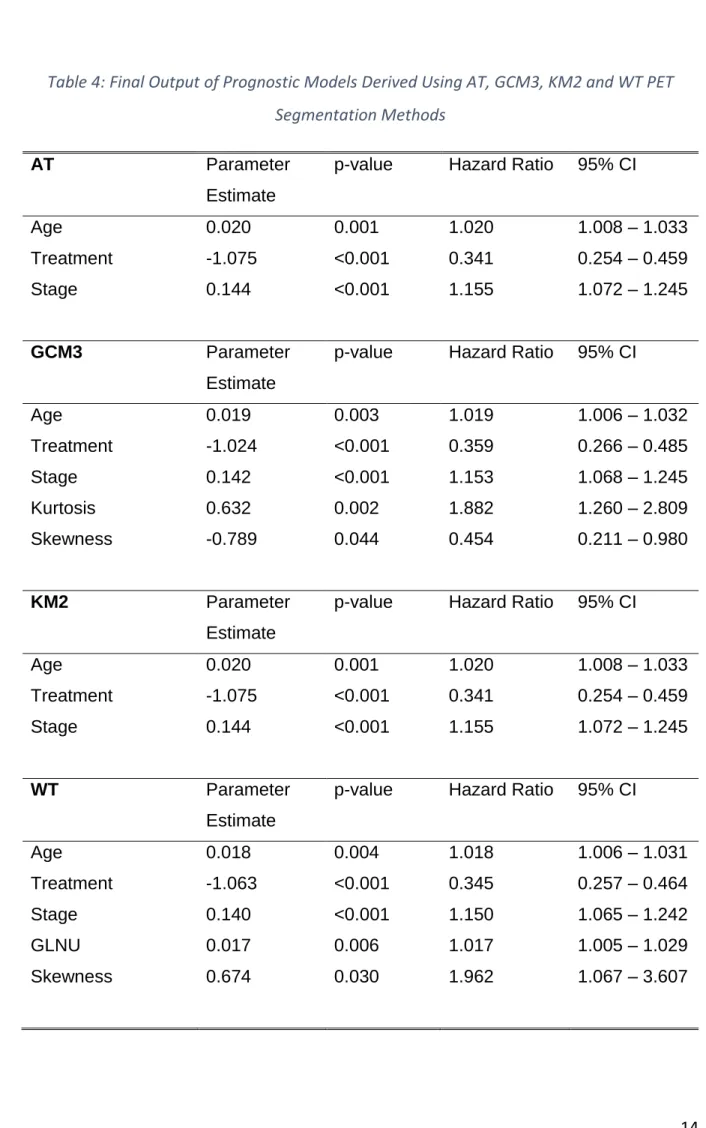
The final steps of each prognostic model are presented in Table 4. Three known 4
clinical prognostic factors (age, radiological stage and treatment) remained in each 5
derived model, but there was a difference in the inclusion of texture metrics by 6
segmentation technique. AT and KM2 produced the same model output. 7
Interestingly, IBSI metrics were not included in the final models for these 8
segmentation methods. However, skewness and kurtosis were independently 9
significant for survival using GCM3 method. Skewness and GLNU were significant 10
using WT method. Their inclusion in the models illustrates their additional prognostic 11
value compared with current prognostic factors. 12
1
Table 4: Final Output of Prognostic Models Derived Using AT, GCM3, KM2 and WT PET
2
Segmentation Methods
3
AT Parameter
Estimate
p-value Hazard Ratio 95% CI
Age 0.020 0.001 1.020 1.008 – 1.033
Treatment -1.075 <0.001 0.341 0.254 – 0.459
Stage 0.144 <0.001 1.155 1.072 – 1.245
GCM3 Parameter
Estimate
p-value Hazard Ratio 95% CI
Age 0.019 0.003 1.019 1.006 – 1.032 Treatment -1.024 <0.001 0.359 0.266 – 0.485 Stage 0.142 <0.001 1.153 1.068 – 1.245 Kurtosis 0.632 0.002 1.882 1.260 – 2.809 Skewness -0.789 0.044 0.454 0.211 – 0.980 KM2 Parameter Estimate
p-value Hazard Ratio 95% CI
Age 0.020 0.001 1.020 1.008 – 1.033
Treatment -1.075 <0.001 0.341 0.254 – 0.459
Stage 0.144 <0.001 1.155 1.072 – 1.245
WT Parameter
Estimate
p-value Hazard Ratio 95% CI
Age 0.018 0.004 1.018 1.006 – 1.031 Treatment -1.063 <0.001 0.345 0.257 – 0.464 Stage 0.140 <0.001 1.150 1.065 – 1.242 GLNU 0.017 0.006 1.017 1.005 – 1.029 Skewness 0.674 0.030 1.962 1.067 – 3.607 4 5
Prognostic Score Calculation 1
The equations for each model derived from different segmentation methods were 2
used to calculate the prognostic scores, and are listed in Table 5. These calculations 3
were derived using published methods [42]. 4
5
Table 5: Prognostic model equations
6
Segmentation Method
Prognostic Model Equation
AT (Age * 0.020) - (Treatment * 1.075) + (Stage * 0.144)
GCM3 (Age * 0.019) - (Treatment * 1.024) + (Stage * 0.142) - (Skewness * 0.789) + (Kurtosis * 0.632)
KM2 (Age * 0.020) - (Treatment * 1.075) + (Stage * 0.144)
WT (Age * 0.018) - (Treatment * 1.063) + (Stage * 0.140) + (Skewness * 0.674) + (GLNU * 0.017)
7 8
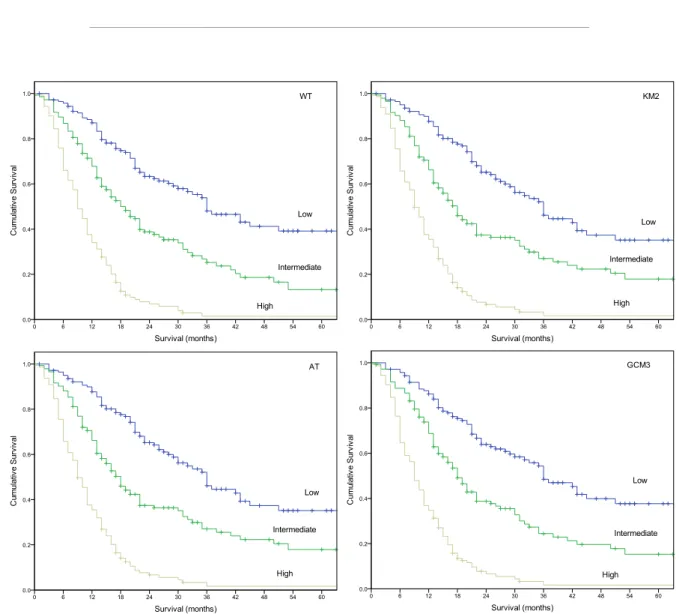
Figure 1 shows the risk stratification for WT, KM2, AT, and GCM3. Median OS for 9
the low risk, intermediate risk and high-risk group in the AT and KM2 derived 10
prognostic model was 36.0 months (29.9-42.1 months), 18.0 months (15.1-20.9 11
months) and 9.0 months (7.8-10.2 months) respectively. Median OS for the low risk, 12
intermediate risk and high-risk group in the GCM3 derived prognostic model was 13
36.0 months (28.8 - 43.2 months), 18.0 months (15.4 - 20.6 months) and 9.0 months 14
(7.7-19.2 months). Median OS for the WT derived prognostic model low risk, 15
intermediate and high-risk groups was 36 months (27.8-44.2 months), 19 months 16
(15.1-23 months) and OS for the high-risk group was 9 months (7.7-10.3 months) 17
respectively. Table 6 shows the number of patients stratified as low, intermediate 18
and high risk for each single prognostic model along with the prognostic score range 19
for each risk stratification group. Table 7 shows the number of patients whom 20
1
The largest proportion of patients to change risk stratification group was between 2
prognostic models based on GCM3 and on WT (n=73, 17.1%). It can be noted that 3
no patient changed risk stratification group between AT and KM2 because the 4
prognostic models were identical. The number of concordant patients stratified as 5
low, intermediate and high-risk across the developed models was 118 (28%), 95 6
(22%) and 116 (27%) respectively. There was no overall survival difference between 7
AT, GCM3, KM2 or WT low-risk groups (X2 0.052, df 3, p=0.997), intermediate-risk
8
groups (X2 0.016, df 3, p=0.999) or high-risk groups (X2 0.028, df 3, p=0.999).
9 10
For interest, supplementary data A describes the developed prognostic models for 11
the excluded PET-AS methods. Supplementary data B describes variances in 12
radiomic features extracted using differing discretisation methodologies, which is an 13
important consideration in radiomic studies. Supplementary data C describes the 14
correlation of MTV with the extracted radiomic features. 15
16
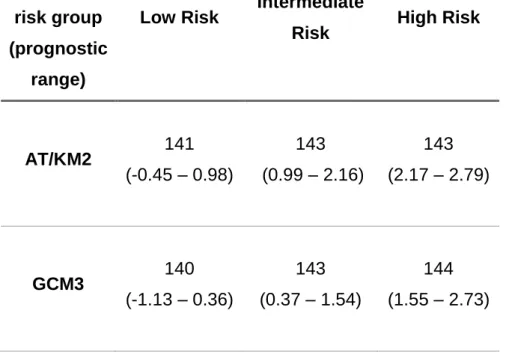
Table 6: Number of patients in each risk stratification group for each single prognostic model
17
and prognostic score range
18 number of patients in risk group (prognostic range)
Low Risk Intermediate
Risk High Risk
AT/KM2 141 (-0.45 – 0.98) 143 (0.99 – 2.16) 143 (2.17 – 2.79) GCM3 140 (-1.13 – 0.36) 143 (0.37 – 1.54) 144 (1.55 – 2.73)
WT 142 (-0.17 – 1.30) 144 (1.31 – 2.48) 141 (2.49-3.62) 1 2
1
Table 7: Total number of patients and percentage that change risk-stratification group
2 Number changing group (%) AT GCM3 KM2 WT AT GCM3 66 (15.4) KM2 0 (0.0) 66 (15.4) WT 57 (13.3) 73 (17.1) 57 (13.3) 3 4 Discussion 5
Radiomic research aims to improve the prediction of patient outcome through the 6
extraction of additional data from medical images. However, numerous challenges with 7
the extraction of radiomic features have been highlighted [10]. Selection of significant 8
features for prognostic models is of considerable importance because external 9
parameters such as delineation method and image reconstruction parameters affect 10
reproducibility and robustness of these features [14,43]. 11
1
In this study, first, second and higher-order radiomic features were extracted from each 2
of the PET-AS delineations. The significant variables in the developed prognostic 3
models were dependent upon the delineation method. In the GCM3 based prognostic 4
models, first-order features Kurtosis and Skewness were found to be significant 5
predictors of survival. However, higher-order feature GLNU was found to be of 6
significance in combination with the first-order feature Skewness in the WT based 7
prognostic model. For the AT and KM2 based prognostic models, radiomic features 8
were not found to be significant predictors of survival in comparison to the currently 9
known predictors such as clinical stage and age. This highlights the dependency of 10
significant PET radiomic variables on segmentation method. 11
12
Our findings demonstrate the potential impact of different segmentation methods for 13
prognostic models using standardised implementations of radiomic features within 14
clinical practice. Patients may be assigned different risk stratification groups depending 15
on the segmentation method used in the process of developing the prognostic model. 16
This could lead to sub-groups of patients receiving a more aggressive treatment than is 17
necessary, leading to decreased quality of life. Furthermore, patients could potentially 18
be denied beneficial treatment. 19
20
Nine segmentation methods were included in this study, with 5 being excluded from 21
analysis after being reviewed by a radiologist. These methods were excluded due to 22
poor tumour representation in a number of cases. In supplementary data A, the 23
prognostic models developed from PET-AS methods that were excluded from the study 24
are described. Interestingly, the excluded PET-AS methods FCM2, KM3, KM4 and RG 25
developed identical prognostic models to the included methods AT and KM2. This 26
suggests that whilst radiomic features are dependent upon the delineation method, this 27
may be unrelated to the delineation method considered acceptable by a radiologist. 28
29
It has been reported that the accuracy of the segmentation delineation of the MTV is 30
dependent upon tumour characteristics [9,21,24]. GCM based segmentation methods 31
have been shown to have limited performance in low TBR scenarios [24]. Furthermore, 1
clustering methods such as FCM are highly dependent upon the heterogeneity of the 2
tumour volumes. In homogeneous regions with low TBR’s the iterative process of FCM 3
has been shown to overestimate the tumour volume [29]. Statistical based 4
segmentation algorithms such as RG compare adjoining voxel intensities. If the voxels 5
are of similar intensities they are included within the volume [44]. However, the 6
performance of statistical based RG segmentation algorithms in highly heterogeneous 7
tumour volumes is degraded. Moreover, the performance of RG is dependent upon the 8
defined stopping criteria. In our study, the RG algorithm stopped voxel inclusion when 9
after an iteration no more than 5% of the total number of voxels already defined as the 10
MTV were included. This stopping criteria has been reported to be limited in complex 11
tumours [24]. 12
13
This study used radiomic data derived using SUV bins of 0.5 units. In supplementary 14
data B, the variance of radiomic features derived using different discretisation methods 15
is shown but lies outside the scope of this study, so further analysis was not performed. 16
Future work could investigate how different discretisation methods influences the 17
significance of radiomic features in the development of prognostic models and 18
subsequent impact on risk stratification in patients with OC. 19
20
The variability in segmentation performance in any one single clinical case means the 21
standardisation of the delineation of the MTV is critical for the application of radiomics 22
within OC. This supports the recommendations of the International Atomic Energy 23
Agency (IAEA) whom state that there are no validated quantitative approaches for PET 24
contouring that will result in ideal tumor delineation for all patients and tumor locations 25
[45]. In addition, the American Association of Physicist in Medicine (AAPM) Task Group 26
No 211 reported could not recommend a single PET auto segmentation method for 27
MTV delineation. However, machine learned segmentation methods have showed 28
promise for accurate MTV delineation [9]. Machine learned based and consensus based 29
segmentation methodologies have been proposed for the standardisation of the 30
delineation of the MTV [20,46,47]. In supplementary data C, radiomic features derived 31
from each segmentation method were correlated with MTV. As described, GLNU, 1
Energy and Coarseness were correlated with MTV for all PET segmentation methods. 2
However, the level of correlation varied between PET-AS methods. Our study suggests 3
that a standardised segmentation methodology should be used for the development of 4
prognostic models. 5
6
Shape metrics can also be quantified from the primary tumour. Within this group of 7
radiomic features, the surface to volume ratio (S2VR), sphere to volume ratio, 8
compactness, sphericity and disproportion of the tumour can be characterised but have 9
not been included in this study which focused on intra-tumoural heterogeneity. 10
However, studies have investigated the inclusion of shape metrics in prognostic models 11
[48]. 12
13
The results of this study are strengthened by the large cohort (n=427) of OC patients 14
with contours assessed and approved by a clinical radiologist. The approach of 15
controlling model development by using identical clinical data and standardised image 16
features ensured that differences in risk stratification were due to the image 17
segmentation method. In this study, we did not use any PET image interpolation 18
algorithm before image feature analysis [41]. This approach however, is consistent with 19
currently reported studies. 20
21
Conclusion 22
Prognostic models incorporating quantitative image features are dependent on the 23
method used to delineate the primary tumour. This has a subsequent effect on risk 24
stratification, with patients changing groups depending on the image segmentation 25
method used. The standardisation of PET segmentation is important and should be 26
considered in future prognostic and predictive clinical models. The findings of this study 27
may have substantial potential impact on clinical management of patients with OC. 28
Declarations 1
Ethics approval and Consent to participate: All procedures performed in studies
2
involving human participants were in accordance with the ethical standards of the
3
instituitional and/or national research committee and with the 1964 Helsinki declaration
4
and its later amendments or comparable ethical standards. Institutional Review Board
5
approval was granted and requirement for informed consent was waived. 6
7
Consent for publication: Not Applicable.
8 9
Avaliability of data and material: Please contact author for data requests.
10 11
Funding: This work was partially funded by EPSRC-DTP grant ref EP/M507842/1,
12
Velindre NHS Trust grant Number 2016/1 and Tenovus Cancer Care (TIG2016/04).
13 14
Authors’s contributions: CP Concieved the study, participated in data collection and
15
drafted the manuscript. KF participated in data collection, analysis of results and helped
16
draft the manuscript. PW participated in data collection. RH helped with statistical
17
metholodogy and analysis of results. AR Participated in the design of the study and 18
helped draft the manuscript. CM participated in the design of the study and helped draft 19
the manuscript. JS participated in the design of the study and helped draft the 20
manuscript. ES participated in the design of the study, helped draft the manuscript, 21
and coordinated the study. All authors read and approved the final manuscript. 22
23
Acknowledgements: Not Applicable.
24 25
Competing Interests: The authors declare they have no competing interests.
References 1
2
[1] Oesophageal cancer survival statistics | Cancer Research UK. Oesophageal 3
Cancer Surviv Stat Read More Http//www.cancerresearchuk.org/health-4 Professional/cancer-Statistics/statistics-by-Cancer-Type/oesophageal-5 cancer/survival#Ftcako2Wk3QIZMFX99 2014. 6 http://www.cancerresearchuk.org/health-professional/cancer-statistics/statistics-7
by-cancer-type/oesophageal-cancer/survi (accessed March 15, 2017). 8
[2] Teoh AYB, Chiu PWY, Yeung WK, Liu SYW, Wong SKH, Ng EKW. Long-term 9
survival outcomes after definitive chemoradiation versus surgery in patients with 10
resectable squamous carcinoma of the esophagus: Results from a randomized 11
controlled trial. Ann Oncol 2013;24:165–71. doi:10.1093/annonc/mds206. 12
[3] Corvò R. Evidence-based radiation oncology in head and neck squamous cell 13
carcinoma. Radiother Oncol 2007;85:156–70. doi:10.1016/j.radonc.2007.04.002. 14
[4] Moons KGM, Altman DG, Vergouwe Y, Royston P. Prognosis and prognostic 15
research: application and impact of prognostic models in clinical practice. BMJ 16
2009;338:b606. doi:10.1136/bmj.b606. 17
[5] Vallieres M, Zwanenburg A, Badic B, Cheze-Le Rest C, Visvikis D, Hatt M. 18
Responsible Radiomics Research for Faster Clinical Translation. J Nucl Med 19
2017:jnumed.117.200501. doi:10.2967/jnumed.117.200501. 20
[6] Hatt M, Majdoub M, Vallières M, Tixier F, Cheze-Le Rest C, Groheux D, et al. 21
18F-FDG PET Uptake Characterization Through Texture Analysis: Investigating 22
the Complementary Nature of Heterogeneity and Functional Tumor Volume in a 23
Multi–Cancer Site Patient Cohort. J Nucl Med 2015;56:38–44. 24
doi:10.2967/jnumed.114.144055. 25
[7] Yue Y, Osipov A, Fraass B, Sandler H, Zhang X, Nissen N, et al. Identifying 26
prognostic intratumor heterogeneity using pre- and post-radiotherapy 18F-FDG 27
PET images for pancreatic cancer patients. J Gastrointest Oncol 2017;8:127–38. 28
doi:10.21037/jgo.2016.12.04. 29
[8] Zaidi H, El Naqa I. PET-guided delineation of radiation therapy treatment 30
Imaging 2010;37:2165–87. doi:10.1007/s00259-010-1423-3. 1
[9] Hatt M, Lee JA, Schmidtlein CR, El Naqa I, Caldwell C, De Bernardi E, et al. 2
Classification and evaluation strategies of auto-segmentation approaches for 3
PET: Report of AAPM task group No. 211. Med Phys 2017;44:e1–42. 4
doi:10.1002/mp.12124. 5
[10] Hatt M, Tixier F, Pierce L, Kinahan PE, Le Rest CC, Visvikis D. Characterization 6
of PET/CT images using texture analysis: the past, the present… any future? Eur 7
J Nucl Med Mol Imaging 2017;44:151–65. doi:10.1007/s00259-016-3427-0. 8
[11] Yip SSF, Aerts HJWL. Applications and limitations of radiomics. Phys Med Biol 9
2016;61:R150-66. doi:10.1088/0031-9155/61/13/R150. 10
[12] Hatt M, Tixier F, Cheze Le Rest C, Pradier O, Visvikis D. Robustness of 11
intratumour 18F-FDG PET uptake heterogeneity quantification for therapy 12
response prediction in oesophageal carcinoma. Eur J Nucl Med Mol Imaging 13
2013;40:1662–71. doi:10.1007/s00259-013-2486-8. 14
[13] Ben Bouallègue F, Tabaa Y Al, Kafrouni M, Cartron G, Vauchot F, Mariano-15
Goulart D. Association between textural and morphological tumor indices on 16
baseline PET-CT and early metabolic response on interim PET-CT in bulky 17
malignant lymphomas. Med Phys 2017;44:4608–19. doi:10.1002/mp.12349. 18
[14] Hatt M, Laurent B, Fayad H, Jaouen V, Visvikis D, Le Rest CC. Tumour functional 19
sphericity from PET images: prognostic value in NSCLC and impact of delineation 20
method. Eur J Nucl Med Mol Imaging 2017. doi:10.1007/s00259-017-3865-3. 21
[15] Foley KG, Hills RK, Berthon B, Marshall C, Parkinson C, Lewis WG, et al. 22
Development and validation of a prognostic model incorporating texture analysis 23
derived from standardised segmentation of PET in patients with oesophageal 24
cancer. Eur Radiol 2018;28:428–36. doi:10.1007/s00330-017-4973-y. 25
[16] Sobin L, Gospodarowicz, MK Wittekind C. UICC. TNM Classification of Malignant 26
Tumours. New York: Wiley; 2009. 27
[17] Vinod SK, Min M, Jameson MG, Holloway LC. A review of interventions to reduce 28
inter-observer variability in volume delineation in radiation oncology. J Med 29
Imaging Radiat Oncol 2016;60:393–406. doi:10.1111/1754-9485.12462. 30
[18] Jiang J, Wu H, Huang M, Wu Y, Wang Q, Zhao J, et al. Variability of Gross Tumor 31
Volume in Nasopharyngeal Carcinoma Using 11C-Choline and 18F-FDG PET/CT. 1
PLoS One 2015;10:e0131801. doi:10.1371/journal.pone.0131801. 2
[19] Greco C, Rosenzweig K, Cascini GL, Tamburrini O. Current status of PET/CT for 3
tumour volume definition in radiotherapy treatment planning for non-small cell 4
lung cancer (NSCLC). Lung Cancer 2007;57:125–34. 5
doi:10.1016/j.lungcan.2007.03.020. 6
[20] Schaefer A, Vermandel M, Baillet C, Dewalle-Vignion AS, Modzelewski R, Vera P, 7
et al. Impact of consensus contours from multiple PET segmentation methods on 8
the accuracy of functional volume delineation. Eur J Nucl Med Mol Imaging 9
2016;43:911–24. doi:10.1007/s00259-015-3239-7. 10
[21] Xu W, Yu S, Ma Y, Liu C, Xin J. Effect of different segmentation algorithms on 11
metabolic tumor volume measured on 18F-FDG PET/CT of cervical primary 12
squamous cell carcinoma. Nucl Med Commun 2017;38:259–65. 13
doi:10.1097/MNM.0000000000000641. 14
[22] Orlhac F, Soussan M, Maisonobe J-AJ-A, Garcia CA, Vanderlinden B, Buvat I. 15
Tumor Texture Analysis in 18F-FDG PET: Relationships Between Texture 16
Parameters, Histogram Indices, Standardized Uptake Values, Metabolic Volumes, 17
and Total Lesion Glycolysis. J Nucl Med 2014;55:414–22. 18
doi:10.2967/jnumed.113.129858. 19
[23] van Velden FHP, Kramer GM, Frings V, Nissen IA, Mulder ER, de Langen AJ, et 20
al. Repeatability of Radiomic Features in Non-Small-Cell Lung Cancer [18F]FDG-21
PET/CT Studies: Impact of Reconstruction and Delineation. Mol Imaging Biol 22
2016;18:788–95. doi:10.1007/s11307-016-0940-2. 23
[24] Berthon B, Marshall C, Evans M, Spezi E. Evaluation of advanced automatic PET 24
segmentation methods using nonspherical thin-wall inserts. Med Phys 25
2014;41:22502. doi:10.1118/1.4863480. 26
[25] Jentzen W, Freudenberg L, Eising EG, Heinze M, Brandau W, Bockisch A. 27
Segmentation of PET volumes by iterative image thresholding. J Nucl Med 28
2007;48:108–14. 29
[26] Drever L, Roa W, McEwan A, Robinson D. Iterative threshold segmentation for 30
PET target volume delineation. Med Phys 2007;34:1253–65. 31
doi:10.1118/1.2712043. 1
[27] Day E, Betler J, Parda D, Reitz B, Kirichenko A, Mohammadi S, et al. A region 2
growing method for tumor volume segmentation on PET images for rectal and 3
anal cancer patients. Med Phys 2009;36:4349–58. doi:10.1118/1.3213099. 4
[28] Belhassen S, Zaidi H. A novel fuzzy C-means algorithm for unsupervised 5
heterogeneous tumor quantification in PET. Med Phys 2010;37:1309–24. 6
doi:10.1118/1.3301610. 7
[29] Hatt M, Cheze le Rest C, Turzo A, Roux C, Visvikis D. A Fuzzy Locally Adaptive 8
Bayesian Segmentation Approach for Volume Determination in PET. IEEE Trans 9
Med Imaging 2009;28:881–93. doi:10.1109/TMI.2008.2012036. 10
[30] Geets X, Lee JA, Bol A, Lonneux M, Grégoire V. A gradient-based method for 11
segmenting FDG-PET images: Methodology and validation. Eur J Nucl Med Mol 12
Imaging 2007;34:1427–38. doi:10.1007/s00259-006-0363-4. 13
[31] Tylski P, Bonniaud G, Decenciere E, Stawiaski J, Coulot J, Lefkopoulos D, et al. 14
18F-FDG PET images segmentation using morphological watershed: a phantom 15
study. 2006 IEEE Nucl. Sci. Symp. Conf. Rec., vol. 4, IEEE; 2006, p. 2063–7. 16
doi:10.1109/NSSMIC.2006.354319. 17
[32] Leijenaar RTH, Nalbantov G, Carvalho S, van Elmpt WJC, Troost EGC, Boellaard 18
R, et al. The effect of SUV discretization in quantitative FDG-PET Radiomics: the 19
need for standardized methodology in tumor texture analysis. Sci Rep 20
2015;5:11075. doi:10.1038/srep11075. 21
[33] Davies AR, Gossage JA, Zylstra J, Mattsson F, Lagergren J, Maisey N, et al. 22
Tumor stage after neoadjuvant chemotherapy determines survival after surgery 23
for adenocarcinoma of the esophagus and esophagogastric junction. J Clin Oncol 24
2014;32:2983–90. doi:10.1200/JCO.2014.55.9070. 25
[34] Tixier F, Le Rest CC, Hatt M, Albarghach N, Pradier O, Metges J-P, et al. 26
Intratumor Heterogeneity Characterized by Textural Features on Baseline 18F-27
FDG PET Images Predicts Response to Concomitant Radiochemotherapy in 28
Esophageal Cancer. J Nucl Med 2011;52:369–78. 29
doi:10.2967/jnumed.110.082404. 30
[35] Yip C, Landau D, Kozarski R, Ganeshan B, Thomas R, Michaelidou A, et al. 31
Primary Esophageal Cancer: Heterogeneity as Potential Prognostic Biomarker in 1
Patients Treated with Definitive Chemotherapy and Radiation Therapy. Radiology 2
2014;270:141–8. doi:10.1148/radiol.13122869. 3
[36] Doumou G, Siddique M, Tsoumpas C, Goh V, Cook GJ. The precision of textural 4
analysis in 18F-FDG-PET scans of oesophageal cancer. Eur Radiol 5
2015;25:2805–12. doi:10.1007/s00330-015-3681-8. 6
[37] Gillies RJ, Kinahan PE, Hricak H. Radiomics: Images Are More than Pictures, 7
They Are Data. Radiology 2016;278:563–77. doi:10.1148/radiol.2015151169. 8
[38] Yip C, Davnall F, Kozarski R, Landau DB, Cook GJR, Ross P, et al. Assessment 9
of changes in tumor heterogeneity following neoadjuvant chemotherapy in primary 10
esophageal cancer. Dis Esophagus 2015;28:172–9. doi:10.1111/dote.12170. 11
[39] Nakajo M, Jinguji M, Nakabeppu Y, Nakajo M, Higashi R, Fukukura Y, et al. 12
Texture analysis of 18F-FDG PET/CT to predict tumour response and prognosis 13
of patients with esophageal cancer treated by chemoradiotherapy. Eur J Nucl 14
Med Mol Imaging 2017;44:206–14. doi:10.1007/s00259-016-3506-2. 15
[40] Amadasun M, King R. Textural Features Corresponding to Texural Properties. 16
IEEE Trans Syst Man Cybern 1989;19:1264–74. doi:10.1109/21.44046. 17
[41] Depeursinge A, Foncubierta-Rodriguez A, Van De Ville D, Müller H. Three-18
dimensional solid texture analysis in biomedical imaging: Review and 19
opportunities. Med Image Anal 2014;18:176–96. 20
doi:10.1016/j.media.2013.10.005. 21
[42] Moons KGM, Kengne AP, Woodward M, Royston P, Vergouwe Y, Altman DG, et 22
al. Risk prediction models: I. Development, internal validation, and assessing the 23
incremental value of a new (bio)marker. Heart 2012;98:683–90. 24
doi:10.1136/heartjnl-2011-301246. 25
[43] Apostolova I, Rogasch J, Buchert R, Wertzel H, Achenbach HJ, Schreiber J, et al. 26
Quantitative assessment of the asphericity of pretherapeutic FDG uptake as an 27
independent predictor of outcome in NSCLC. BMC Cancer 2014;14:1–10. 28
doi:10.1186/1471-2407-14-896. 29
[44] Monteiro ALR, Machado AMC, Lewer MHM. A Multicriteria Method for Cervical 30
Tumor Segmentation in Positron Emission Tomography. 2014 IEEE 27th Int. 31
Symp. Comput. Med. Syst., IEEE; 2014, p. 205–8. doi:10.1109/CBMS.2014.52. 1
[45] Konert T, Vogel W, MacManus MP, Nestle U, Belderbos J, Grégoire V, et al. 2
PET/CT imaging for target volume delineation in curative intent radiotherapy of 3
non-small cell lung cancer: IAEA consensus report 2014. Radiother Oncol 4
2015;116:27–34. doi:10.1016/j.radonc.2015.03.014. 5
[46] Berthon B, Marshall C, Evans M, Spezi E. ATLAAS: An automatic decision tree-6
based learning algorithm for advanced image segmentation in positron emission 7
tomography. Phys Med Biol 2016;61:4855–69. doi:10.1088/0031-8
9155/61/13/4855. 9
[47] Berthon B, Evans M, Marshall C, Palaniappan N, Cole N, Jayaprakasam V, et al. 10
Head and neck target delineation using a novel PET automatic segmentation 11
algorithm. Radiother Oncol 2017;122:242–7. doi:10.1016/j.radonc.2016.12.008. 12
[48] Desseroit MC, Visvikis D, Tixier F, Majdoub M, Perdrisot R, Guillevin R, et al. 13
Development of a nomogram combining clinical staging with18F-FDG PET/CT 14
image features in non-small-cell lung cancer stage I–III. Eur J Nucl Med Mol 15
Imaging 2016;43:1477–85. doi:10.1007/s00259-016-3325-5. 16