Policy Research Working Paper
5180
Potential Benefits and Risks of Increased
Aid Flows to Burundi
Hannah Nielsen
Dorsati Madani
The World Bank
Africa Region
Poverty Reduction and Economic Management
January 2010
WPS5180
Public Disclosure Authorized
Public Disclosure Authorized
Public Disclosure Authorized
Abstract
The Policy Research Working Paper Series disseminates the findings of work in progress to encourage the exchange of ideas about development issues. An objective of the series is to get the findings out quickly, even if the presentations are less than fully polished. The papers carry the names of the authors and should be cited accordingly. The findings, interpretations, and conclusions expressed in this paper are entirely those of the authors. They do not necessarily represent the views of the International Bank for Reconstruction and Development/World Bank and its affiliated organizations, or those of the Executive Directors of the World Bank or the governments they represent.
Policy Research Working Paper 5180
Burundi has experienced a significant increase in aid flows in recent years. Currently, about half of the budget is funded by aid, mostly grants. The high external assistance has, however, not yet translated into high and sustainable growth rates. This paper analyzes (i) the policy response of the government to the aid surge and its impact on macroeconomic variables; and (ii) the allocation of external assistance and its implications for growth. Since not all aid affects economic development in the same way, aid disbursements are disaggregated by sector as well as by their lag in impacting growth. The analysis shows that Burundi has mostly spent and absorbed increased aid flows, but has until now not suffered significantly from the possible negative effects of an appreciating exchange rate and the related loss of competitiveness, but the possibility of a Dutch disease effect remains a risk. The country’s low growth performance, despite high aid inflows, is not necessarily
This paper—a product of the Poverty Reduction and Economic Management, Africa Region—is part of a series of background papers prepared for the Country Economic Memorandum for Burundi. Policy Research Working Papers are also posted on the Web at http://econ.worldbank.org. The authors may be contacted at [email protected] and [email protected].
a sign that aid is ineffective or exceeding Burundi’s absorptive capacity. It reflects that a large share of aid has been allocated to either humanitarian and emergency aid or long-run growth enhancing sectors. Therefore, the lagged impact of aid on economic growth is not yet visible. Furthermore, the composition of the domestically financed budget is biased toward recurrent spending, and therefore not directly growth enhancing. In addition, low and often unpredictable aid disbursement ratios aggravate the bias away from investment and toward government consumption. To boost short-term growth, the share of aid allocated to productive sectors, such as agriculture and the supporting infrastructure, needs to be increased. Firm commitments and timely disbursements of aid by donors are essential and the Government of Burundi needs to strengthen its capacity and mechanisms for donor coordination.
Potential benefits and risks of
increased aid flows to Burundi
Hannah Nielsen
Dorsati Madani
**
The authors would like to thank Jan Walliser and other colleagues from AFTP3 for valuable input. The authors would also like to thank participants of a workshop on the Burundi Country Economic Memorandum in Bujumbura in July 2009 for helpful comments and suggestions. The views, findings and conclusions expressed in this paper are entirely those of the authors and do not necessarily reflect those of the World Bank, its Executive Board, or member country governments. Corresponding author: Hannah Nielsen, email: [email protected].
Table of Contents
1.
Introduction ... 3
2.
Rebuilding Burundi ... 3
2.1.
Political and institutional realities ... 3
2.2.
The economy ... 4
3.
Burundi’s policy response to increased aid flows ... 5
3.1.
The impact of increased aid flows – analytical framework ... 5
3.2.
Aid flows to Burundi ... 7
3.3.
Absorption and spending in Burundi ... 9
3.4.
Effect on trade and competitiveness ... 11
4.
Allocation of increased aid and impact on growth ... 12
4.1.
The effect of aid on growth – theoretical background ... 12
4.2.
Allocation of aid to Burundi ... 14
4.3.
Impact of aid on growth in Burundi ... 15
4.4.
Predictability of aid in Burundi... 19
5.
Conclusions and policy implications ... 20
References ... 21
A.
Appendix ... 23
A.1.
Selected economic indicators ... 23
A.2.
Detailed data: Absorption and spending ... 23
1. Introduction
Burundi has experienced a significant increase in aid inflows since the Arusha peace agreement in 2000. About half of the budget is funded by external assistance, mostly grants, and net aid flows reached almost 35 percent of GDP in 2008. The high external financing has, however, not yet translated into higher growth; the average growth rate of real GDP has been only 3.0 percent between 2001 and 2008 and GDP even declined by 0.3 percent in real per capita terms. The objective of this paper is twofold, (i) to examine the impact of the aid surge on macroeconomic variables as well as the government policy response; and (ii) to understand why the increased aid has not yet noticeably enhanced growth. The findings will help the Government and the donor community to adjust the policy response and redirect funds to different sectors if needed.
First, we analyze the policy response of the Burundi government to the aid surge. A country receiving large amounts of aid is susceptible to a loss of competitiveness caused by an appreciating real exchange rate. The impact, however, depends on the characteristics of the country as well as on its policy response, i.e. whether aid has been absorbed, spent, or both. This paper therefore examines the absorption and spending pattern during the aid surge period as well as the impact of increased aid flows on macroeconomic variables with special emphasis on exchange rates, exports and the competitiveness (as defined by real effective exchange rate changes) of Burundi.
In a second step, we analyze the allocation of external aid and its implication on growth. Aid disbursements are disaggregated by sector as well as by their lag in impacting growth. Not all aid affects economic development in the same way. Humanitarian and emergency aid can be negatively correlated with growth, as it is usually disbursed in times of crisis. Aid allocated to health and education contributes to growth in the long term through building of human capital. Infrastructure spending facilitates growth in the short term by reducing production and commercialization costs related to transport, electricity and water use. We use this concept to categorize aid disbursements to Burundi and understand their impact on growth performance. We also discuss the low predictability of aid and its effect on Burundi’s expenditure composition. Our analysis shows that Burundi has mostly spent and absorbed increased aid flows, but has not suffered significantly from the possible negative effects of an appreciating exchange rate and the related loss of competitiveness. The country’s low growth performance, despite high aid inflows, is not necessarily a sign that aid is ineffective, but rather reflects that a large share of aid has been allocated to either humanitarian and emergency aid or long-run growth enhancing sectors and that the lagged impact of aid on economic growth is not yet visible. Furthermore, the composition of the domestically financed budget is biased towards recurrent spending, mainly wages and salaries, and therefore not directly growth enhancing. In addition, low and often unpredictable disbursement ratios aggravate the bias away from investment and towards government consumption.
2. Rebuilding Burundi
2.1. Political and institutional realities
Burundi has a history of repeated conflict since its independence in the 1960s. The latest conflict broke out in 1993 after the assassination of the first democratically elected president. In the period from 1993 until 2000, more than a million people were displaced and 250,000 killed. The
signing of the Arusha peace agreement in August 2000 marked the start of a transitional period and a successful return to democracy, as peace has slowly been restored. A three-year transitional government was formed in November 2001 and the country adopted a new constitution and held democratic elections in 2005, when a new assembly and a new president took office. Reconstruction and rehabilitation efforts began, with the peace agreements signed during this period ensuring a political balance by allocating the new signatories with ministerial and other power positions in the army, the central, provincial, and district Governments roughly in accordance with the relative political weight of the respective groups. However, these efforts were interrupted by continued political infighting during 2007 and 2008 and a deteriorating security situation related to the last rebel group (FNL) holding out on finalizing the peace process. The government and the FNL finally came to an agreement only in December 2008 and FNL started the demobilization process in the early 2009. The President of the Republic has nominated an electoral commission in advance of the 2010 parliamentary and presidential elections.
The fledgling democracy has attempted to reconstruct its legal institutions and improve its economic governance, but the distractions caused by the political tensions and continued security concerns discussed above affected the pace of reforms and as a result the expected economic recovery. Nonetheless, the authorities are reforming a host of civil and criminal laws as well as investment and commercial laws to recreate a civil infrastructure for civil life and economic activities. They have made great strides in reforming public finance management laws (organic and procurement laws) and practices to increase transparency in the budgetary process. A new Audit Court was established and is now functional. Finally, the Government is committed to an ongoing comprehensive program of reforms at the Central Bank and is adopting a number of laws and measures to improve transparency of financial transactions, including an anti-money-laundering law which is currently with the Parliament.
Nonetheless, there is reported widespread availability of arms among the civilian population. Reports suggest increasing banditry related to lack of economic opportunities and relate these events to the difficulties of reinsertion and reintegration of ex-combatants in the economic and social life of the country. This is further aggravated by the slow economic recovery (see section below). Finally, the tensions surrounding the upcoming elections have further increased the dangers to the short to medium term peace-building process and the economic stability of the country.
2.2. The economy
Burundi’s growth has been volatile since the country’s independence in 1962 affected by a number of factors, such as by political instability, annual cyclicality of agricultural production and susceptibility to external shocks (Figure 1).1 GDP per capita in real terms decreased considerably during the period of the civil conflict in the 90s and stands currently at levels it had already surpassed in the 60s, making Burundi one of the most impoverished countries in the world.
1
See Nkurunziza and Ngaruko (2002) and Nganou et al. (2007) for a more detailed description of the historical development of the economy. A table with the selected economic indicators can be found in the appendix (Table A-1).
Figure 1: Real GDP growth and GDP per capita, 1962-2007 0 20 40 60 80 100 120 140 160 180 -10% -5% 0% 5% 10% 15% 20% 25% 1962 1964 1966 1968 1970 1972 1974 1976 1978 1980 1982 1984 1986 1988 1990 1992 1994 1996 1998 2000 2002 2004 2006 C o n s ta n t 20 00 U S D
Real GDP growth rate (LHS)
GDP per capita (RHS)
Source: WDI
Burundi is a rural economy, which is dominated by agriculture with food crops as the main driver of growth. The low productivity of the agriculture sector, however, hampers its contribution. The secondary sector is the smallest sector, but its contribution is increasing. Especially the construction sector has been on the rise fueled by high aid inflows and the resulting increase in imports. The share of the services sector is increasing, reflecting a continuous increase in public services rather than the expansion of the private services.
Burundi has a very narrow export base, with exports averaging less than 10 percent of GDP over the last 10 years. The main export crops are coffee and tea, with coffee accounting for about two thirds of the export value. Imports, on the other hand, are increasing, mainly financed by the increasing level of foreign aid. Consequently, the current account deficit has been rising and Burundi remains dependent on foreign aid in the foreseeable future.
Investment levels are still low, but have recorded an upward trend, averaging 16 percent of GDP in 2005-2008, almost double the average of 2001-2004. The recovery of private investment is especially noteworthy, having risen from a very low base in 2001 (2.2 percent of GDP) to 9.2 percent of GDP in 2008. The very low level of foreign direct investment, on average less than 1 percent of GDP over the last 10 years, is an additional contributing factor to the low overall investment level and a sign that the investment climate is not attractive for foreign investors (perception of insecurity, political instability, and business environment).
3. Burundi’s policy response to increased aid flows
3.1. The impact of increased aid flows – analytical framework
While a country can greatly benefit from increased levels of aid to finance needed projects and programs, additional external assistance can also have negative effects on the real exchange rate, exports and competitiveness. The impact of an increase in aid, however, depends to a large extent
on the policy response of the country, which can be examined along two distinct concepts: absorption and spending.2
Absorption is defined as the extent to which a country’s non-aid current account deficit widens in response to increased aid flows.3 This reflects the increase in imports related to higher aid attributable both to higher direct imports by the government as well as higher imports triggered by increases in private and other government spending due to aid. The level of absorption is controlled by the central bank that decides on the amount of foreign exchange to be sold. The interest rate policy constitutes another control mechanism through its influence on aggregate demand and therefore private imports. The possible extreme cases are full absorption, where all foreign exchange associated with the aid increase is sold for domestic currency, and no absorption, implying that aid is fully used to increase the level of international reserves.
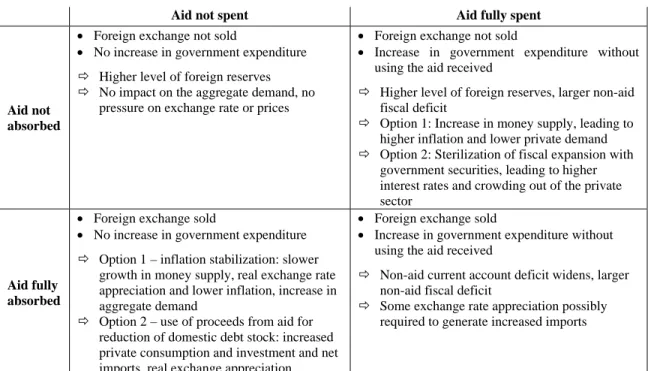
Table 1: Combinations of spending and absorption in response to increased aid
Aid not spent Aid fully spent
Aid not absorbed
Foreign exchange not sold
No increase in government expenditure Higher level of foreign reserves No impact on the aggregate demand, no
pressure on exchange rate or prices
Foreign exchange not sold
Increase in government expenditure without using the aid received
Higher level of foreign reserves, larger non-aid fiscal deficit
Option 1: Increase in money supply, leading to higher inflation and lower private demand Option 2: Sterilization of fiscal expansion with
government securities, leading to higher interest rates and crowding out of the private sector
Aid fully absorbed
Foreign exchange sold
No increase in government expenditure Option 1 – inflation stabilization: slower
growth in money supply, real exchange rate appreciation and lower inflation, increase in aggregate demand
Option 2 – use of proceeds from aid for reduction of domestic debt stock: increased private consumption and investment and net imports, real exchange appreciation
Foreign exchange sold
Increase in government expenditure without using the aid received
Non-aid current account deficit widens, larger non-aid fiscal deficit
Some exchange rate appreciation possibly required to generate increased imports
Spending is defined as the widening of the government’s non-aid fiscal deficit related to an increase in aid.4 In response to higher aid, the government can either increase expenditure, reduce taxes, or both. It can also decide not to spend the additional resources, thereby keeping the non-aid fiscal deficit unchanged. Higher non-aid-driven expenditure can be used on imports or domestically produced goods and services.
2
This section draws primarily from Gupta et al. (2006) and Berg et al. (2007).
3
Absorption= Non-aid current account deficit/Aid. An increase in aid can lead to a combination of three effects: an increase in the level of reserves, a widening of the non-aid current account deficit and an increase in non-aid capital outflows. This is based on the balance of payments identity, that current account plus capital account equal the change in foreign reserves. The non-aid current account balance is the current account balance excluding official grants and interest on public external debt and the non-aid capital account balance is the capital account balance excluding aid-related capital flows (amortization, loan disbursement etc.). For a more detailed description see Berg et al. (2007).
4
Spending = Non-aid fiscal deficit/Aid. The non-aid fiscal deficit is defined as total expenditure excluding external interest payments minus domestic revenue.
A continuum of combinations of spending and absorption is possible as response to scaled up aid. The decisions on the level of absorption and spending can be taken independently of each other, although the overall effect on the economy is a combination of the two decisions. The four cases at the respective end of the spectrum are summarized in Table 1. Each combination affects key economic variables in a different way, ranging from no impact on the aggregate demand to crowding out of the private sector or loss of competitiveness. The optimal choice of instruments has to be taken against the background of the specific country characteristics, policies in place, and government’s objectives.
Most often, increased aid is both absorbed and spent to some degree. The increase in aid usually leads to higher demand for imports and domestically produced non-tradable goods, including public services. This can cause the real exchange rate to appreciate, because prices of non-tradables become higher than those of non-tradables, thereby undermining the performance of the export sector, especially of non-traditional exports.
Box 1: Experience of other African countries5
The experience of other African countries to a surge in aid inflows has been mixed. Based on the characteristics of the economy, the policy response has covered almost the whole spectrum of spending and absorption combinations (Table Box-1). There has been no evidence of Dutch disease in most countries, but it cannot be ruled out as a problem for the future. The absence of currency appreciation and loss of competitiveness indicates that for most of these countries non-price export supply constraints are more important than price developments.
Table Box-1: Policy response to aid surge in other African countries
Not spent Partly spent Mostly spent Fully spent
Not absorbed Ghana Tanzania
Partly absorbed Ethiopia Uganda Mauritania
Mostly absorbed Sierra Leone Rwanda, Burundi Mozambique
Fully absorbed
Source: Foster and Heller (2007), Foster and Killick (2006), Gupta et al. (2006)
3.2. Aid flows to Burundi
Data on aid is available from different sources. The data used in this section is obtained from the IMF to ensure consistency between the external and fiscal accounts. It may therefore differ from donor reported aid flows published by the OECD, used in section 4, due to various reasons such as inclusion of off-budget aid or technical assistance delivered outside the recipient country in the OECD dataset.
Levels of external aid to Burundi have increased substantially since the Arusha peace agreement in 2000. Following the eruption of the civil war in 1993, almost all donor support was suspended from 1996 until late 2000 when the signing of the Arusha peace agreement marked the start of a transitional period. Donors have resumed their support and aid inflows have increased slowly since 2000 with a substantial surge since 2005 – when a new constitution was adopted and a new president took office – reaching levels of over US$ 300 million in 2007, equivalent to more than 30 percent of GDP (Figure 2).
5
Detailed information about the composition of aid for each country was not available to undertake further in-depth comparisons.
Figure 2: Net aid inflows, 1993-2008 (USD million, current prices and percent of GDP) 0 50 100 150 200 250 300 350 400 1993 1994 1995 1996 1997 1998 1999 2000 2001 2002 2003 2004 2005 2006 2007 2008 U S D mi ll ion 0 5 10 15 20 25 30 35 40 per cent of GD P
Net aid inflows (USD million) Net aid inflows (percent of GDP)
Source: Authors’ calculation based on IMF data.
Figure 3: Gross and net aid inflows, 2001-2008 (USD million, current prices)
0 50 100 150 200 250 300 350 400 2001 2002 2003 2004 2005 2006 2007 2008 U S D mi ll ion
Gross aid inflows Net aid inflows
Average net aid inflows 2001-04
Average net aid inflows 2005-08
Source: Authors’ calculation based on IMF data.
The pronounced jump in aid inflows between 2004 and 2005 is especially noticeable in the net aid figures, while gross aid inflows increased more smoothly over the last years (Figure 3).6 The large difference between net and gross aid observable in 2004 can be attributed to the clearance of arrears of more than US$100 million with multilateral as well as bilateral creditors in that year. That arrears clearance consisted of repayment of arrears (28 percent of the total reduction of principal), rescheduling (41 percent) and cancellation (31 percent). The average net aid inflow between 2001 and 2004, the pre aid-surge period, was US$ 94 million or 15 percent of GDP.
6 Gross aid inflows are defined as the sum of project and program grants and loans.Net aid inflows = Gross aid inflows
+ debt relief – interest on public debt – amortization + arrears accumulation (with arrears clearance taking a negative sign). For further details see Berg et al. (2007).
Since 2005, net aid inflows averaged US$ 306 million (32 percent of GDP). The period 2005 to 2008 is therefore referred to as aid-surge period.
3.3. Absorption and spending in Burundi
The following analysis focuses on net aid inflows as they reflect the actual aid inflows that are available as financing source. Burundi’s policy response to the increase in net aid inflows has been to mostly absorb the additional resources. This is demonstrated by the ratio of the change in the non-aid current account balance to change in aid of 86 percent (Table 2). It implies that most of the received foreign exchange has been sold and used for imports. The increase in imports reflects not only the direct government imports associated with higher aid, but also second-round effects attributable to higher aid-induced spending by government and the private sector. Reserves have only increased slightly and a small improvement of the non-aid capital account balance was recorded.
Table 2: Has aid been absorbed? (percent of GDP, annual averages)
Pre-Aid Surge Aid Surge
2001-2004 (average) 2005-2008 (average) Difference
Net aid inflows 14.9 32.0 17.1
Non-aid current account balance -18.1 -32.9 -14.7 Mostly absorbed
Non-aid capital account balance -1.4 1.2 2.6 86%
Change in reserves (- = increase) 4.6 -0.3 -4.9
Absorption of incremental aid
Source: Authors’ calculation based on IMF data; change in reserves includes exceptional financing that could not be allocated to the current or capital account balance.
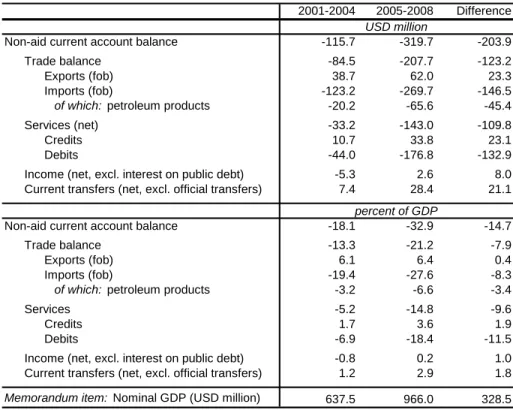
A closer look at the non-aid current account deficit confirms that imports have been the main cause of its widening from 18 (2001-04) to 33 (2005-08) percent of GDP. The import bill for both goods and services increased substantially (Table 3 and Table A-2). The ratio of goods imports to GDP increased from 19 to 28 percent while services imports as share of GDP recorded an increase from 7 to 18 percent. Exports of goods and services, on the other hand, did not increase significantly in absolute terms and remained fairly constant as percentage of GDP between 2001 and 2008.
Services imports averaged about 30 percent annual growth whereas goods imports grew by about 16 percent annually in the same period. The share of service imports in total imports of goods and services has consequently increased from 25 percent on average between 2001 and 2004 to 40 percent on average between 2005 and 2008. The main components of services imports are transport and travel costs. The high transport costs are attributable to the fact that Burundi is a landlocked country. Increasing spending on the travel subcomponent can be traced to frequent international travel of the government as well as the payment for international consultants for technical assistance.
Table 3: Composition of non-aid current account deficit, pre aid-surge period (2001-2004) and aid-surge period (2005-2008).
2001-2004 2005-2008 Difference
Non-aid current account balance -115.7 -319.7 -203.9
Trade balance -84.5 -207.7 -123.2
Exports (fob) 38.7 62.0 23.3
Imports (fob) -123.2 -269.7 -146.5
of which: petroleum products -20.2 -65.6 -45.4
Services (net) -33.2 -143.0 -109.8
Credits 10.7 33.8 23.1
Debits -44.0 -176.8 -132.9
Income (net, excl. interest on public debt) -5.3 2.6 8.0
Current transfers (net, excl. official transfers) 7.4 28.4 21.1
Non-aid current account balance -18.1 -32.9 -14.7
Trade balance -13.3 -21.2 -7.9
Exports (fob) 6.1 6.4 0.4
Imports (fob) -19.4 -27.6 -8.3
of which: petroleum products -3.2 -6.6 -3.4
Services -5.2 -14.8 -9.6
Credits 1.7 3.6 1.9
Debits -6.9 -18.4 -11.5
Income (net, excl. interest on public debt) -0.8 0.2 1.0
Current transfers (net, excl. official transfers) 1.2 2.9 1.8
Memorandum item: Nominal GDP (USD million) 637.5 966.0 328.5
USD million
percent of GDP
Source: Authors’ calculation based on IMF data.
Turning to the use of additional external resources by the government, Table 4 shows that Burundi has spent most of the incremental aid received.7 The ratio of change of the non-aid fiscal balance to change in aid amounts to 75 percent. Overall, the non-aid fiscal deficit has worsened significantly from 10 to almost 20 percent of GDP. Most of this can be attributed to higher expenditure (excluding interest payments), which increased from 30 percent to 38 percent of GDP between 2001-04 and 2005-08. Section 4 of this paper investigates the breakdown of expenditures and their use in more details.
Table 4: Has aid been spent? (percent of GDP, annual averages)
Pre-Aid Surge Aid Surge
2001-2004 (average) 2005-2008 (average) Difference
Net fiscal aid inflows 9.3 21.7 12.3
Revenue (excluding grants) 20.4 19.1 -1.2 Mostly spent
Expenditure (excluding external interest) 30.3 38.4 8.1 75%
Overall fiscal balance before aid -9.9 -19.2 -9.3
Aid spent?
Source: Authors’ calculation based on IMF data.
Revenue (excluding grants), while improving in absolute terms, decreased slightly as share of GDP, mainly as a result of lower GDP shares of taxes on international trade and non-tax revenue. It seems, therefore, that up to now for Burundi there is no indication that the higher aid flows lead to a decrease in revenue as suggested by Gupta et al. (2004) who find that foreign aid in the form of grants is associated with lower domestic revenue mobilization.
7 Net fiscal aid inflows are defined as the sum of budget grants, loans and debt relief minus public debt service and
arrears clearance. They differ from net aid flows to the economy due to off-budget aid and aid transferred directly to the private sector.
3.4. Effect on trade and competitiveness
The fact that Burundi has spent and absorbed most of the high aid flows raises concerns about currency appreciation and its impact on competitiveness of the economy and the potential for some Dutch disease effect. In fact, the real effective exchange rate has appreciated slightly during the aid-surge period, by 1.5 percent annually or 5.2 percent in total from 2005 to 2008 (Table 5).8 The slight deterioration of the terms of trade is another indicator for a possible loss of competitiveness in the aid-surge period.
Table 5: Exchange rate and trade indicators
2001-2004 2005-2008 Exchange rate and prices (annual percentage change)
Real effective exchange rate -10.4 1.5
Nominal effective exchange rate -12.9 -5.1
Terms of trade 1.6 -2.9
Inflation (CPI, average) 6.7 12.1
Exports (percent of GDP)
Total exports of goods (fob) 6.1 6.4
Coffee exports 3.5 4.3
Tea exports 1.6 1.0
Other exports 1.0 1.1
Exports (annual percentage change)
Total exports of goods (fob) 2.0 15.5
Coffee exports 2.1 19.8
Tea exports -3.2 6.6
Other exports 55.0 15.4
Source: Authors’ calculation based on IMF data; minus = depreciation
This overall slight loss of competitiveness has, however, been caused primarily by higher inflation compared to the trading partners and not appreciation of the nominal exchange rate.9 The nominal effective exchange rate depreciated by 5.1 percent per year on average or 20.1 percent overall between 2005 and 2008. The higher inflation has therefore more than offset the depreciation of the nominal exchange rate. The development of these key indicators is shown in Figure 4.
The high inflation rate has partly been caused by natural events and developments in the commodity markets that are exogenous for the government of Burundi and cannot be attributed to the increase in aid flows. For instance, part of the price increases in 2005 was caused by a drought affecting domestic agricultural production while the high inflation in 2008 was due to the global food and petroleum price crises.
The relative price development of tradables and non-tradables confirms that the slight appreciation of the real effective exchange rate was not due to the increase in aid. In the case of Dutch disease, prices of non-tradables increase more than those of tradables, leading to an appreciation of the real effective exchange rate and ultimately to the contraction of the tradables sector. In Burundi, however, the price level of tradables has increased on average by 13 percent between 2005 and 2008 while those of non-tradables increased only by 11 percent on average.10
8
For annual figures see Table A-3.
9 The real effective exchange rate is calculated as product of the nominal effective, i.e. trade weighted, exchange rate
and the inflation differential between Burundi and its trade partners.
10
Figure 4: Exchange rate and price developments, 2001-2008 -10 -5 0 5 10 15 20 25 30 40 50 60 70 80 90 100 110 120 Ja n … Ma … Se p … Ja n … Ma … Se p … Ja n … Ma … Se p … Ja n … Ma … Se p … Ja n … Ma … Se p … Ja n … Ma … Se p … Ja n … Ma … Se p … Ja n … Ma … Se p … p e rcent Index REER (left scale)
CPI (12 month percent change) (right scale)
NEER (left scale)
Source: Authors’ calculation based on IMF data.
In addition, goods exports, dominated by coffee and tea, do not seem to have suffered, likely due to their dependence on non-price factors (such as infrastructure and supply constraints) rather than prices and exchange rates.11 In fact, Burundi’s export performance improved from an average of 6.1 percent of GDP during 2000-2004 to 6.4 percent of GDP during 2005-2008, indicating that the appreciation of the real effective exchange rate has not been detrimental to exports.12 Dutch disease does not seem to be a significant problem in Burundi so far. This is confirmed by the IMF’s assessment of Burundi’s exchange rate, which concluded that the real exchange rate has been broadly in line with economic fundamentals (IMF, 2008).
4. Allocation of increased aid and impact on growth
Burundi has not experienced the expected post-conflict growth spike seen in other post-conflict countries. This is despite the high levels of aid Burundi has been receiving, most of which has been spent, as established in the previous section. Real GDP growth averaged only 3.0 percent between 2001 and 2008 and real GDP per capita declined on average by 0.3 percent. This section analyses the allocation of spending and tries to determine the linkages between aid, spending in different sectors, and economic growth. Of course, aid is only one of many factors affecting growth as shown by an extensive literature on determinants and factors of growth. We also examine how the composition of the domestically financed budget has contributed to Burundi’s growth performance as well as what the impact the predictability of aid was.
4.1. The effect of aid on growth – theoretical background
The effect of aid on growth has been widely discussed in the literature without a consensus. A large literature on aid and growth has typically examined the impact of aggregate aid on growth,
11
See also Foster and Killick (2006).
12
often using cross-country regressions and has found mixed results. Some argue that aid has on average a positive growth impact, even if this impact is not the same everywhere and regardless of country specifics. One of the main contributions of this strand of the literature is identifying the non-linear relationship of aid and growth. On the other hand, others have argued that aid does little for growth, unless certain conditions – such as better institutions – are in place (Burnside and Dollar, 2000). In some cases, the wrong circumstances or institutional set-up can impact growth negatively.
Realistically, aid is recipient-specific and is given for a multitude of reasons, not for the sole purpose of promoting growth. Often aid provides humanitarian relief post war or natural disasters or is given to achieve donors’ political objectives, with growth as a secondary goal. Other times, aid is conditioned on the specific social objectives of the donors, such as promoting education, health or gender equality. These political or social objectives may or may not fully match the development goals of recipient countries, thus affecting their ability to successfully implement their growth and development strategies.
In analyzing the impact of aid on growth, Clemens et al. (2004) highlight the importance of taking into account the objectives of giving and using aid. They identify three categories of aid and their potential impact on growth:
(i) Humanitarian aid: Aid can be destined for immediate consumption in the aftermath of a disaster or war to stabilize the country and facilitate peace building, thus exhibiting little or negative correlation with growth, as disasters and wars cause low or negative growth. This aid category has, however, an important long-term effect on growth as peace and stability have to be established to enable the recovery of the country.
(ii) Aid with a short-run impact on growth: A second category of aid provides resources for infrastructure and production sectors (e.g. agriculture), which can impact growth in the short term – say within four years of the expenditure undertaken - as they remove immediate constraints to growth.
(iii)Aid with a long-run impact on growth: A third category of aid focuses resources in sectors such as health and education, which have long term impact on growth, but no visible short or medium term correlation.
Using regression analysis over four years the authors find a strong, positive and causal relationship between “short-impact” aid (aid spent on infrastructure and productive sectors over four years) and growth that is two-to-three times larger than that found in studies using aggregate financial aid. Better institutions and longer life expectancy enhance this growth impact. Their methodology does not yield a strong correlation between the two other categories of aid and short/medium term growth, which may signal as much the inappropriateness of the methodology as the actual lack of impact.
The absorptive capacity of aid recipients affects the economic returns to aid and its impact on growth. McGillivray and Feeny (2008) study the well established U-shaped relationship between aid and growth as it relates to fragile countries absorptive capacity. They find that many of the highly fragile states (from a per capita income perspective) are over-aided as they can only efficiently absorb approximately one-third of the amount of aid that other countries can. Interestingly, they single out Burundi (in 2004 – before the aid-surge) as being one of the highest over-aided countries. The authors calculate that in 2004 growth efficient aid was at 14 percent of
GPD while Burundi received 49 percent of GDP in aid and they conclude that Burundi was receiving aid four times its growth efficiency levels. They argue that as the contribution of aid falls to zero when aid reaches twice the growth efficient level and is negative beyond this level, aid contributed to negative growth in Burundi in 2004.
Budgetary practices and the low predictability of aid disbursement further affect the absorptive capacity of recipients for aid and therefore its impact on growth.13 Many least developed countries continue to finance recurrent expenditures with domestic resources while financing investment expenditures through foreign aid. While the literature is mixed on the link between aggregate government expenditures and growth, many consider that appropriately selected and targeted public investment programs can affect growth positively. However, the combination of budgeting investment expenditures based on aid receipts and low predictability of aid affects the composition and effectiveness of spending and can further aggravate the bias towards government consumption. In fact, as Celasun and Walliser (2008) show, governments tend to cut investment spending in times of aid shortfalls and expand government consumption if additional aid becomes available unexpectedly. This is especially the case in low income countries that rely heavily on external assistance to fund their budget and have only limited access to international financial markets to fund budget shortfalls.
Finally, Collier and Hoeffler (2004) find that the absorptive capacity for aid is systematically different in post-conflict countries. They find that there is no significant difference in absorptive capacity and no bounce-back of growth in immediate aftermath of peacemaking (first three years). After this initial period, absorptive capacity approximately doubles. Aid is especially effective and critical for growth after peace has been fully established but its effectiveness diminishes after about seven years following the end of the conflict.
Our approach combines the methodology of Clemens et al. (2004) together with the insights from McGillivray and Feeny (2008) and Collier and Hoeffler (2004) work. While McGillivray and Feeny (2008) do not distinguish between the different categories of aid (as discussed above), their finding generally coincide with our finding that aid and growth are not positively correlated in Burundi in the recent past. However, we argue that the issue is not as simple as Burundi receiving too much aid for its absorptive capacity. In 2004, Burundi was still in the process of achieving full peace, which it did not reach until early 2009 with the signing of the peace agreement with the last rebel group. Burundi is in effect only now entering a true post-conflict period. Since 2000 a large proportion of aid to Burundi was emergency and humanitarian aid to stabilize the economy and ensure social cohesion by disarming and facilitating the return of rebel soldiers to civilian life. This aid would not necessarily correlate positively with growth.14 Additionally, if we believe Collier and Hoeffler (2004) results, we should not expect any growth impact of aid for the next 3 years. Below, we discuss our findings in more details.
4.2. Allocation of aid to Burundi
The Creditor Reporting System (CRS) of the OECD Development Assistance Committee (DAC) provides data on aid allocation. Data on commitments are available starting 1995, but the low
13
The predictability of aid flows is defined as the difference between commitments and actual disbursements in a given year.
14 In fact, according to Clemens et al. (2004), while humanitarian aid does not correlate with growth, short-impact aid is
best absorbed on average when it represents 8.1 percent of GDP and total aid is around 18 percent of GDP. Some countries may be able to absorb more, some less.
coverage ratio of the data enables the analysis of disbursement data only from 2002 onwards. To ensure consistency with the previous section, however, data for 2001 is included on the commitment basis. This also enables the analysis of the entire period following the official end of the conflict after the Arusha peace agreement in 2000.
Detailed data is available on commitments and gross disbursement by sector, purpose code, type of aid, donor etc.15 Gross disbursements by sector as share of total disbursements using the OECD classification are given in Table 6. Absolute values for commitments, gross disbursements and the disbursement ratio by sector are provided in Table A-5 in the appendix.
Table 6: Gross disbursement by sector (share of total disbursement, OECD classification), 2001-2007
2001* 2002 2003 2004 2005 2006 2007 average
Social Infrastructure and Services 49.6 35.3 31.5 23.1 29.3 31.3 30.8 33.0
Economic Infrastructure 0.1 0.6 0.0 0.1 1.0 2.1 5.0 1.3
Production Sectors 6.5 0.7 0.8 0.7 0.7 1.1 11.8 3.2
Multisector 1.1 5.1 1.9 3.7 2.3 3.9 6.1 3.4
Commodity Aid / General Prog. Assistance 1.9 15.4 6.1 4.8 15.9 16.0 17.6 11.1
Action Relating to Debt 3.1 3.1 2.1 30.3 4.0 5.2 1.0 7.0
Humanitarian Aid 33.0 31.5 45.2 32.0 43.1 39.0 27.0 35.8
Other 4.7 8.2 12.4 5.4 3.7 1.5 0.7 5.2
Total 100.0 100.0 100.0 100.0 100.0 100.0 100.0 100.0
Source: Authors’ calculation based on OECD – DAC data; *2001: commitments, no data on disbursements available.
On average, the highest amount has been allocated to humanitarian aid, followed by social infrastructure and services and commodity aid/general program assistance.16 The share of humanitarian aid is decreasing slowly since 2005. The amount dedicated to production sectors is very small and the large amount of funding in 2007can be attributed to trade related adjustments and not to spending on production oriented sectors, such as agriculture or mining.17 In 2004, almost a third of the disbursed aid was related to debt relief/debt rescheduling by the European Commission and France.
This classification of the OECD can, however, be misleading as it assumes that all aid has the same impact on growth. In the following, we break down the allocation of aid according to its impact on growth.
4.3. Impact of aid on growth in Burundi
As discussed in section 4.1, the effect of aid on the economic development has to be examined (i) in the country-specific context, and (ii) according to the aid category. Regarding the categorization of aid and the effect on economic growth, we follow the approach of Clemens et al. (2004), modified to capture Burundi specific characteristics. Aid is classified in three aggregate categories that combine sectors according their lag in impacting growth.
This approach is possible by using the CRS database, providing a breakdown of aid disbursement by 194 purpose codes. Each purpose code has been assigned a category that relates to its impact on aid. The categories are (i) emergency and humanitarian aid, (ii) aid with a short-term impact
15
The CRS also provides aid commitments and disbursements by type of aid, i.e. investment project, sector programme, technical cooperation or a combination of the three, but unfortunately for Burundi, the data is not very conclusive. On average, the type of 75 percent of disbursed aid was classified as ‘other’, making a meaningful interpretation impossible.
16
The sub-categories as well as the respective individual amounts are given in Table A-5 in the appendix.
17
Funding for trade related adjustments has been provided via STABEX (Système de Stabilisation des Recettes d'Exportation), a compensatory financing scheme of the European Commission to stabilize export earnings. In 2007, Burundi received a total of USD 39.96 million to compensate for lower export earnings from coffee and hides and skins in the years 1993 to 1999 retrospectively.
on growth, and (iii) aid with a long-term impact on growth. Clemens et al. (2004) classify budget support and actions relating to debt entirely as having a short-term impact on growth, which is not always the case.18 Differing from them, we allocate budget support and debt relief similar to the composition of the budget, which is discussed in the following section. Following the budget composition between 2001 and 2007, we allocate 21 percent of budget support and debt relief to long-term growth enhancing sectors, while the remaining 79 percent are allocated to sectors that have a short-term impact on growth.
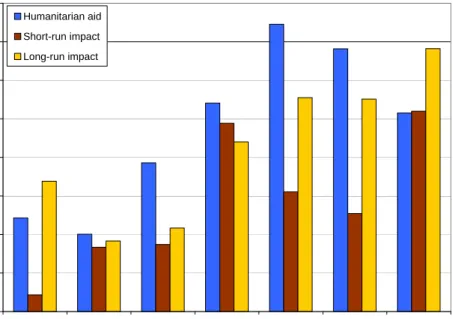
Figure 5: Allocation of aid by impact category (Gross disbursement, current USD million), 2001-2007
0 20 40 60 80 100 120 140 160 2001 2002 2003 2004 2005 2006 2007 USD mi ll ion (current) Humanitarian aid Short-run impact Long-run impact
Source: Authors’ calculation based on OECD – DAC data; 2001: commitments, no data on disbursements available.
The pattern of aid allocation between 2001 and 2007 (Figure 5) shows that there is not necessarily a contradiction between increased aid flows and low growth performance if a lagged impact of aid is taken into account.19
The highest share of aid, about 41 percent has been allocated to emergency and humanitarian aid, in Burundi mainly consisting of emergency/distress relief and emergency food aid. As Clemens et al. (2004) point out, this type of aid is not directly growth enhancing, but might even coincide with a negative growth rate as it is disbursed in times of crisis. It is, however, a necessary condition for establishing peace and has a long-term stabilizing effect. The expenditure pattern observed in Burundi is typical for a country getting out of conflict where the humanitarian aid remains high immediately after the end of conflict when a fragile situation prevails. In the case of Burundi, the peacemaking process which started in 2000 with the Arusha agreement is only approaching closure in early 2009 when the last rebel group started disarming. Emergency and humanitarian aid has been declining since 2005, however, with improving security in Burundi.
18
At the time Clemens et al. (2004) carried out their analysis, the purpose code was termed ‘structural adjustment’ (CRS purpose code 51010), which has in the meantime been changed to ‘general budget support’.
19
The respective amounts are given in Table A-7 the appendix. Table A-8 details the breakdown of aid by classification for the total amount of aid disbursed between 2002 and 2007.
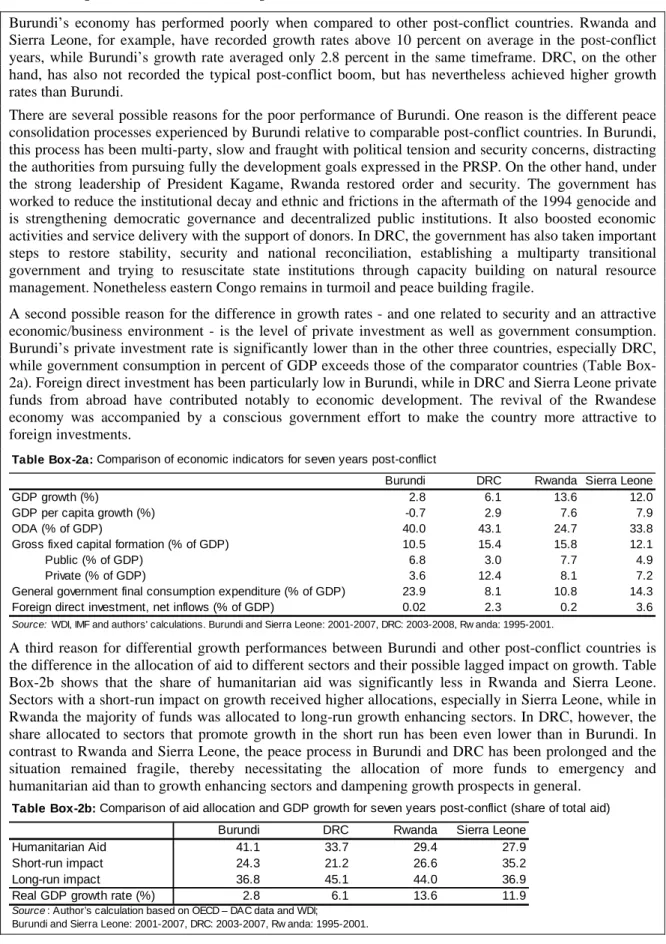
Box 2: Comparison with other African post-conflict countries
Burundi’s economy has performed poorly when compared to other post-conflict countries. Rwanda and Sierra Leone, for example, have recorded growth rates above 10 percent on average in the post-conflict years, while Burundi’s growth rate averaged only 2.8 percent in the same timeframe. DRC, on the other hand, has also not recorded the typical post-conflict boom, but has nevertheless achieved higher growth rates than Burundi.
There are several possible reasons for the poor performance of Burundi. One reason is the different peace consolidation processes experienced by Burundi relative to comparable post-conflict countries. In Burundi, this process has been multi-party, slow and fraught with political tension and security concerns, distracting the authorities from pursuing fully the development goals expressed in the PRSP. On the other hand, under the strong leadership of President Kagame, Rwanda restored order and security. The government has worked to reduce the institutional decay and ethnic and frictions in the aftermath of the 1994 genocide and is strengthening democratic governance and decentralized public institutions. It also boosted economic activities and service delivery with the support of donors. In DRC, the government has also taken important steps to restore stability, security and national reconciliation, establishing a multiparty transitional government and trying to resuscitate state institutions through capacity building on natural resource management. Nonetheless eastern Congo remains in turmoil and peace building fragile.
A second possible reason for the difference in growth rates - and one related to security and an attractive economic/business environment - is the level of private investment as well as government consumption. Burundi’s private investment rate is significantly lower than in the other three countries, especially DRC, while government consumption in percent of GDP exceeds those of the comparator countries (Table Box-2a). Foreign direct investment has been particularly low in Burundi, while in DRC and Sierra Leone private funds from abroad have contributed notably to economic development. The revival of the Rwandese economy was accompanied by a conscious government effort to make the country more attractive to foreign investments.
Table Box-2a: Comparison of economic indicators for seven years post-conflict
Burundi DRC Rwanda Sierra Leone
GDP growth (%) 2.8 6.1 13.6 12.0
GDP per capita growth (%) -0.7 2.9 7.6 7.9
ODA (% of GDP) 40.0 43.1 24.7 33.8
Gross fixed capital formation (% of GDP) 10.5 15.4 15.8 12.1
Public (% of GDP) 6.8 3.0 7.7 4.9
Private (% of GDP) 3.6 12.4 8.1 7.2
General government final consumption expenditure (% of GDP) 23.9 8.1 10.8 14.3
Foreign direct investment, net inflows (% of GDP) 0.02 2.3 0.2 3.6
Source: WDI, IMF and authors' calculations. Burundi and Sierra Leone: 2001-2007, DRC: 2003-2008, Rw anda: 1995-2001.
A third reason for differential growth performances between Burundi and other post-conflict countries is the difference in the allocation of aid to different sectors and their possible lagged impact on growth. Table Box-2b shows that the share of humanitarian aid was significantly less in Rwanda and Sierra Leone. Sectors with a short-run impact on growth received higher allocations, especially in Sierra Leone, while in Rwanda the majority of funds was allocated to long-run growth enhancing sectors. In DRC, however, the share allocated to sectors that promote growth in the short run has been even lower than in Burundi. In contrast to Rwanda and Sierra Leone, the peace process in Burundi and DRC has been prolonged and the situation remained fragile, thereby necessitating the allocation of more funds to emergency and humanitarian aid than to growth enhancing sectors and dampening growth prospects in general.
Table Box-2b: Comparison of aid allocation and GDP growth for seven years post-conflict (share of total aid)
Burundi DRC Rwanda Sierra Leone
Humanitarian Aid 41.1 33.7 29.4 27.9
Short-run impact 24.3 21.2 26.6 35.2
Long-run impact 36.8 45.1 44.0 36.9
Real GDP growth rate (%) 2.8 6.1 13.6 11.9
Source: Author’s calculation based on OECD – DAC data and WDI; Burundi and Sierra Leone: 2001-2007, DRC: 2003-2007, Rw anda: 1995-2001.
Aid allocated to sectors that contribute to growth in the long run is about 37 percent of total aid and represents the second largest and increasing category. This is aid allocated fully or partially to education, health, population programs, water supply and sanitation, multisectoral projects as well as planning, development and research in other areas (Table A-8 in the appendix). Spending in these areas is considered to build human capital and improve service delivery, which is expected to increase the productivity of labor in Burundi in the long run.
The increase in social expenditures coincides with the taking of power of the current President who has a strong commitment to improving health and education. He eliminated the primary school fees in September 2005 resulting in a large increase in first grade enrollment. The gross primary school enrollment rate rose from an estimated 77 percent in 2003/04 to 114 percent in 2006/07. The gender parity index improved markedly from 0.75 in 2003/04 to 0.87 in 2006/07. In health, the President announced the elimination of user fees for health services for children under five and women during delivery in May 2006.
Aid allocation on short-run growth enhancing sectors (transport and storage, energy, financial sector, agriculture, manufacturing, mining, peace building20, on the other hand, has been smaller with only about 24 percent of total aid between 2001 and 2007. If, however, the disbursements for peace building are excluded, the allocation to sectors with a short-run impact is reduced to merely USD 290 million or 18 percent of total aid between 2001 and 2007. Considering these results, it is not surprising that the increased amounts of aid have not led to a boost in economic growth rates.
The effect of the allocation of external resources is compounded by the limited amount of the domestically financed budget that has been spent on infrastructure and production oriented sectors, making a significant positive effect on growth in the short to medium term unlikely. Spending on priority sectors (education, health, infrastructure, and agriculture) has improved from 20 percent in 2001-04 to 33 percent of domestically financed expenditures in 2005-08, but is still considered low as domestic resources are relatively limited. Only 15 and 18 percent of this priority spending has been allocated to agriculture and infrastructure in 2001-04 and 2005-08, respectively.21
Of the total domestic funds available, only about 10 percent on average have been spent on capital expenditure over 2005 to 2008, up from 4 percent between 2001 and 2004. Recurrent expenditure represents the largest share of total domestically financed expenditure. The majority of recurrent expenditure has been spent on wages and salaries, about 39 percent of total recurrent expenditure on average between 2001 and 2008, followed by 32 percent on goods and services. Spending on the security sector remained high, about 24 percent on average of total domestically financed expenditure throughout the entire period. The military as well as the police force receive a large share of recurrent expenditure, 42 percent of wages and salaries and 52 percent of goods and services, respectively. High security spending can be considered to be necessary in a fragile post-conflict environment. Without ensuring security and stability, necessary reforms cannot be implemented, private investment remains low and sustained economic growth cannot be
20
This comprises the following categories: Civilian peace building, conflict prevention and resolution; post-conflict peace building (UN); reintegration and small arms, light weapons (SALW) control; land mine clearance; and child soldiers (prevention and reintegration).
21
A more detailed breakdown of domestically financed government spending is presented in Table A-4 in the appendix.
achieved. As the last rebel groups is demobilized and reintegrated, however, and the situation remains stable, the share of spending on military and policy are expected to decline.
Despite the limited fiscal space caused by the large security budget, the Burundi government has started to redirect its budget, including resources from interim debt relief, toward poverty-reducing and social expenditures line with its PRSP goals. Total social expenditures (health, education and other social expenditures) rose from 5.1 percent of GDP in 2001 to a projected 8.8 percent in 2008 and are expected to increase further to about 10 percent in 2009, about 23 percent of total expenditure. Interim debt relief has been used as an integral part of the overall budget to increase social sector and poverty-reducing expenditures. More than half of HIPC resources are being allocated to key social sectors (education, public health and the fight against AIDS).
4.4. Predictability of aid in Burundi
As pointed out in section 4.1, low predictability of aid affects the composition and effectiveness of spending and can further exacerbate the bias towards government consumption and away from investment in production oriented sectors as well as human capital. In the case of Burundi, the low predictability of aid has likely aggravated the spending pattern of the government, which has not been conducive for promoting growth especially as the country already spends a very limited amount of its domestically financed budget on investment.
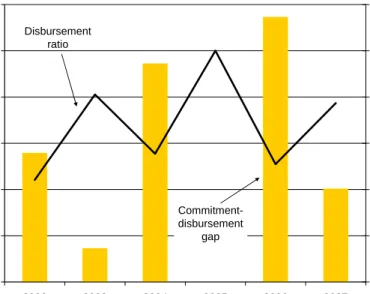
The average aid disbursement ratio, i.e. the disbursed amount divided by the committed amount, in Burundi was 68 percent between 2002 and 2007, but varied considerably from one year to the other (Figure 6). The average difference between commitments and disbursements was USD 133 million, peaking at USD 286 million in 2006 -when it only reached just over 50 percent of the committed amount has been disbursed.
Figure 6: Disbursement ratio and commitment-disbursement gap, 2001-2007
0 20 40 60 80 100 120 2002 2003 2004 2005 2006 2007 p e rcen t 0 50 100 150 200 250 300 US D m il li o n Disbursement ratio Commitment-disbursement gap
Source: Authors’ calculation based on OECD – DAC data.
In the next few years, the issue of low predictability as well as volatility of aid is especially important in the light of the financial crisis. Aid commitments and disbursements may decline as donors address domestic financial issues. The situation is particularly critical as Burundi is now entering the true post-conflict reconstruction phase, where according to Collier and Hoeffler
(2004), aid is especially effective and critical for growth. According to their findings, this aid effectiveness diminishes after about seven years following the end of the conflict. It is therefore important that the amount of aid provided by the donor community remains at the current high level for the foreseeable future.
To ensure such a commitment and a more efficient allocation and use of aid, Burundi needs to continue: (i) to improve its budgetary process, (ii) to allocate funds to the sectors that are geared towards promoting equitable growth in Burundi, and (iii) strengthen the coordination of funds from international development partners.
5. Conclusions and policy implications
Despite increased aid flows in recent years, Burundi has not been able to achieve high and sustainable growth rates. Our analysis shows that most of the external aid has been spent and absorbed, implying an increase in the non-aid current account deficit as well as the overall fiscal deficit before aid. Until now, however, there has been no indication of a negative effect on competitiveness via the real effective exchange rate, but the possibility of a Dutch disease effect remains a risk.
A post-conflict country, receiving a considerable amount of aid, usually experiences a growth spurt, which has not been the case in Burundi. There are several possible reasons for the low growth performance, which should not be seen entirely as a sign of the ineffectiveness of aid or too much aid for Burundi’s absorptive capacity. Instead, we note the specific realities of Burundi, where establishing peace which started in 2000 is only coming to closure in 2009 with the last rebel group disarming. Given this fact, we analyze the allocation of aid according to its impact on the economy and find that in Burundi, most aid has been disbursed as humanitarian aid, followed by aid with a long-run impact on growth, mainly on social sectors, while the share of aid disbursed to sectors with a short-run growth enhancing impact has been the smallest.
While humanitarian aid is necessary to establish conditions that enable the economic recovery, it is usually disbursed in times of crisis and consequently coincides with small or even negative growth rates. Spending on social sectors, on the other hand, is beneficial for growth in the long-run, but does not promote the development of the economy in the short- and medium term. To boost short-term growth, the share of aid allocated to production oriented sectors, such as agriculture and the supporting infrastructure needs to be increased.
The small amount of domestically financed investment spending has helped little to promote economic growth in the past years. This bias towards recurrent spending has, however, been fostered by the low predictability of aid, which is not conducive for a growth enhancing composition of public expenditure. Especially in the current economic crisis, firm commitments and timely disbursements of donors are very important to ensure the allocation of funds in growth enhancing areas. Furthermore, the Burundian Government needs to strengthen its capacity and mechanisms for donor coordination. While the end of the aid dependency of Burundi is not foreseeable in the near future, improved allocation as well as efficiency of spending can enhance its impact on growth in the short to medium term.
References
Berg, Andrew, Shekhar Aiyar, Mumtaz Hussain, and others (2007), “The Macroeconomics of Scaling Up Aid: Lessons from Recent Experience,” IMF Occasional Paper, No. 253, IMF, Washington, DC.
Burnside, Craig and David Collar (2000), “Aid, Policies, and Growth,” American Economic Review, 90(4), 847-868.
Celasun, Oya and Jan Walliser (2008), “Predictability of aid: Do fickle donors undermine aid effectiveness?” Economic Policy, Vol. 23, No. 55, 547-594.
Chu, Ke-young, Sanjeev Gupta, Jerald Alan Schiff, and others (1995), “Unproductive Public Expenditures: A Pragmatic Approach to Policy Analysis,” IMF Pamphlet Series, No. 48, IMF, Washington, DC.
Clemens, Michael, Steven Radelet and Rikhil Bhavani (2004), “Counting chickens when they hatch: The short-term effect of aid on growth,” Working Paper No. 44, Center for Global Development,Washington, DC.
Collier, Paul and Anke Hoeffler (2004), “Aid, policy and growth in post-conflict societies,”
European Economic Review, 48, 1125-1145.
Fagernäs, Sonja and John Roberts (2004), “Fiscal Impact of Aid: A Survey of Issues and Synthesis of Country Studies of Malawi, Uganda and Zambia,” ESAU Working Paper No. 11, Overseas Development Institute, London.
Foster, Mick and Peter Heller (2007), “Managing the Risks Associated with Aid Increases in Rwanda,” prepared for MINECOFIN, Kigali, Rwanda.
Foster, Mick and Tony Killick (2006), “What Would Doubling Aid do for Macroeconomic Management in Africa,” Overseas Development Institute Working Paper, No. 264, London.
Gupta, Sanjeev, Robert Powell, and Yongzheng Yang (2006), “Macroeconomic Challenges of Scaling Up Aid to Africa – A Checklist for Practitioners,” IMF, Washington, DC.
Gupta, Sanjeev, Benedict Clements, Alexander Pivovarsky and Erwin Tiongson (2004), “Foreign aid and revenue response: does the composition of aid matter?” In: S. Gupta, B. Clements and G. Inchauste, Editors, Helping Countries Develop: The Role of Fiscal Policy, International Monetary Fund, Washington DC, 385–406.
IMF (2008), “Assessing External Competitiveness in Burundi,” Selected Issues Paper, IMF Country Report No. 08/292, August 2008, IMF, Washington, DC.
IMF (2005), “The Macroeconomics of Managing Increased Aid Inflows: Experience of Low-Income Countries and Policy Implications,” IMF, Washington, DC.
Khadiagala, Gilbert M. (2008), “Contemporary Security and Development Trends in the Great Lakes Region,” Working Paper No. 4, September, Multi-Country Demobilization and Reintegration Program, World Bank, Washington, DC.
McGillivray, Mark and Simon Feeny (2008), “Aid and Growth in Fragile States,” UNU-WIDER Research Paper, No. 2008/03.
Nganou, Jean-Pascal, Eric Mabushi and Ephraim Kebede (2007), “Sources of Growth in Burundi: A Macroeconomic Perspective,” World Bank, Background Paper for Breaking the Cycle – A Strategy for Conflict-sensitive Rural Growth in Burundi.
Nkurunziza, Janvier and Floribert Ngaruko (2002), “Explaining growth in Burundi: 1960-2000,”
The Centre for the Study of African Economies Working Paper Series, No. 162.
World Bank (2008), “Republic of Burundi: Public Expenditure Management and Financial Accountability Review (PEMFAR). Improving Allocative Efficiency and Governance of Public Expenditure and Investing in Public Capital to Accelerate Growth and Reduce Poverty,” Report No. 42160-BI, World Bank, Washington, DC.
A. Appendix
A.1. Selected economic indicators
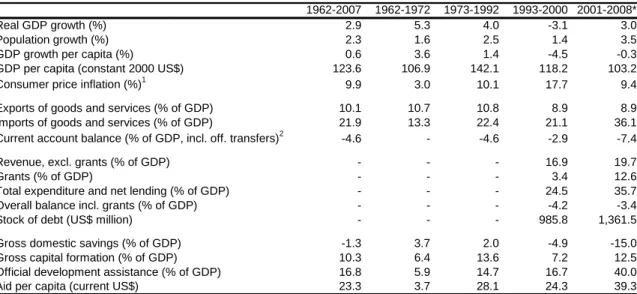
Table A-1: Burundi – selected economic indicators
1962-2007 1962-1972 1973-1992 1993-2000 2001-2008*
Real GDP growth (%) 2.9 5.3 4.0 -3.1 3.0
Population growth (%) 2.3 1.6 2.5 1.4 3.5
GDP growth per capita (%) 0.6 3.6 1.4 -4.5 -0.3
GDP per capita (constant 2000 US$) 123.6 106.9 142.1 118.2 103.2
Consumer price inflation (%)1 9.9 3.0 10.1 17.7 9.4
Exports of goods and services (% of GDP) 10.1 10.7 10.8 8.9 8.9
Imports of goods and services (% of GDP) 21.9 13.3 22.4 21.1 36.1
Current account balance (% of GDP, incl. off. transfers)2 -4.6 - -4.6 -2.9 -7.4
Revenue, excl. grants (% of GDP) - - - 16.9 19.7
Grants (% of GDP) - - - 3.4 12.6
Total expenditure and net lending (% of GDP) - - - 24.5 35.7
Overall balance incl. grants (% of GDP) - - - -4.2 -3.4
Stock of debt (US$ million) - - - 985.8 1,361.5
Gross domestic savings (% of GDP) -1.3 3.7 2.0 -4.9 -15.0
Gross capital formation (% of GDP) 10.3 6.4 13.6 7.2 12.5
Official development assistance (% of GDP) 16.8 5.9 14.7 16.7 40.0
Aid per capita (current US$) 23.3 3.7 28.1 24.3 39.3
Source: World Development Indicators, IMF and authors’ calculations; 1available from 1966, 2available from 1985; *value for 2008
not available for some indicators.
A.2. Detailed data: Absorption and spending
Table A-2: Composition of non-aid current account deficit, 2001-2008
2001 2002 2003 2004 2005 2006 2007 2008
Non-aid current account balance -89.1 -98.0 -114.4 -161.3 -221.3 -322.7 -350.2 -384.4
Trade balance -69.9 -76.2 -90.8 -101.1 -132.8 -185.9 -242.0 -269.9
Exports (fob) 38.5 31.0 37.5 47.9 57.2 58.6 52.9 79.2
Imports (fob) -108.4 -107.2 -128.3 -148.9 -190.0 -244.6 -295.0 -349.2
of which: petroleum products -16.4 -15.9 -22.0 -26.5 -38.3 -57.5 -58.4 -108.1
Services (net) -23.1 -25.3 -23.9 -60.6 -99.9 -167.6 -145.6 -159.1
Credits 6.9 7.7 12.5 15.8 35.0 34.5 30.6 35.1
Debits -30.0 -33.0 -36.4 -76.4 -134.9 -202.1 -176.2 -194.2
Income (net, excl. interest on public debt) -2.6 -2.0 -6.8 -10.0 -6.5 1.8 8.4 6.8 Current transfers (net, excl. official transfers) 6.5 5.5 7.0 10.5 17.9 29.0 29.0 37.8
Non-aid current account balance -13.5 -15.6 -19.2 -24.3 -27.6 -35.1 -35.9 -32.9
Trade balance -10.6 -12.1 -15.3 -15.2 -16.6 -20.2 -24.8 -23.1
Exports (fob) 5.8 4.9 6.3 7.2 7.1 6.4 5.4 6.8
Imports (fob) -16.4 -17.1 -21.6 -22.4 -23.7 -26.6 -30.3 -29.9
of which: petroleum products -2.5 -2.5 -3.7 -4.0 -4.8 -6.3 -6.0 -9.2
Services -3.5 -4.0 -4.0 -9.1 -12.5 -18.2 -14.9 -13.6
Credits 1.0 1.2 2.1 2.4 4.4 3.8 3.1 3.0
Debits -4.5 -5.3 -6.1 -11.5 -16.8 -22.0 -18.1 -16.6
Income (net, excl. interest on public debt) -0.4 -0.3 -1.1 -1.5 -0.8 0.2 0.9 0.6 Current transfers (net, excl. official transfers) 1.0 0.9 1.2 1.6 2.2 3.2 3.0 3.2
Memorandum item: Nominal GDP (USD million) 662.3 628.1 595.0 664.5 800.6 919.0 974.7 1,169.7
USD million
percent of GDP
Table A-3: Exchange rate and trade indicators, 2001-2008
2001 2002 2003 2004 2005 2006 2007 2008
Exchange rate and prices (annual percentage change)
Real effective exchange rate -4.9 -15.1 -18.7 -3.0 10.0 3.3 -6.1 -1.4
Nominal effective exchange rate -9.4 -10.7 -24.1 -7.3 1.0 3.8 -10.0 -15.3
Terms of trade -21.3 0.9 -1.4 28.1 10.9 -2.9 -23.4 3.7
Inflation (CPI, average) 9.3 -1.3 10.7 8.0 13.5 2.7 8.3 23.7
Exports (percent of GDP)
Total exports of goods (fob) 5.8 4.9 6.3 7.2 7.1 6.4 5.4 6.8
Coffee exports 3.0 2.7 3.9 4.4 5.1 4.3 3.3 4.5
Tea exports 1.6 1.4 1.7 1.5 1.1 1.1 0.9 1.1
Other exports 1.3 0.9 0.7 1.2 1.0 1.0 1.1 1.2
Exports (annual percentage change)
Total exports of goods (fob) -21.2 -19.5 21.0 27.5 19.5 2.6 -9.7 49.7
Coffee exports -42.0 -14.8 37.0 28.1 38.0 -2.1 -17.8 61.2
Tea exports -12.6 -16.7 16.8 -0.5 -12.9 11.8 -7.8 35.3
Other exports 183.6 -34.0 -21.2 91.4 -6.2 16.3 23.7 27.7
Source: Authors’ calculations based on IMF data.
A.3. Detailed data: Allocation of resources
Table A-4: Composition of domestically financed total public expenditure, 2001-2008
2001 2002 2003 2004 2005 2006 2007 2008
General Public Services 70.1 99.2 99.0 127.1 132.0 154.2 127.2 160.7
Interest and amortization 45.1 70.9 67.2 89.7 85.9 79.5 66.8 75.4
Security Sector 36.7 44.1 43.4 47.5 66.8 78.9 89.0 96.5
Defense 34.1 41.4 40.7 44.3 44.4 48.7 54.1 57.6
Interior and Pubic Security 2.6 2.7 2.8 3.1 22.4 30.3 35.0 38.9
Priority Sectors 28.6 31.7 38.6 47.0 54.3 122.9 127.0 171.0 Education 20.7 22.6 28.6 34.4 41.3 80.2 88.0 97.9 Health 3.7 4.0 4.0 5.3 5.5 23.5 18.0 34.6 Agriculture 2.0 2.0 3.5 3.8 3.8 4.3 6.4 15.8 Infrastructure 2.3 3.1 2.5 3.5 3.7 14.9 14.7 22.8 Other 3.5 2.4 2.8 3.9 3.7 4.9 6.5 14.1 Total 139.0 177.4 183.8 225.4 256.8 361.0 349.8 442.3 Current expenditure 130.0 169.5 178.6 217.8 248.8 315.8 312.8 392.4 Capital expenditure 8.9 7.9 5.2 7.7 8.0 45.1 37.0 50.0
General Public Services 50.5 55.9 53.9 56.4 51.4 42.7 36.4 36.3
Interest and amortization 32.5 40.0 36.6 39.8 33.5 22.0 19.1 17.1
Security Sector 26.4 24.8 23.6 21.1 26.0 21.9 25.5 21.8
Defense 24.5 23.3 22.1 19.7 17.3 13.5 15.5 13.0
Interior and Pubic Security 1.9 1.5 1.5 1.4 8.7 8.4 10.0 8.8
Priority Sectors 20.6 17.9 21.0 20.8 21.2 34.0 36.3 38.7 Education 14.9 12.8 15.6 15.3 16.1 22.2 25.2 22.1 Health 2.7 2.2 2.2 2.4 2.1 6.5 5.2 7.8 Agriculture 1.4 1.1 1.9 1.7 1.5 1.2 1.8 3.6 Infrastructure 1.6 1.7 1.3 1.5 1.5 4.1 4.2 5.2 Other 2.5 1.4 1.5 1.7 1.4 1.4 1.9 3.2 Total 100.0 100.0 100.0 100.0 100.0 100.0 100.0 100.0 Current expenditure 93.6 95.6 97.2 96.6 96.9 87.5 89.4 88.7 Capital expenditure 6.4 4.4 2.8 3.4 3.1 12.5 10.6 11.3
percent of total budget FBu billion
Table A-5: Commitments, disbursements and disbursement ratios (OECD classification), 2002-2007
Commitments by sector, current USD 2001 2002 2003 2004 2005 2006 2007
Social Infrastructure and Services 62.0 82.4 72.1 122.8 89.1 203.7 164.5
Economic Infrastructure 0.1 0.7 0.0 102.4 3.9 38.7 53.5
Production Sectors 8.1 0.9 1.5 36.9 4.3 23.9 20.3
Multisector 1.3 12.4 10.3 6.5 15.2 98.3 19.1
Commodity Aid / General Prog. Assistance 2.3 62.0 9.4 64.9 54.1 100.1 77.5
Action Relating to Debt 3.9 24.7 7.5 61.6 21.2 14.1 1.2
Humanitarian Aid 41.2 65.1 80.1 121.3 125.2 101.5 105.2
Other 5.9 1.0 10.6 13.4 8.9 3.4 2.9
Total (USD million) 124.9 249.3 191.5 529.9 322.1 583.8 444.1
Total (FBu billion) 103.7