Developing a Model of Mobile Web Uptake in the Developing World
339
0
0
Full text
(2) University of Southampton Research Repository ePrints Soton. Copyright © and Moral Rights for this thesis are retained by the author and/or other copyright owners. A copy can be downloaded for personal non-commercial research or study, without prior permission or charge. This thesis cannot be reproduced or quoted extensively from without first obtaining permission in writing from the copyright holder/s. The content must not be changed in any way or sold commercially in any format or medium without the formal permission of the copyright holders.. When referring to this work, full bibliographic details including the author, title, awarding institution and date of the thesis must be given e.g. AUTHOR (year of submission) "Full thesis title", University of Southampton, name of the University School or Department, PhD Thesis, pagination. http://eprints.soton.ac.uk.
(3) UNIVERSITY OF SOUTHAMPTON FACULTY OF PHYSICAL SCIENCES AND ENGINEERING School of Electronics and Computer Science. DEVELOPING A MODEL OF MOBILE WEB UPTAKE IN THE DEVELOPING WORLD by Betty Purwandari. Thesis for the degree of Doctor of Philosophy September 2013.
(4)
(5) ABSTRACT This research was motivated by the limited penetration of the Internet within emerging economies and the ‘mobile miracle’, which refers to a steep increase of mobile phone penetration. In the context of the developing world, harnessing the ‘mobile miracle’ to improve Internet access can leverage the potential of the Web. However, no comprehensive model exists, which can identify and measure indicators of Mobile Web uptake. The absence of such a model creates problems in understanding the impact of the Mobile Web. This has generated the key question under study in this thesis: “What is a suitable model for Mobile Web uptake and its impact in the developing world?” In order to address the research question, the Model of Mobile Web Uptake in the Developing World (MMWUDW) was created. It was informed by a literature review, pilot study in Kenya and expert reviews. The MMWUDW was evaluated using Structural Equation Modelling (SEM) with the primary data that consisted of the questionnaire and interview data from Indonesia. The SEM analysis was triangulated with the questionnaire results and interview findings. Examining the primary data to evaluate the MMWUDW was essential to understand why people used mobile phones to make or follow links on the Web. The MMWUDW has three main factors. These are Mobile Web maturity, uptake and impact. The results of the SEM suggested that mobile networks, percentage of income for mobile credits, literacy and digital literacy did not affect Mobile Web uptake. In contrast, web-enabled phones, Web applications or contents, and mobile operator services strongly indicated Mobile Web maturity, which was a prerequisite for Mobile Web uptake. The uptake then created Mobile Web impact, which included both positive and negative features; ease of access to information and a convenient way to communicate; being entertained and empowered; maintaining of social cohesion and economic benefits, as well as wasting time and money, and being exposed to cyber bullying. Moreover, the research identified areas for improvement in the Mobile Web and regression equations to measure the factors and indicators of the MMWUDW. Possible future work comprises advancement of the MMWUDW and new Web Science research on the Mobile Web in developing countries. i.
(6) ii.
(7) Contents ABSTRACT .......................................................................................................................... i Contents ........................................................................................................................... iii List of tables ...................................................................................................................ix List of figures .............................................................................................................. xiii DECLARATION OF AUTHORSHIP ........................................................................ xix Acknowledgements .................................................................................................. xxi 1.. Introduction ...........................................................................................................1. 1.1. Research Questions .......................................................................... 7. 1.2. Thesis Structure ............................................................................... 8. 2.. Literature Review ............................................................................................. 11. 2.1. Web Science ................................................................................... 11. 2.2. Mobile Technologies ...................................................................... 13. 2.3. The Mobile Web in Developing Countries......................................... 17 Challenges of the Mobile Web in the Developing World ........... 18 Infrastructure .................................................................... 19 Technologies ..................................................................... 19 Content ............................................................................. 20 Ecosystem ......................................................................... 22 2.3.1.4.1 W3C MW4D Interest Group ............................................. 23 2.3.1.4.2 Information Ecology....................................................... 24 2.3.1.4.3 A Digital Ecosystem ....................................................... 26 2.3.1.4.4 Mobile Web Application Development ............................. 26 Mobile Web Stakeholders....................................................... 29. 2.4. ICT and Its Impact .......................................................................... 30 The ICT Development Index (IDI) Methodology ....................... 31 The Role of Mobile Phones on Poverty Reduction .................... 33 Impact Assessment of Mobile Phones on Development ........... 34. 2.5. 3.. Chapter Summary .......................................................................... 36. Methodology ....................................................................................................... 39. 3.1. Mixed Methods .............................................................................. 40. 3.2. Structural Equation Modelling (SEM) ................................................ 42. 3.3. Chapter Summary .......................................................................... 43 iii.
(8) 4.. Pilot Study ........................................................................................................... 45. 4.1. The Initial Model of Mobile Web Uptake in the Developing World ...... 45. 4.2. Research Support and Plan in Nairobi.............................................. 47. 4.3. Mobile Web Users from University Students ..................................... 48 Web Usage ........................................................................... 49 Web Impact .......................................................................... 52 Web Skills............................................................................. 53. 4.4 Mobile Web Users from Small-Scale Entrepreneurs in Informal Settlement Areas ..................................................................................... 54 4.5. 5.. Chapter Summary .......................................................................... 56. Expert Review .................................................................................................... 59. 5.1. Components of the Initial Model ..................................................... 59. 5.2. The Reviews .................................................................................. 62 Mobile Web Stakeholders ...................................................... 64 Developers of Mobile Web Services and Content Providers ... 64 Capacity Builders ............................................................... 65 People Working to Lower Barriers to Accessing the Mobile Web 66 Mobile Web Readiness and Supporting Enablers ..................... 67 Mobile Web Usage and Supporting Capacity (Skills) ................ 69 Mobile Web Impact ............................................................... 70. 5.3. 6. Chapter Summary .......................................................................... 71. The Model of Mobile Web Uptake in the Developing World. (MMWUDW) .................................................................................................................... 73 6.1. Mobile Web Maturity ...................................................................... 76. 6.2. Mobile Web Uptake ........................................................................ 79. 6.3. Mobile Web Impact ........................................................................ 80. 6.4. Chapter Summary .......................................................................... 82. 7. 7.1. Questionnaire Results ................................................................................... 85 Development of the Questionnaire .................................................. 85 Questionnaire Design ........................................................... 86 Questionnaire Review............................................................ 92 Ethics Approval..................................................................... 93. 7.2. Analysis of the Questionnaire ......................................................... 93 Demography of the Participants ............................................ 94 Web Usage ........................................................................... 95 Impact of Calling Using Mobile Phones, Texting and the Web 103 Correlation ......................................................................... 109 iv.
(9) T-Tests .............................................................................. 111 Regression and Analysis of Variance (ANOVA) ...................... 115 7.3. Cronbach’s Alphas (α) .................................................................. 119 Mobile Web Maturity ........................................................... 119 Mobile Web Uptake ............................................................. 125 Mobile Web Impact.............................................................. 128 Other Impact ...................................................................... 130. 7.4. 8. 8.1. Chapter Summary ........................................................................ 135. Interview Findings ........................................................................................ 139 Interviews in Rural Areas .............................................................. 139 Interviewee No 346091 .................................................... 143 Interviewee No 346112 .................................................... 145 Interviewee No 346145 .................................................... 146 Interviewee No 346382 .................................................... 148 Interviewee No 347659 .................................................... 150 Interviewee No 346926 .................................................... 153 Interviewee No 347409 .................................................... 155 Interviewee No 346709 .................................................... 158 Interviewee No 346381 .................................................... 159 Interviewee No 346660 .................................................... 159. 8.2. Interviews in Semi-Urban Areas .................................................... 161 Interviewee No 348766 .................................................... 163 Interviewee No 349744 .................................................... 164 Interviewee No 348770 .................................................... 167 Interviewee No 350600 .................................................... 171 Interviewee No 349484 .................................................... 172 Interviewee No 348805 .................................................... 174. 8.3. Interviews in Urban Areas ............................................................. 174 Interviewee No 377001 .................................................... 176 Interviewee No 353167 .................................................... 179 Interviewee No 352826 .................................................... 180. 8.4. 9.. Chapter Summary ........................................................................ 181. Structural Equation Modelling (SEM) ................................................... 185. 9.1. Model Specification ...................................................................... 185. 9.2. Data Specification and Indicator Measurements ............................. 187. 9.3. SEM Analysis ................................................................................ 191 Unstandardised estimates ................................................... 191 Standardised estimates ....................................................... 194 v.
(10) Model Fit ............................................................................ 198 9.4. Chapter Summary ........................................................................ 199. 10. The MMWUDW and the Web Index........................................................ 201 10.1. The Web Index: What It is and How It was Calculated .................. 201. 10.2. Comparisons of the MMWUDW and the Web Index ...................... 205. 10.3. Chapter Summary ..................................................................... 207. 11. Discussion ........................................................................................................ 209 11.1. Research Question .................................................................... 209. 11.2. Sub Research Question 1........................................................... 209. 11.3. Sub Research Question 2........................................................... 210. Mobile Networks, Frequency of Mobile Web Usage and Improvement...................................................................................... 211 Literacy .............................................................................. 212 Percentage of Income for Mobile Credits, Improvement and Mobile Operator Services .................................................................... 213 Digital Literacy ................................................................... 215 The Four Strong Indicators of Mobile Web Impact ................. 215 The Ten Very Strong Indicators............................................ 217 11.4. New Findings............................................................................ 221. Huge Facebook Usage, High Penetration of Facebook Mobile and Facebook Addiction ............................................................................ 221 Education to be Safe on the Web.......................................... 222 Housewife Participation in the Web ...................................... 223 11.5. Implications for Policy and Practice ............................................ 224. 11.6. Limitations of the Study ............................................................ 227 Redefining Some Indicators ................................................. 227 Mobile Web Application Development .................................. 227 Data from Other Developing Countries ................................ 228 Non-Recursive SEM with Longitudinal Data .......................... 228. 11.7. Summary .................................................................................. 228. 12. Conclusion, Research Contribution and Future Work ................ 231 12.1. Conclusion ............................................................................... 231. 12.2. Research Contribution .............................................................. 234. 12.3. Future Work.............................................................................. 238 Improvement of the MMWUDW ............................................ 238. A Model of the Ecosystem for Mobile Application Development in Emerging Economies .......................................................................... 239 New Web Science Research Topics on Mobile Social Media in the Developing World ............................................................................... 239 vi.
(11) 12.4. Final Remarks ........................................................................... 241. Appendices ................................................................................................................. 243 ....................................................................................................................245 .....................................................................................................................255 ....................................................................................................................275 ....................................................................................................................279 .....................................................................................................................291. Bibliography ............................................................................................................... 299. vii.
(12)
(13) List of tables Table 2-1 Wireless mobility data (Dornan, 2000; Smith and Collins, 2006) 14 Table 2-2 The 2G and 2.5G technologies 15 Table 3-1 Simultaneous designs of mixed methods research (Morse, 2003) 41 Table 3-2 Sequential designs of mixed methods research (Morse, 2003). 42. Table 5-1 Components, sub-components, related stakeholders and sources of the initial model 59 Table 5-2 Various types of Mobile Web capacity builders 66 Table 6-1 Indicators of Mobile Web Maturity. 77. Table 6-2 Indicator of Mobile Web Uptake 79 Table 6-3 Indicators of Mobile Web Impact. 80. Table 7-1 Questions on Mobile Web Maturity. 87. Table 7-2 Questions on Mobile Web Uptake. 88. Table 7-3 Questions on Mobile Web Impact. 89. Table 7-4 Questions on other impact Table 7-5 Demographic questions. 90. 91. Table 7-6 Spearman’s correlations among gender, age, location, occupation, frequency of Mobile Web usage, positive and negative impact of the Mobile Web 110 Table 7-7 Independent t-test results by gender 113 Table 7-8 Independent t-test results of non-students and students 114 Table 7-9 Model summary of Mobile Web frequency predicting positive impact of the Mobile Web. 115. Table 7-10 ANOVA of Mobile Web frequency predicting positive impact of the Mobile Web 116 ix.
(14) Table 7-11 Model coefficients of Mobile Web frequency predicting positive impact of the Mobile Web. 116. Table 7-12 Model summary of Mobile Web frequency predicting negative impact of the Mobile Web. 117. Table 7-13 ANOVA of Mobile Web frequency predicting negative impact of the Mobile Web 118 Table 7-14 Model coefficients of Mobile Web frequency predicting negative impact of the Mobile Web. 118. Table 7-15 Reliability statistics of Mobile Web Maturity. 119. Table 7-16 Item-total statistics of Mobile Web Maturity. 120. Table 7-17 Reliability statistics of Mobile Web Uptake. 125. Table 7-18 Item-total statistics of Mobile Web Uptake. 126. Table 7-19 Reliability statistics of Mobile Web Impact. 129. Table 7-20 Item-total statistics of Mobile Web Impact. 129. Table 7-21 Reliability statistics of Other Impact 130 Table 7-22 Item-total statistics of Other Impact Table 8-1 Quotes from interviewee no 346091 143 Table 8-2 Quotes from interviewee no 346112 145 Table 8-3 Quotes from interviewee no 346145 146 Table 8-4 Quotes from interviewee no 346382 149 Table 8-5 Quotes from interviewee no 347659 152 Table 8-6 Quotes from interviewee no 346926 154 Table 8-7 Quotes from interviewee no 347409 155 Table 8-8 Quotes from interviewee no 346709 158 Table 8-9 Quotes from interviewee no 346381 159 x. 131.
(15) Table 8-10 Quotes from interviewee no 346660. 160. Table 8-11 Quotes from interviewee no 348766. 163. Table 8-12 Quotes from interviewee no 349744. 165. Table 8-13 Quotes from interviewee no 348770. 169. Table 8-14 Quotes from interviewee no 350600. 171. Table 8-15 Quotes from interviewee no 349484. 173. Table 8-16 Quotes from interviewee no 348805. 174. Table 8-17 Quotes from interviewee no 377001. 178. Table 8-18 Quotes from interviewee no 353167. 179. Table 8-19 Quotes from interviewee no 352826. 180. Table 9-1 Unstandardised regression weights 191 Table 9-2 Standardised regression weights Table 9-3 CMIN (minimum discrepancy). 194. 199. Table 10-1 Web Index snapshot and countries grouped by (World Bank Group, 2012a, 2012b; World Wide Web Foundation, 2012d). 201. Table 10-2 Web Index tree diagram (The World Wide Web Foundation 2012e) 206 Table D-1 Association between indicators of Mobile Web Maturity in the MMWUDW, the questionnaire (Q) or interviews (I), and related calculations 279 Table D-2 Association between indicators of Mobile Web Uptake in the MMWUDW, the questionnaire (Q) or interviews (I), and related calculations 285 Table D-3 Association between indicators of Mobile Web Impact in the MMWUDW, the questionnaire (Q) or interviews (I) and related calculations 286. xi.
(16)
(17) List of figures Figure 1-1 Penetration of Internet users in the world and by level of development (2000-2010) (ITU, 2011a). 1. Figure 1-2 Penetration of active mobile broadband subscriptions in the world and by level of development (2007-2010) (ITU, 2011a). 3. Figure 1-3 Penetration of fixed broadband subscriptions in the world and by level of development (2000-2010) (ITU, 2011a) 3 Figure 1-4 Mobile phone penetration in the world and by level of development (2000-2010) (ITU, 2011a) 4 Figure 1-5 Top ten countries with the highest Facebook mobile penetration (Socialbakers, 2012). 6. Figure 1-6 Facebook mobile penetration of the ten biggest Facebook countries (Socialbakers, 2012). 6. Figure 2-1 The interplay of social interactions, Web applications and Web infrastructure (Hendler et al., 2008). 12. Figure 2-2 New challenges to software engineering and application development presented by the Web (Hendler et al., 2008). 13. Figure 2-3 Global mobile technology market share in 2009 (GSM Association, 2009) 16 Figure 2-4 2G and 3G subscriptions (ITU, 2010a). 16. Figure 2-5 Mobile technologies evolution, modified from (GSM Association, 2007; Smith and Collins, 2006) 17 Figure 2-6 Challenges of the Mobile Web for social development, adapted from (Boyera, 2009c) 19 Figure 2-7 Top nine languages by number of native speakers (Bratt, 2010; Wikipedia, 2011) 21 Figure 2-8 Top 10 languages on the Internet 2010 in millions of users (Internet World Stats, 2010) 21 xiii.
(18) Figure 2-9 An example of a chatting conversation on Mxit (Web AddiCT(s), 2011) 22 Figure 2-10 Resources contributing to ICT access, adapted from (Warschauer, 2004) 25 Figure 2-11 Conceptual model for the community and digital ecosystem (Karhu et al., 2009). 26. Figure 2-12 Mobile browser market share (icrossing, 2010). 28. Figure 2-13 Communication between a mobile device and Web server (Firtman, 2010) 29 Figure 2-14 Stakeholders of the Mobile Web in the developing world, adapted from (Boyera, 2009a, 2009c). 30. Figure 2-15 Three stages in the evolution towards an information society (ITU, 2010b, 2009). 31. Figure 2-16 Indicators and methodology to construct the ICT Development Index (IDI) (ITU, 2010b, 2009). 33. Figure 2-17 m-Development impact value chain (Duncombe, 2009) 34 Figure 2-18 Conventional model of Impact Assessment (Duncombe, 2009) 35 Figure 3-1 Methodologies used in this research 39 Figure 4-1 The initial model of Mobile Web uptake in the developing world 45 Figure 4-2 Participants from university students. 48. Figure 4-3 Area of study of questionnaire participants Figure 4-4 The first access to the Web. 49. 50. Figure 4-5 Frequency of Mobile Web access. 50. Figure 4-6 What and how the participants accessed the Web. 51. Figure 4-7 Web impact as level of dependency on Web applications 53 xiv.
(19) Figure 4-8 Skills to develop Web applications. 53. Figure 4-9 Participants from entrepreneurs from informal settlement areas 54 Figure 4-10 Mobile Movement empowered Victorious bone crafters 55 Figure 6-1 Overview of the Model of Mobile Web Uptake in the Developing World (MMWUDW). 73. Figure 6-2 The Model of Mobile Web Uptake in the Developing World (MMWUDW) in detail. 74. Figure 7-1 Percentages of participants’ living areas 94 Figure 7-2 Percentages of participants’ gender 94 Figure 7-3 Percentages of participants’ age groups in years. 94. Figure 7-4 Percentages of participants’ occupations 95 Figure 7-5 When participants accessed the Web for the first time. 96. Figure 7-6 Frequency of Web usage using mobiles and computers. 97. Figure 7-7 Usage frequencies of emails, search engines, Internet banking, online shopping, social media, chatting, micro blogs and downloading music, pictures or videos using mobiles 99 Figure 7-8 Usage frequencies of blogs, Wikipedia, maps, online videos, online games, online gambling, Internet dating and online horoscopes using mobiles. 102. Figure 7-9 Positive impact of calling, texting and the Mobile Web. 103. Figure 7-10 Negative impact of calling, texting and the Mobile Web 104 Figure 7-11 Impact of emails, search engines, Internet banking, online shopping, social media, chatting, micro blogs, as well as downloading music, pictures or videos using computers and mobiles. 106. xv.
(20) Figure 7-12 Impact of blogs, Wikipedia, maps, online videos, online games, online gambling, Internet dating and online horoscopes using computers and mobiles. 108. Figure 8-1 Lampung province, Indonesia (Wikipedia, 2007). 140. Figure 8-2 Wonosobo village, Lampung province, Indonesia. 140. Figure 8-3 Pancasila village, Lampung province, Indonesia 141 Figure 8-4 An interview in Pancasila village with a Livescribe pen. 141. Figure 8-5 A Web enabled phone used to access free 0.facebook.com Figure 8-6 SMS banking on BlackBerry. 147. 148. Figure 8-7 A cheap and stylish Chinese phone that enable Mobile Web usage 160 Figure 8-8 Central Jakarta (A), Panongan (B) and Tigaraksa (C) 162 Figure 8-9 XL plan for ‘Free Facebook Forever’ (Kalimas, 2012) 168 Figure 8-10 Interview with a housewife in Panongan with a Livescribe pen 173 Figure 8-11 Residences of interviewees in Greater Jakarta 175 Figure 8-12 Mobile market shares in Indonesia in 2010 (BPS, 2012) 177 Figure 9-1 Input path diagram 186 Figure 9-2 Unstandardised output path diagram Figure 9-3 Standardised output path diagram. 193. 196. Figure 10-1 Sub-index scores of the Web Index (Farhan et al., 2012) 204 Figure 11-1 Percentages of mobile network quality. 211. Figure 11-2 Percentage of income used for Mobile Credits 213 Figure 12-1 Summary of research to develop and evaluate the MMWUDW 233 Figure C-1 Percentages of participants’ highest education 275 Figure C-2 Percentages of participants’ monthly income or pocket money 275 xvi.
(21) Figure C-3 Percentages of participants’ monthly mobile credits 276 Figure C-4 Percentages of participants’ mobile phones owned or used in the six last months 276 Figure C-5 Percentages of participants’ SIM cards owned or used in the last six months 276 Figure C-6 Percentages of Mobile Web impact: information and communication 277 Figure C-7 Percentages of Mobile Web impact: economic benefits. 277. Figure C-8 Percentages of Mobile Web impact: waste money and waste time 278. xvii.
(22)
(23) DECLARATION OF AUTHORSHIP I, Betty Purwandari declare that the thesis entitled DEVELOPING A MODEL OF MOBILE WEB UPTAKE IN THE DEVELOPING WORLD and the work presented in the thesis are both my own, and have been generated by me as the result of my own original research. I confirm that: . this work was done wholly or mainly while in candidature for a research degree at this University;. . where any part of this thesis has previously been submitted for a degree or any other qualification at this University or any other institution, this has been clearly stated;. . where I have consulted the published work of others, this is always clearly attributed;. . where I have quoted from the work of others, the source is always given. With the exception of such quotations, this thesis is entirely my own work;. . I have acknowledged all main sources of help;. . where the thesis is based on work done by myself jointly with others, I have made clear exactly what was done by others and what I have contributed myself;. . parts of this work have been published as: 1. The 2nd Web Science Conference in Raleigh, North Carolina (Purwandari et al. 2010a) 2. The 3rd Web Science Conference in Koblenz, Germany (Purwandari et al. 2011). 3. A Wiki of the W3C MW4D interest group (Purwandari et al. 2010b). The group members also give comments on the model by participating in mailing list and teleconferences.. xix.
(24) Signed: Betty Purwandari Date: 24 September 2013. xx.
(25) Acknowledgements I sincerely thank Prof Dame Wendy Hall, Dr Gary B Wills, Prof David C de Roure and Prof Catherine Pope, whose suggestions and guidance helped me in my research. I also appreciate Ms Jane Morgan’s for her fantastic support. I acknowledge the Schlumberger Foundation, the Ministry of National Education Republic of Indonesia, the University of Indonesia, and the University of Southampton for sponsoring my study. I also thank the Web Foundation and the Web Science Trust which helped me attending conferences and workshops. I have had the good fortune to have encouragement from Prof T. Basaruddin, Prof Heru Suhartanto, Dr Mirna Adriani, Dr R. Yugo K. Isal, Dr Petrus Mursanto, Dr Bobby A. Nazief, Dr Bob Hardian and all staffs at the University of Indonesia. I express my gratitude to Mr Stéphane Boyera, Dr Wallace Chigona and Dr Max Froumentin for reviewing the initial model. My thanks extend to Prof Henrietta Moore, Mr Gordon Omeya, Ms Connie Smith, Dr Nicholas Long, and the British Institute in Eastern Africa (BIEA), who helped me organise the pilot study in Nairobi, Kenya. I am grateful to have tremendous support from Mrs Cindy Tumbelaka, Mr Rudolf Tumbelaka, Miss Cece da Costa, Mr Subur, Mrs Puji, Ms Dina Chahyati, Mr Frans Sahetapy and Mrs Ida Broadway to undertake the fieldwork in Indonesia. I also thank all participants taken part in the pilot study and fieldwork. My thanks extend to Miss Jarutas Pattanaphancai, Miss Norhidayah Azman, Dr Whysnianti Basuki, Mr Gunawan Wibisono, Dr Dade Nurjanah, Mr Iwan Syarif, Ms Tessy Badriyah, Dr Iwan Prasetiyo, Mrs Yeny Prasetiyo, Mr M. Agus Junaidi, Ms Sri Suhartini, Kang Ardhy Sitorus, the Ralphs, Mr Mark Schueler, Dr Colin Williams, Dr Harry Rose, Miss Iman Nadja, Mr Moody Alam, Miss Pareecha Rattanasiri, Miss Van Nguyen, Miss Lucie Xia, Dr Jennifer Bute, the late Mr Stanley Bute, Dr Kenneth Heard, Mrs Jill Heard, Ms Rosie Lubman, Mr Malcolm Harvey, Miss Valda White, Mrs Marie Taylor, Mr Robin Yendell, Mrs Janet Yendell and Mrs Margaret Dudley. Thanks a lot for the great company and taking a good care of me. Most of all, I thank my dad, my mom, my mother-in-law, my sister, my brother, my sister-in-laws, my brother-in-laws, my dearest husband, my brave son and daughter. I dedicate this thesis to you. xxi.
(26) xxii.
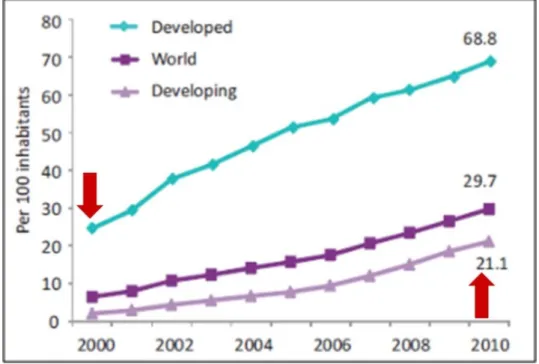
(27) Chapter 1 Introduction. 1. Introduction This thesis presents a model of the maturity and uptake of the Mobile Web in the developing world, and discusses the impact it is having in this area. First, it is essential to understand the value of the Mobile Web in emerging economies, which then triggers the research questions. Later it presents how the model was developed and evaluated to address the research questions. This research was motivated by the significance of the Mobile Web in the developing world, where over 80% of the world’s population lives (Population Reference Bureau, 2011). However, the penetration of Internet users in this part of the world has always been much lower than that in the developed world, as shown in Figure 1-1 (ITU, 2011a).. Figure 1-1 Penetration of Internet users in the world and by level of development (2000-2010) (ITU, 2011a) A red arrow on the right of Figure 1-1 indicates that, in 2010, there were around 21 people per 100 inhabitants in developing countries who had access to the Internet. It was even lower than the Internet penetration in the developed world 10 years beforehand. In 2000 there were approximately 25 Internet users per 100 inhabitants in developed economies, as indicated by a red arrow on the left of Figure 1-1. This clearly shows a huge digital divide. As a result, the possible benefits of Internet access are much more limited in developing economies than they are in developed economies. 1.
(28) Chapter 1 Introduction There is widespread belief that the Internet and the World Wide Web (WWW), or the Web, are the same; however there are significant differences between them that need to be clarified. The Internet is a networking infrastructure with the Transmission Control Protocol and Internet Protocol (TCP/IP) as its most important protocols (Kurose and Ross, 2010). The Internet provides services to various distributed applications, such as remote login, the Web, Voice-over-IP (VoIP), Peer-to-Peer (P2P) file sharing and television over the Internet; whereas the World Wide Web using the Hyper Text Transfer Protocol (HTTP) is only one instance of distributed applications travelling over the Internet. How do people access the Internet? Originally, they used fixed broadband (ITU, 2011a). Fixed or wired broadband subscriptions mean subscriptions to access the public Internet with minimum downstream speeds of 256 kbps. This comprises the cable modem, Digital Subscriber Line (DSL), fibre network and Ethernet Local Area Network (LAN). In the early 2000s mobile broadband emerged as an alternative to making Internet connections (Smith and Collins, 2006). Active mobile broadband subscriptions refer to subscriptions to Internet access via mobile cellular networks (ITU, 2011a). These include mobile cellular subscriptions with minimum advertised data speeds of 256 kbps, which have been utilised to set up an Internet or IP connection in the last three months and permit access to the Internet via the HTTP. The Standard Short Message Service (SMS) and Multimedia Messaging Service (MMS) are excluded from active Internet connections, although they may be sent via the IP. Another type of active mobile broadband subscription is dedicated data services over mobile networks separated from voice services. These can be standalone services using Universal Serial Bus (USB) modems/dongles, or additional subscriptions to voice services. Since 2010 active mobile broadband penetration has been higher than fixed broadband penetration in the world, in both developed and developing economies (ITU, 2011a). These trends are demonstrated in Figure 1-2 and Figure 1-3. In 2010 the corresponding penetrations in the world were 12.6% (mobile) and 7.6% (fixed) globally. Of these, developed countries accounted for 46.2% and 23.6% of penetration respectively, while the developing world only accounted for 5.3% and 4.2%. 2.
(29) Chapter 1 Introduction. Figure 1-2 Penetration of active mobile broadband subscriptions in the world and by level of development (2007-2010) (ITU, 2011a). Figure 1-3 Penetration of fixed broadband subscriptions in the world and by level of development (2000-2010) (ITU, 2011a) In all the three categories discussed above (penetration of Internet users, active mobile and fixed broadband subscriptions), the developing world always lags far behind the developed world (ITU, 2011a). This impedes people in. 3.
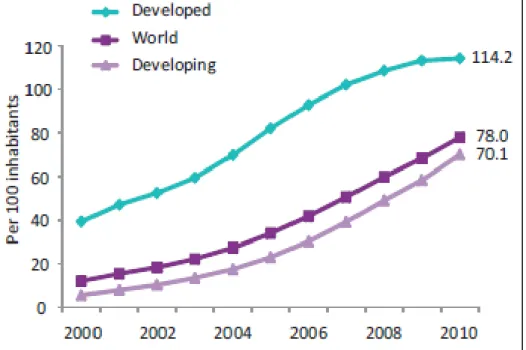
(30) Chapter 1 Introduction developing countries from accessing the Web, since the Internet is a crucial infrastructure for accessing the Web. It is estimated that only 25% of people around the globe use the Web, although the Web was invented over 20 years ago by Tim Berners-Lee (World Wide Web Foundation, 2012a, 2012b). This is a big loss to the estimated remaining 75%, because the Web is widely considered by academicians and practitioners to be the most powerful source of information compared to the radio, television, printed news and magazines. For this reason, Berners-Lee and his colleagues at the World Wide Web Foundation, as well as other Web researchers and practitioners have been working to break down the barriers and boost the full potential of the World Wide Web.. Figure 1-4 Mobile phone penetration in the world and by level of development (2000-2010) (ITU, 2011a) It seems promising to deal with these challenges by harnessing the ‘mobile miracle’ (ITU, 2011a). This refers to the remarkable expansion of mobile phone penetration in emerging economies, as illustrated in Figure 1-4. This involves post-paid subscriptions and prepaid Subscriber Identity Module (SIM) cards, which provide voice communications and have been active in the last three months. However, the figures do not account subscriptions via USB modems/dongles.. 4.
(31) Chapter 1 Introduction Figure 1-4 shows that, over the last decade, there has been a steep rise in subscriptions for mobile cellular telephones in the developing world, and this trend is continuing. On the other hand, since 2007 penetration in the developed world has reached 100% and it has grown very slowly. It indicates the saturation of mobile telecommunication markets in developed countries, along with a huge number of potential subscribers in developing countries. This can be seen as a fortune at the bottom of the pyramid (Bhavnani et al., 2008). As a consequence, mobile operators and service providers are increasingly competing in emerging economies. This has made mobile communications more available to and affordable for the developing world. Initially, people in developing economies used mobile phones merely for audio or text communications. However, as the market matured, Web-enabled phones have become cheaper (Firtman, 2010). It has also been reported that there has been an increase in smartphone ownership in emerging economies (ITU, 2012). Furthermore, mobile operators have offered more reasonable tariffs for data communications, which in turn can make Internet browsing up to 1,000 times cheaper per character than sending texts (Boyera, 2009a; Boyera, 2009b). These innovations have enabled people in the developing world to use their mobile phones to access the Internet and the World Wide Web, which is called the Mobile Web or Mobile Internet (PC Magazine, 2012). In the light of increased Internet and Web access, users are encouraged to join social media like Facebook via their mobile phones. Figure 1-5 demonstrates the top 10 countries with the highest Facebook mobile penetration in 2012 (Socialbakers, 2012). It is interesting that eight out of these 10 countries belong to emerging economies (World Bank Group, 2012a). They are Swaziland (92.5%), Nigeria (87.9%), Papua New Guinea (85.3%), South Africa (84.5%), Botswana (82.8%), Malawi (81.5%), Namibia (80.9%) and Lesotho (80.6%). Moreover, six out of the 10 countries with the largest Facebook penetration in 2012 are part of the developing world, as illustrated in Figure 1-6. These 6 countries, with their Facebook mobile penetration percentages, are Indonesia (67.7%), Mexico (57.6%), India (54.5%), Turkey (45.1%), the Philippines (37.3%) and Brazil (37%). The developing countries in both figures are indicated by red arrows.. 5.
(32) Chapter 1 Introduction. Figure 1-5 Top ten countries with the highest Facebook mobile penetration (Socialbakers, 2012). Figure 1-6 Facebook mobile penetration of the ten biggest Facebook countries (Socialbakers, 2012) 6.
(33) Chapter 1 Introduction There are also Mobile Web applications or contents that can allow people in developing economies to have better lives. Various case studies have been documented and analysed by the World Wide Web Consortium (W3C) — Mobile Web for Social Development (MW4D) Interest Group (W3C, 2011). Several empowering Mobile Web projects have been conducted by the World Wide Web Foundation (World Wide Web Foundation, 2012c), as well as by other Web researchers and practitioners around the globe. Examples are m-education (Isaacs, 2012; Vosloo and Botha, 2009), m-health (Parker et al., 2012, 2010), m-agriculture (Akkermans et al., 2011a, 2011b; ITU, 2011b), m-commerce (Mobile Movement, 2010), m-banking (Must and Ludewig, 2010) and mgovernment in Africa, Asia and the Latin Americas (Zefferer, 2011). The Mobile Web has become very important in developing countries, because mobile phones can be the only available means of accessing the Internet and the Web, as well as of enabling users in these countries to be part of the global information society (Bhavnani et al., 2008; Boyera, 2010; Hellström, 2009). This development has been triggered by scarce and expensive investment in other Information and Communications Technologies (ICTs), such as landline phones, Personal Computers (PCs) and fixed broadband Internet. In contrast, mobile communications offer affordability and flexibility through cheap handsets and various payment methods. Nevertheless, the Web and the Mobile Web must be improved to better serve their users in the developing world with their unique characteristics, such as limited infrastructures, local languages, character sets, contents and cultures (Boyera, 2009a, 2009b; Dearden, 2009). These challenges have become critical for this segment of the world’s population, because the Web has been mainly designed by the developed world for the developed world (Berners-Lee, 2008).. 1.1 Research Questions Despite the ‘mobile miracle’ in emerging countries (Figure 1-4) and importance of the Mobile Web, these countries still experience very low Internet penetration (Figure 1-1), fewer active mobile broadband subscriptions (Figure 1-2) and less Web usage (ITU, 2011a). Hence, it is crucial to comprehend how the Mobile Web has been disseminated in this part of the world. An understanding of this situation can lead to suggestions about what should be done to improve Mobile Web adoption in developing economies. In addition, it is essential to study the impact of the Mobile Web on people’s lives 7.
(34) Chapter 1 Introduction in emerging economies, as well as the impact on technologies related to the Mobile Web. This knowledge can help Web scientists and practitioners to anticipate the impact of the Mobile Web in the future. In order to deal with these challenges, the following research question is raised. “What is a suitable model for Mobile Web uptake and its impact in the developing world?” This model constructed to address this question is a hypothesised theoretical model, consisting of abstract phenomena related to Mobile Web adoption. These abstract phenomena are also called unmeasured concepts, theoretical constructs, latent variables or factors (Byrne, 2010a; Hair et al., 2010). Most unmeasured concepts or factors are better represented by multiple measurements to reduce measurement errors for these concepts. Furthermore, this increases statistical estimations of the relationships between concepts. Thus, all unmeasured concepts or factors can be characterised by measured variables or indicators, which are brought together from various methods of data collection, such as questionnaires and interviews. Consequently, the above research question generates two sub-questions in the context of developing countries. 1. “What are the factors or unmeasured variables of the model?” 2. “What are the indicators or measured variables of each factor in the model?”. 1.2. Thesis Structure. This thesis consists of 12 chapters. It starts with an introduction in Chapter 1, which provides background information on the significance of the Mobile Web in emerging economies. This initiates the research question and subquestions. In order to respond to these questions, a model was created in this PhD as part of Web Science research that studies the Web as a whole (Berners-Lee et al., 2006a, 2006b; Hall et al., 2009; Hendler et al., 2008; Shadbolt and BernersLee, 2008). Therefore, this model’s development required an understanding of various areas, including mobile technologies, the Mobile Web in emerging. 8.
(35) Chapter 1 Introduction countries and the adoption of ICT, as well as its impact on the developing world. A literature review on these topics is presented in Chapter 2. Tim Berners-Lee emphasised that the Web does not only connect machines; more importantly, the Web connects people (Berners-Lee, 2008). It is people who decide which hyperlink to follow. For this reason, this research tried to understand people’s desires and what leads to them using the Mobile Web, and the impact of this. Their opinions were gathered using questionnaires and interviews. These processes triangulated concepts that were identified from the literature review. Chapter 3 describes the methodologies used in this research. It embraces mixed methods, which involve quantitative and qualitative research methodologies. The quantitative method was applied in conducting and analysing the questionnaires from a pilot study in Kenya and fieldwork in Indonesia. In addition, a qualitative method was required to gather and analyse interview data from the pilot study, expert reviews and the fieldwork data. Chapter 3 also discusses the Structural Equation Modelling (SEM), which was used to evaluate the model produced in this research. Chapter 4 explains the pilot study undertaken in Nairobi, Kenya in 2010. The objective of this pilot study was to examine the research instruments, which comprised a questionnaire and a semi-structured interview. These research instruments were created as a result of the literature review in Chapter 2. The results from this pilot study were harnessed to elaborate on the research instruments for the fieldwork. The results were used to triangulate the model of Mobile Web uptake in emerging economies. Chapter 5 discusses expert reviews of an initial model of Mobile Web uptake. The expert reviews are part of the triangulation method for creating the model. Four experts helped review the initial model: Mr Stéphane Boyera and Dr Max Froumentin from the Web Foundation; Dr Wallace Chigona from the Department of Information Systems at the University of Cape Town, South Africa, and Professor Dame Wendy Hall from the Web Science Trust and University of Southampton, who also provided a review from the Web Science perspective. Chapter 6 presents the Model of Mobile Web Uptake in the Developing World (MMWUDW). This is a hypothesised theoretical model based on the literature 9.
(36) Chapter 1 Introduction review, pilot study and expert reviews, and the model that would be tested in Indonesia. Chapter 7 discusses the development and results of the questionnaires, which were answered by 133 participants in urban, semi-urban and rural areas in Indonesia in 2012. These followed the application of quantitative research methods that comprised descriptive and inferential statistics. Chapter 8 explores the interviews with 103 interviewees in Indonesia and discusses the findings. It includes a thematic analysis of the interviews in order to reveal human stories behind the questionnaire results. Chapter 9 explains how the SEM is used to examine the MMWUDW, using questionnaire and interview data from Indonesia. SEM determined the significant and non-significant factors and indicators in the MMWUDW. SEM also produced regression equations describing the MMWUDW. Chapter 10 examines how the Web Index, which was published by the World Wide Web Foundation in September 2012, relates to this research (Farhan et al., 2012). Chapter 11 is a holistic discussion on the questionnaire results, interview findings and SEM analysis. Finally, this thesis ends with the conclusion, research contribution and suggestions for future work in Chapter 12.. 10.
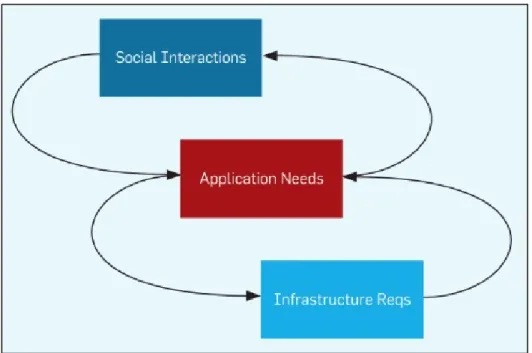
(37) Chapter 2 Literature Review. 2. Literature Review This chapter explains the literature review that was undertaken in order to develop a model of Mobile Web uptake in emerging economies. The discussion consists of areas in Web Science, mobile technologies, the Mobile Web in developing countries, and ICT and its impact.. 2.1. Web Science. Although the Web has significantly influenced human life and computer science, it remains understudied as an entity. Therefore Web Science has emerged as a new interdisciplinary approach to study the Web as its primary object (Berners-Lee et al., 2006a, 2006b; Hall et al., 2009; Hendler et al., 2008; Shadbolt and Berners-Lee, 2008). The exploration is pioneered by the Web Science Research Initiative (WSRI), which was launched in 2006 (The Web Science Trust, 2009). This was a joint initiative between the Massachusetts Institute of Technology (MIT), Computer Science and Artificial Intelligence Laboratory (CSAIL) and the University of Southampton, School of Electronics and Computer Science (ECS). The WSRI aimed to coordinate and support the study of the World Wide Web. Later the University of Southampton became the host of the Web Science Trust (WST), which is a charity, and which operates independently of the WSRI. The WST has a goal to support the global development of Web Science. In order to achieve this goal, it is crucial to understand the interplay of social interactions, Web applications and Web infrastructure as illustrated in Figure 2-1 (Hendler et al., 2008). The arrows on the right of the figure show that the Web requires infrastructure such as computer networks, Web architecture, protocols and data. The infrastructure enables the Web to be scalable and open applications. Furthermore, the use of Web applications facilitates tremendous social interactions. The arrows on the left demonstrate that the social interactions can generate new application needs, as well as novel infrastructure requirements. Then the interplay continues and creates a life cycle, which must be studied as a whole by Web Scientists.. 11.
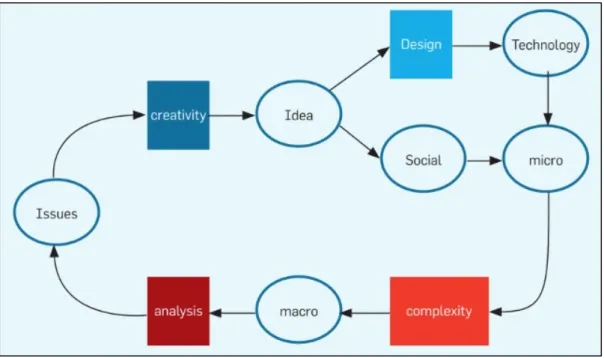
(38) Chapter 2 Literature Review. Figure 2-1 The interplay of social interactions, Web applications and Web infrastructure (Hendler et al., 2008) The Web also drives a new software engineering method to develop Web applications, which are designed based on available supporting technologies with a social construct (see Figure 2-2). Clearly, Web applications are not developed for just a single machine or a single user. The applications are tested by a small group or deployed on limited users, who test the applications’ micro properties. Following this, some Web applications, such as Mosaic, Flickr, YouTube, Facebook, or Twitter are widely accepted by remarkable numbers of global users, thus moving from a micro- to a macrosystem generating far more complex social interactions, which are often unpredictable. The impact or effect of the Web on the macro scale is very interesting and important to explore, since it can produce new challenges, opportunities, or even threats for the Web and society. The processes form a life cycle that also applies to Mobile Web supply and demand. Mobile Web stakeholders, who consist of mobile operators, mobile phone manufacturers, researchers, academics, standardisation organisations, governments, donors, and Non-Government Organisations (NGOs), supply Mobile Web solution to Mobile Web users on a micro scale. The subsequent Mobile Web use can trigger feedback and new demands towards its use at the macro scale, which should be analysed to produce more suitable Mobile Web supply. These stakeholders will be further discussed in section 2.3.2. 12.
(39) Chapter 2 Literature Review. Figure 2-2 New challenges to software engineering and application development presented by the Web (Hendler et al., 2008). 2.2. Mobile Technologies. In 1978 the first generation (1G) of mobile communications was tried in Chicago, USA (Smith and Collins, 2006). Its technology is known as the Advanced Mobile Phone Service (AMPS). A year later it was commercially launched in Japan. Then in 1983 the first European system was released in Sweden, Norway, Denmark and Finland; this system was called the Nordic Mobile Telephony (NMT). In the same year, commercial AMPS was launched in Chicago, USA. Surprisingly, mobile voice communication provided by the firstgeneration systems was well accepted in many parts of the developed world; to a greater extent than anyone had expected. However, the systems were analogue, and inherently had several drawbacks. They could not cope with millions of subscribers, they were prone to fraud and they could only offer limited services. The Mobile Web was definitely not supported by the firstgeneration systems. These problems were addressed by the digital second-generation systems (2G). One of the second-generation technologies was the Code Division Multiple Access (CDMA), which was demonstrated by Qualcomm in San Diego, California in 1989. Nevertheless, it took four years before the US Telecommunications Industry Association (TIA) standardised the Qualcomm 13.
(40) Chapter 2 Literature Review CDMA system as Interim Standard 95 (IS-95). In fact, CDMA was far less popular compared to another second-generation technology called the Global System for Mobile communications (GSM), which was launched for the first time in 1991 (GSM Association, 2009; Smith and Collins, 2006). The 2G technologies and their data capabilities are listed in Table 2-1. Table 2-1 Wireless mobility data (Dornan, 2000; Smith and Collins, 2006) Generation. Time of. Technology. Data Capability. Introduction 2G. Late 1980s-early 1990s. 2.5G. Early 2000s. GSM. 9.6/14.4 kbps. CDMA. 9.6/14.4 kbps. GPRS. 128 kbps. EDGE. 384 kbps. CDMA2000-. 144 kbps. 1XRTT 3G. Late 1990s-early 2000s. WCDMA TD-CDMA TD-SCDMA. 144 kbps vehicular 384 kbps outdoors 2 Mbps indoors. CDMA2000EVDO/EVDV. Although the second-generation systems successfully overcame essential weaknesses in the previous generation, they were not well-suited to data communications such as the Mobile Web. This turned out to be a serious shortcoming, because mobile subscribers wanted to access services on the Internet from their mobiles. Therefore a third-generation system was needed. The ITU showed a great deal of interest in the development of the thirdgeneration (3G) systems. It happened as early as 1992, when they set up the International Mobile Telecommunications-2000 (IMT-2000) (Dornan, 2000). It 14.
(41) Chapter 2 Literature Review led to several recommendations; for example, 144kbps bandwidth for mobile service (Smith and Collins, 2006). In 1999 the Wideband CDMA (WCDMA), Time Division-CDMA (TD-CDMA), Time Division-Synchronous CDMA (TD-SCDMA) and CDMA2000 were selected by the ITU as third-generation technologies. Later, the WCDMA was enhanced to the High Speed Downlink Packet Access (HSDPA) and the High Speed Uplink Packet Access (HSUPA). The CDMA2000 includes the Evolution Data Optimised (EVDO) and Evolution for Data and Voice (EVDV). In order to bridge between the 2G systems and the envisioned 3G systems, the 2.5G systems were needed. All 2G technologies used circuit-switched data, whilst all 3G technologies used packet data. The 2.5G allowed mobile operators to set up digital packet services before the 3G platforms were available. The General Packet Radio Service (GPRS), Enhanced Data Rates for Global Evolution (EDGE) and Code Division Multiple Access (CDMA2000 1xRTT) were leading 2.5G technologies. Table 2-1 shows various 2.5G and 3G technologies and data capabilities, whereas Table 2-2 below demonstrates examples of bridging steps from the 2G to the 3G using the 2.5G technology. Table 2-2 The 2G and 2.5G technologies 2G. 2.5G Technology. Migration to 3G. Technology GSM. Platform GPRS/EDGE. WCDMA/TD-CDMA / TD-SCDMA/. CDMA. CDMA2000. EVDO and EVDV. (1xRTT). Regarding all mobile technologies discussed above, the GSM Association claimed that the GSM significantly dominated the global mobile technology market shares in 2009 (GSM Association, 2009). Figure 2-3 shows that 80.4% of the market used the GSM, whereas only 10.3% chose the CDMA, 6.7% opted for the W-CDMA, and 1.9% opted for the W-CDMA HSPA.. 15.
(42) Chapter 2 Literature Review. Figure 2-3 Global mobile technology market share in 2009 (GSM Association, 2009) Moreover, the ITU estimated that by the end of 2010, the 2G, including the 2.5G, still dominated mobile cellular subscriptions, as shown Figure 2-4 (ITU, 2010a). It was estimated that there would be around 4.36 billion 2G subscriptions, which were equal to approximately 82% of the total mobile cellular subscriptions. It was also reported that 90% of the world population and 80% of people in rural areas would have access to mobile networks.. Figure 2-4 2G and 3G subscriptions (ITU, 2010a). 16.
(43) Chapter 2 Literature Review Although 3G penetration was still low in 2010, this did not hinder Mobile Web uptake. The GPRS that belonged to the 2.5G (Table 2-1) was minimum mobile networks requirement for the Mobile Web (Boyera, 2009a, 2009c; Firtman, 2010). The GPRS is based on the GSM, so wide coverage of the GSM shows potential use of the Mobile Web. As a summary, the evolution of mobile technologies is illustrated in Figure 2-5.. Figure 2-5 Mobile technologies evolution, modified from (GSM Association, 2007; Smith and Collins, 2006). 2.3. The Mobile Web in Developing Countries. The Web was fully demonstrated in 1990 by Tim Berners-Lee and Robert Cailliau (Fischetti, 2009). On the other hand, mobile technologies have been evolving since they were introduced for the first time in the late 1970s as discussed in section 2.2. Figure 2-5 shows that since the early 2000s people have start accessing the Web from mobile devices, which is called the Mobile Web or Mobile Internet. However, it had been considered as a second-class experience compared to accessing the Web from computers (W3C, 2005). In order to improve Web access from a mobile device to be as simple, easy, and 17.
(44) Chapter 2 Literature Review convenient as its access from a desktop device, the W3C launched the Mobile Web Initiative (MWI) in Chiba, Japan on 11 May 2005. The Mobile Web has become very crucial in developing countries because, for many, mobile phones can be the only available means to access the Web (Bhavnani et al., 2008; Boyera, 2010; Hellström, 2009). This demand is triggered by scarce and expensive investment for other ICTs, such as landline phones, PCs, and fixed broadband Internet. In contrast, mobile communications offer affordability and flexibility through cheap handsets and various payment methods. Nevertheless, the Web and the Mobile Web must be modified to serve users in the developing world with their unique characteristics, such as limited infrastructure, local languages, character sets, contents and culture (Boyera, 2009a, 2009c; Dearden, 2009).This is crucial because the Web has been mainly designed by the developed world for the developed world (Berners-Lee, 2008). Therefore, the W3C organised a workshop on the Mobile Web in Developing Countries on 5-6 December 2006 in Bangalore, India. It led to the setup of a W3C interest group called the Mobile Web for Social Development (MW4D). The main objective of this group is to understand the obstacles preventing people in emerging economies accessing the Mobile Web, as well as the barriers facing by potential service providers developing and deploying Mobile Web contents and applications (Boyera, 2010, 2008a). The group is chaired by Mr Stéphane Boyera from the Web Foundation and Mr Ken Banks from kiwanja.net. Challenges of the Mobile Web in the Developing World The M3W MW4D held its second workshop on 2-3 June 2008 in São Paulo, Brazil; and the third one was held on 1-2 April 2009 in Maputo, Mozambique. During the last workshop there were presentations and discussions on challenges faced by the Mobile Web in fostering social and economic development in emerging economies. These challenges were documented in the workshop report (Boyera, 2009c) and illustrated in Figure 2-6.. 18.
(45) Chapter 2 Literature Review. Figure 2-6 Challenges of the Mobile Web for social development, adapted from (Boyera, 2009c) Infrastructure Available, reliable and affordable mobile networks are essential infrastructure issues of Mobile Web uptake in developing countries. As discussed in section 2.2, widely deployed GPRS fulfils the minimum requirement of Mobile Web usage. However, it is often not reliable or stable, particularly in rural areas. Referring to the interplay of social interaction, Web applications and Web infrastructure in Figure 2-1, unreliable and unstable GPRS becomes a major challenge to overcome (Boyera, 2009a; Hendler et al., 2008). Meanwhile, a network-sharing model among mobile operators was proposed to cut down expenses to deploy and operate mobile networks, as well as to save on electricity consumption (Mekuria, 2009). Technologies There are several technologies, such as texts, voice, the Web and Unstructured Supplementary Service Data (USSD), which provide mobile contents and applications (Boyera, 2009c). Texts and USSD are very popular compared to other technologies. Over time, more people start using the Mobile Web, because there have been more affordable handsets with free J2ME/MIDP-based mobile browsers. These browsers significantly compress transmitted data, so the Web can be better accessed on low-bandwidth networks like GPRS.. 19.
(46) Chapter 2 Literature Review On the other hand, there are several factors that obstruct Mobile Web use. Some potential Mobile Web users believe that data communications are more expensive than sending texts. In fact, using the Mobile Web can be up to 1,000 times cheaper per character than the Short Message Service (SMS). However, the billing model, which is commonly based on number of bytes used, is still confusing (Boyera, 2009a). Furthermore, data link setting is considered to be complicated (Boyera, 2009c); although actually, mobile operators have made this simpler by sending automatic configuration to users’ handsets. Besides, making Mobile Web site online is thought to be very complex, whereas there are easily used integrated authoring tools. Content Another challenge of the Mobile Web is its content that is supposed to be closely related to its users. Warschauer (2004) wrote that computers and the Internet become less useful without content and applications that can fulfil people’s needs. A representative of M.S. Swawinathan Research Foundation said, “The villagers in Kannivadi (in Southern India) are not interested in what’s going on in the White House or even in Chennai (the state capital); they are interested in the price of rice in the local market.” This quotation emphasises the importance of locally relevant information to less-privileged people in the developing world (Boyera, 2009c). In addition, local languages and character sets play important roles in Mobile Web Access and use. Figure 2-7 shows the world’s top nine languages by number of native speakers, while Figure 2-8 illustrates the top 10 languages used over the Internet. Hindi/Urdu and Bengali are examples of widely spoken languages that are not well represented on the Internet (Internet World Stats, 2010; Wikipedia, 2011). Some Hindi/Urdu or Bengali native speakers may also be fluent in other languages such as English. Nevertheless, many underprivileged people only speak, read or write their native languages that are lesser-known globally (Boyera, 2009a). Moreover, there are problems related to languages with non-Latin characters. Implementing Unicode standard can solve the problems; however, some mobile operators do not support it. Meanwhile, the W3C I18n Activity has been working on internationalisation and localisation since 1998. It has a mission to make the World Wide Web truly worldwide (W3C, 2010a). 20.
(47) Chapter 2 Literature Review. Figure 2-7 Top nine languages by number of native speakers (Bratt, 2010; Wikipedia, 2011). Figure 2-8 Top 10 languages on the Internet 2010 in millions of users (Internet World Stats, 2010) 21.
(48) Chapter 2 Literature Review Furthermore, textual Mobile Web content can be considered as barriers for illiterate potential users, who can comprise up to 50% of a deprived population (Boyera, 2009c). In this case, the use of icons and audio can better suit their needs. On the contrary, Mxit mobile instant messaging can attract less literate people in South Africa to read and write on chatting boards. Surprisingly poor grammar and spelling do not hamper their written communication, as shown in Figure 2-9 (Web AddiCT(s), 2011). Recently, popularity of Mxit has inspired Mobile Web developers to use it as a platform for a counselling service related to substance abuse (Parker et al., 2010), as well as for integrating mobile phones into education (Ford and Botha, 2010).. Figure 2-9 An example of a chatting conversation on Mxit (Web AddiCT(s), 2011) Text-only content is also posing an obstacle to a richer Mobile Web application, such as the agricultural advice e-service for farmers in rural areas that requires image transfer (Dearden, 2009). Among technologies to develop mobile content as discussed in section 2.3.1.2, the Web is the only one that can support content with various information channels (text, audio, still image and video) (Boyera, 2009c). Ecosystem In order to fully understand the relationships between the Mobile Web and its stakeholders, we need to comprehend Mobile Web ecosystem or ecology. The Encyclopaedia Britannia defines an ecosystem as the complex of living 22.
(49) Chapter 2 Literature Review organisms, their physical environment, and all their interrelationships in a particular unit of space; whilst ecology is a study of the relationships between organisms and their environment (Encyclopaedia Britannica, 2011). This report examined literature related to ICT and the mobile ecosystem or ecology. The first paper on this system was proposed by the W3C Mobile Web for Social Development (MW4D) Interest Group (Boyera, 2009c). The second one was written by Warschauer and was adopted by the Rural e-Services project (Dearden, 2009; Warschauer, 2004). The third one was proposed by researchers at the Helsinki University of Technology (Karhu et al., 2009), while the fourth one is the Mobile Web ecosystem from an application development point of view (Firtman, 2010). 2.3.1.4.1. W3C MW4D Interest Group. The MW4D workshop held in Maputo, Mozambique in 2009 was then followed by several teleconferences. The discussion identified innovation, scalability and sustainability, business model, regulation and policy as critical success factors for the Mobile Web ecosystem in developing countries (Boyera, 2009c). These form just some of the challenges facing the Mobile Web as illustrated in Figure 2-6. Raising awareness, training local people on existing technologies, and setting up guidelines and tools are possible actions to stimulate Mobile Web innovation in emerging economies. Therefore some world-class universities and research institutes have initiated collaboration with local universities in the developing world. The MIT (USA) set up the EPROM (Entrepreneurial Programming and Research on Mobiles), which taught mobile phone programming within Computer Science Departments in 10 Sub-Saharan African countries (MIT, 2009). Another example is Microsoft Research India, which collaborated with University of Cape Town in South Africa to explore mobileonly and mobile-primary Internet use in South Africa (Donner and Gitau, 2009). Other challenges in the Mobile Web ecosystem are scalability and sustainability to extend simple Mobile Web local pilot projects on a micro scale to wider communities and regions, or macro scale. These challenges in turn trigger new issues for software engineering and application development as shown in Figure 2-2 (Boyera, 2009c; Hendler et al., 2008). They can be accomplished by 23.
(50) Chapter 2 Literature Review a top-down or bottom-up approach. There are several cases where NGOs successfully operated small-scale m-services, from which they then replicate the technology for other services, such as FrontlineSMS from kiwanja.net (kiwanja.net, 2009). Currently, they are undertaking enhancement to improve its service with Mobile Web technology. Scalability and sustainability also require NGOs and governments to be complementary partners in the ecosystem (Boyera, 2009c). Governments need NGOs to provide prototypes for novel and useful social and economic services. On the other hand, once the services become extensively used as part of public services, governments may become involved to ensure the services are financially sustainable. Sustainability in its scope is broader than service payments and cost recovery, since it also deals with service monetisation without making payment methods as barriers to the users. Moreover, the chosen technology drives the business model, such as m-services with voice channel, which offers flexibility to the service providers. They can push content to the users by sending it to the users’ voice mail boxes, or they can ask the users to pull the content by calling a number to get the information. In contrast, users in Mobile Web services pay the connection to the service providers via data service. The last aspect of the ecosystem is smart regulation, which is needed to maximise the number of entrepreneurs who expand into the market with the services, and to minimise the negative effects of competition on consumers. Monopoly operators and excessive licencing regimes can be obstacles that negatively impact the potential entrepreneurs. Alternatively, a supportive fiscal and financial environment, as well as the ability of entrepreneurs to access financial services, can raise the number of social-oriented services. 2.3.1.4.2. Information Ecology. Another paper related to the literature on the Mobile Web ecosystem or ecology was written about Rural e-Services in Madya Pradesh, India; and it was supported by the EPSRC (Dearden, 2009). Dearden (2009) argued that ICTs do not exist in a vacuum; rather, their adoption happens within a specific context consisting of technical, economic, individual and social factors. Any sustainable uptake of technology is similar to the evolutionary process of an organism surviving in ecology. 24.
(51) Chapter 2 Literature Review These ideas were taken from a book written by Warschauer on technology and social inclusion (Warschauer, 2004). This book is not about mobile phones or the Mobile Web in particular, but it offers an extensive and fascinating discussion on ICTs and the digital divide. Warschauer wrote that successful adoption of ICTs depends on physical, digital, human resources and social resources (Figure 2-10).. Figure 2-10 Resources contributing to ICT access, adapted from (Warschauer, 2004) Physical resources comprise computers and connectivity. Digital resources consist of content and language. Human resources embrace literacy and education, whilst social resources include communities and institutions. In the Rural e-Services project, physical resources were identified as mobile network coverage, affordable handsets and renewable power (Dearden, 2009). In less privileged communities with limited financial resources, it is more reasonable for Mobile Web users to share mobile devices. Therefore the use of a mobile device by a group of people in a community is more appropriate than the ‘one person-one device’ model. Furthermore, more efforts are needed to provide digital resources, such as relevant and trusted contents; easy-to-use and easy-to-learn interfaces are considered to save human resources. It is also crucial to encourage social resources by enabling human networks that are harnessing the Mobile Web to positively affect humanity.. 25.
(52) Chapter 2 Literature Review 2.3.1.4.3. A Digital Ecosystem. Researchers at Helsinki University of Technology (TKK) presented a conceptual model of a community and digital ecosystem for boosting user-driven service business in Web 2.0, as demonstrated in Figure 2-11 (Karhu et al., 2009). Initially they identified the key actors; later, they applied use case modelling to show interactions among actors, following which they used conceptual modelling to illustrate the overall ecosystem. Ultimately the model was evaluated using a bioinformatics field.. Figure 2-11 Conceptual model for the community and digital ecosystem (Karhu et al., 2009) 2.3.1.4.4. Mobile Web Application Development. The last part of the ecosystem was written from Mobile Web development perspectives. It is emphasised that developing Web applications or contents for mobile devices is very different from developing these for the Web on desktops (Firtman, 2010). Therefore, understanding a mobile ecosystem, which consists of vendors, carriers or operators, integrators and developers, is very crucial.. 26.
(53) Chapter 2 Literature Review Currently, it is estimated that there are approximately 3,000 mobile devices with various screen sizes and resolution, which consequently determine the layout and design of Web pages shown on these devices (Firtman, 2010). Moreover, there are 30 different browsers and possibly even 300 various versions of browsers, if we count different versions. On the other hand, in the desktop world we only have Internet Explorer (6, 7, 8 or newer), Firefox, Safari, Opera and Chrome. Moreover, the global market share of mobile vendors is extremely segmented. This can be caused by commercial agreement or cultural differences. For example, Nokia dominates handset markets in Europe and Asia, but not in the US. Often mobile browsers are dependent on mobile handsets or operators, as commonly these browsers cannot be upgraded or uninstalled. As a result, Mobile Web developers must be aware of possible browsers used by their targeted users. On the other hand, this market segmentation does not significantly happen in the case of desktop browsers. Figure 2-12 shows the top four Mobile browsers in a sample of countries. iPhone/iTouch browsers considerably dominate in the developed world; whereas in the developing world like India, China, Nigeria and Brazil, Opera or Nokia browsers extensively lead the market.. 27.
(54) Chapter 2 Literature Review. Figure 2-12 Mobile browser market share (icrossing, 2010) 28.
Figure


+7


Related documents
