Worcester Polytechnic Institute
Digital WPI
Interactive Qualifying Projects (All Years) Interactive Qualifying Projects
December 2013
Puerto Rico Light Pollution
Alexander Philip HaringWorcester Polytechnic Institute John Federico DeVries Worcester Polytechnic Institute Matthew David Giambrone Worcester Polytechnic Institute Matthew Howard Penrose Worcester Polytechnic Institute
Follow this and additional works at:https://digitalcommons.wpi.edu/iqp-all
This Unrestricted is brought to you for free and open access by the Interactive Qualifying Projects at Digital WPI. It has been accepted for inclusion in Interactive Qualifying Projects (All Years) by an authorized administrator of Digital WPI. For more information, please [email protected]. Repository Citation
Haring, A. P., DeVries, J. F., Giambrone, M. D., & Penrose, M. H. (2013).Puerto Rico Light Pollution. Retrieved from https://digitalcommons.wpi.edu/iqp-all/587
Light"Pollution"in"
Puerto"Rico"
Measuring*ground-level*light*pollution*in*
San*Juan,*Puerto*Rico
* ! !*
*
*
*
*
*
*
*
*
Authors:*
John%DeVries,%Alex%Haring,%Matthew%Giambrone,%and%Matthew%Penrose%
! ! 12/17/13"Sponsor:
!
La!Junta!de!Calidad!Ambiental
"Advisors:"
Stanley!Selkow!and!Hugh!Lauer
!Abstract:
Ground level light pollution is a growing problem across the globe. In Puerto Rico, light pollution is a serious problem for people living in urban environments as well as organisms in the wild. While the health effects of excess light are well documented, the methods for collecting data on ground level light pollution are not. The goal of this project is to develop a procedure for measuring ground level light pollution, and to carry out initial light measurements to lay the groundwork for future studies. Surveys of Puerto Rican citizens were done to get an idea of public awareness of light pollution. The outcomes of the project are a manual for collecting data, initial measurements using the procedure at key locations, as well as a better understanding of public opinion. Our results will be presented to Para la Naturaleza and la Junta de Calidad
Ambiental so they can use it to create a plan for future regulation and control of light pollution in Puerto Rico.!
!
EXECUTIVE SUMMARY
The societal demands for adequate lighting on sidewalks, highways, and other public areas result in the continuous increase of artificial light in both urban and rural areas across the globe. Puerto Rico is no exception to this, and the entire island has seen a rapid increase in artificial nighttime lighting over the past thirty years. Excessive lighting can spill over into natural areas through both sky glow and trespass, which negatively affects local flora and fauna. This unwanted light is known as light pollution. Light pollution can be broken down into four different categories:
1. Skyglow is the illumination of the nighttime sky due to artificial lighting.
2. Light Trespass occurs when light is shone where it is not wanted, especially when it crosses property lines.
3. Light Glare is when light is shone directly, or reflected, onto an organism and causes discomfort.
4. Light Clutter is the grouping of many, often colored, lights.
All four of the types of light pollution are prevalent in San Juan, Puerto Rico. Our study focused on ground level light pollution, quantitatively measuring the ambient light level and making qualitative observations about the light trespass and light glare.
The goal of our project was to develop methods of gathering data on ground level light pollution. To accomplish this goal, we developed a protocol for measuring ambient light levels using handheld meters, we tested this method in the field, and surveyed inhabitants of the areas to correlate people’s perceptions of light pollution with the meter readings.
The first step in developing our methodology was to learn to use the light meters provided by la Junta de Calidad Ambiental, which were the Extech HD-450, Extech SDL-400,
and Konica/Minolta T-10A. For the purpose of our experiment we needed a light meter that was highly sensitive in even the darkest nighttime areas. We settled on using the Konica/Minolta for our measurements due to its superior accuracy at low levels of lighting. Our method for
measuring the ambient light level was created based on the Outdoor Site-Lighting Performance method. A government cartographer divided Old San Juan into 384 100x100m quadrants, and divided each of those into 10x10m sub quadrants. The computer program ArcGIS created the quadrants, and randomly selected 54 to be measured, the number needed to be scientifically significant within the region. This number was determined by using the methodology provided by the JCA. Each quadrant was given a daytime and nighttime assessment noting weather conditions and numbers of lights present. These assessments included day and nighttime photos, as well as a nighttime video. To measure the ambient light, we took 3 luminance measurements at a height of 1.5 meters facing into the quadrant, every 2.5 meters along the perimeter. The ambient light level is calculated from the average of these measurements. In addition, we organized the individual measurements at each quadrant to be correlated with the written
descriptions and pictures of the sites. In addition, we wanted to gain a better understanding of the public opinion of artificial lighting in San Juan. The public opinion gives an indicator of whether or not light pollution is a public annoyance. The initial plan for this was to hand out surveys at each quadrant; however it quickly became apparent that this would not get us enough responses. Instead, we created a survey through Survey Monkey and distributed it to the JCA’s contact list.
Findings
1. The ambient light level varies greatly from location to location, even those that are close together.
a. The lowest ambient light level we measured was in front of El Morro, the average luminance was 0.007 footcandles.
b. A short distance away from the cruise ship dock, we measured the greatest ambient light level which was 1.700 footcandles.
c. Ground level light pollution can be blocked by trees, buildings, or fences. 2. Even in areas that have low ambient light levels, there can still be individual sources of
glare.
a. The ambient light level in a dark parking lot was on 0.606 footcandles, but one reading taken in the direction of a nearby floodlight registered 1.453 footcandles. 3. Ambient light level measurements do not provide any information about light trespass.
a. To measure light trespass there must be property line. Trespass is usually
measured in case studies where residents have complained about unwanted light shining into their home or onto their property.
b. Ambient light levels can provide information about areas that potentially have light trespass. If the ambient light level is high in a residential area, there is a good possibility that the tenants are experiencing light trespass.
4. The online survey provided insight into the public opinion of light pollution; however we cannot draw any statistically significant results.
a. Through Survey Monkey we are not using a random sample, and we do not have enough responses to consider our survey statistically significant.
b. 50% of the responders believe that light pollution is a serious problem in San Juan.
c. 60% of the sample population have noticed an increase in artificial lighting in their neighborhoods.
Recommendations
1. Continue to expand this study of light pollution. We have gathered information on Old San Juan, which is one small area of the city. The most important result of our project was the development and refinement of a methodology.
2. Use shielded and full-cutoff lights. This constricts the light produced by a luminaire to a specific area. Shielded and full-cutoff lights reduce light trespass and glare while still illuminating areas that must be well lit.
3. Begin documenting case studies. Individual studies of locations with light trespass will provide more evidence of the light pollution problem.
Table of Contents:
Abstract:"..."2" Executive"Summary"..."3" Findings"..."4" Recommendations"..."6" Chapter"1:"Introduction"..."10" Chapter"2:"Background"..."12" Research"Area"Information"..."12" Light"Pollution"As"A"Global"Problem"..."13" Types"of"Light"Pollution"..."13" Effects"of"Light"Pollution"on"Humans"..."14" Effects"of"Light"Pollution"on"Natural"Life"..."14" Legislation"Concerning"Light"Pollution"..."16" Notable"Regulations"Around"the"World"..."16" Legislation"in"Puerto"Rico"..."18" Measuring"Light"Pollution"..."19" Measuring"Ground"Level"Light"Pollution"..."19" Chapter"3:"Methodology"..."21" Developing"A"Method"For"Data"Collection"..."21" Understanding"the"Light"Meters"..."22" Choosing"Data"Collection"Locations"..."22" Ambient"Light"Level"Collection"..."23" Standard"Conditions"for"Data"Collection"..."23" Storing"and"Organizing"Data"..."23" Testing"The"Research"Method"In"The"Field"..."24" User"Interface"of"Light"Meters"..."24" Achieving"Standard"Conditions"..."24" Storing"and"Organizing"Data"..."25" Determining"Public"Opinion"..."25" Developing"the"Questions"..."25" Conducting"the"Surveys"..."25" Organization"of"Responses"..."26" Chapter"4:"Results"and"Discussions"..."27" Daytime"And"Nighttime"Site"Assessments"(Observations)"..."27" Quadrant"182,"North,"During"The"Day"And"Night"..."28" Quadrant"182,"East,"During"The"Day"And"Night"..."29" Quadrant"182,"South,"During"The"Day"And"Night"..."29" Quadrant"182,"West,"During"The"Day"And"Night"..."29" Ambient"Light"Concentrations"..."30" Comparing"Site"Assessment"Data"To"Luminance"..."33" The"Two"Bright"Light"Sources"At"Quadrant"284."..."35" The"Direction"Of"The"Largest"Recorded"Luminance"Value"..."36" Quadrant"155"South,"Showing"The"East"To"West"Quadrant"Line"..."37" Quadrant"322,"In"The"Eastern"Direction"..."38"Public"Opinion"..."39" Chapter"5:"Conclusions"and"Recommendations"..."41" Glossary"..."45" Appendices:"..."46" Appendix"A:"Light"Meter"Data"Sheets"..."46" Appendix"B:"Measuring"Skyglow"..."54" Appendix"C:"Figures"And"Data"Tables"..."55" Figure"I:"Taken"from"Royal"Commission"Report"(Pollution,"2009)."..."55" Table"I:"Average"Luminesce"At"Each"Quadrant"..."56" Appendix"D:"Surveys"..."57" English"Version:"..."57" Spanish"Version:"..."59" Survey"Monkey"Version:"..."61" Question"1"Results""..."64" Question"2"Results"..."65" Question"3"Results"..."66" Question"4"Results"and"Questions"5"Results"..."66" Question"6"Results""..."67" Question"7"Results"..."68" Question"8"Results""..."69" Question"9"Results""..."70" Appendix"E:"Collected"Observational"Data"..."71" Quadrant"155"Pictures"..."72" Quadrant"182"Pictures"..."74" Quadrant"185"Pictures"..."77" Quadrant"186"Pictures"..."79" Quadrant"187"Pictures"..."82" Quadrant"195"Pictures"..."84" Quadrant"225"Pictures"..."89" Quadrant"228"Pictures"..."92" Quadrant"297"Pictures"..."94" Quadrant"322"Pictures"..."96" Quadrant"323"Pictures"..."98" Quadrant"344"Pictures"..."101" Quadrant"346"Pictures"..."104" Appendix"F:"Numerical"Data"Sheets"..."106" Quadrant"12"Data"..."106" Quadrant"20"Data"..."106" Quadrant"22"Data"..."107" Quadrant"52"Data"..."108" Quadrant"54"Data"..."109" Quadrant"80"Data"..."110" Quadrant"98"Data"..."111" Quadrant"99"Data"..."112" Quadrant"117"Data"..."113" Quadrant"136"Data"..."114"
Quadrant"155"Data"..."115" Quadrant"182"Data"..."116" Quadrant"185"Data"..."117" Quadrant"186"Data"..."118" Quadrant"187"Data"..."119" Quadrant"195"Data"..."120" Quadrant"203"Data"..."121" Quadrant"222"Data"..."122" Quadrant"225"Data"..."123" Quadrant"228"Data"..."124" Quadrant"234"Data"..."125" Quadrant"284"Data"..."126" Quadrant"297"Data"..."127" Quadrant"322"Data"..."128" Quadrant"323"Data"..."129" Quadrant"344"Data"..."130" Quadrant"346"Data"..."131" Appendix"G:"Lab"Manual"..."133" Appendix"H:"Examples"of"Luminaire"Effects"..."143" References:"..."148"
Chapter 1: Introduction
The world is a thriving environment that runs twenty-four hours per day, and as populations grow the demand for more lighting has increased significantly (Aubrecht, Jaiteh, Sherbinin, 2010). The societal demands for adequate lighting on sidewalks, highways and other public areas result in the continuous increase of artificial light in both urban and rural areas across the globe. For example, bright billboards and signage have illuminated Hong Kong for many years, causing interference in everyday life (Walls et al., 2010). Companies like Pro Billboards have recently installed new LED billboards in San Juan that contribute to the visual glare experienced by drivers on highways and to light trespass (See Glossary For Definitions) when located close to residential areas (“Pro Billboards”, 2013). The increased luminescence has affected behavior patterns as both humans and wildlife attempt to adapt to light intrusion (Gaston, Bennie, Davies, & Hopkins, 2013; Longcore & Rich, 2004). These increases in unwanted or unintended levels of light lead to a high presence of light pollution, which is defined as any adverse effect caused by artificial lighting (“Dark Skies Awareness: Seeing In The Dark”, 2009).
Limited in geographical size, yet laden with industry and dense with population, Puerto Rico is particularly susceptible to the effects of light pollution. The Commonwealth produces massive amounts of light (Cinzano, Falchi, & Elvidge, 2001), contributing to the amount of skyglow and the other forms of light pollution. Multiple urban areas throughout the island radiate energy from wastefully lighting areas where it is not wanted or needed, affecting indigenous wildlife behavior patterns, plant life, and coral reefs (Aubrecht & Elvidge, 2008). The increase in the amount of skyglow, light trespass, glare, over-illumination and clutter (See Glossary) of light has had adverse effects on the human population as well (Chepesiuk, 2009).
Due to the large social, industrial, and cultural value of San Juan (Kinsburner, 2008) as the capital of Puerto Rico, the city is well lit at all times to accommodate the number of people that frequent it on a daily basis. The dense artificial lighting currently used throughout the city produces a significant amount of skyglow that mars the visibility of the night sky. Despite the fact that it has such presence in the commonwealth, light pollution has not been extensively examined in Puerto Rico. Therefore, it is vital that measurements of the presence of light pollution throughout the island be taken.
The goal of this project, which was sponsored by Para la Naturaleza, a prominent Puerto Rican conservation trust, and la Junta de Calidad Ambiental, a government conservation agency, is to assist with initial research on the problem of light pollution in Puerto Rico. One of the major goals was to develop a methodology for future studies on light pollution. This methodology was tested by taking measurements in the field. Another goal of the project was to gauge the public understanding and awareness of light pollution and provide information of it. Our research team travelled to different locations throughout Old San Juan with light meters to log information about ground level illumination. In addition to collecting quantitative data on light pollution, an additional goal was gathering public opinion of light pollution through surveys.
Chapter 2: Background
While astronomers have worried about and measured skyglow, there is a definite lack of research about measuring light pollution separate from skyglow as it affects normal human activities as well as those of other animals and plants. This project was an exploratory study to determine the best methods to accomplish this research. The first step was to define light pollution and its impact on organisms in various environments. The second step was to gain a clear understanding of the tools and methods used around the world to limit the amount of light pollution. The final step was to organize the collected data in a standardized, quantifiable manner for the ease of researchers who will conduct future studies.
RESEARCH AREA INFORMATION
Hundreds of years old, filled with plazas, fortresses, and numerous statues and monuments, Old San Juan is a popular place of tourism. El Castillo de San Felipe del Morro commonly known just as “El Morro” was Puerto Rico’s impenetrable ocean side fortress used to defend the island. This daunting citadel is one of the most frequented sites in Puerto Rico. There are multiple statues dedicated to Christopher Columbus, as well as statues paying tribute to other important persona to Puerto Rico. In order to show their beauty and meaning, a large number of luminaires exist throughout Old San Juan, making it shine at night. A combination of El Morro, multiple ship ports and thriving nightlife activities, makes Old San Juan a highly luminous area. It was for these reasons that this zone was chosen to be the main focus of our study.
LIGHT POLLUTION AS A GLOBAL PROBLEM
Types of Light PollutionLight Pollution is defined as any adverse effect due to artificial lighting, and can be found to occur in multiple forms (“Dark Skies Awareness: Seeing In The Dark”, 2009). The term light pollution is a broad one and contains such subcategories as skyglow, light trespass, glare, and clutter (See the Glossary for definitions).
One prevalent example of ground-level light pollution in the San Juan area is billboards, which are made with light emitting diodes (LEDs) that contribute heavily to the growing
intrusive light trespass problem. Recently, advertising companies have been installing large LED lit billboards along highways and throughout the city of San Juan (PRO Billboards, 2013). Pro Billboards announced on their website that the company constructed two 14’ by 48’ LED billboards along Highway 22 which connects Bayamón and San Juan, two major cities on the island of Puerto Rico.
Light Pollution is a strong marker for wasted energy, which is caused in large part by over-luminescence and light clutter (Chepesiuk, 2009). A clear benefit of measuring light level values will be determining problem areas in which resources are being needlessly used. Once they are determined, different methods can be implemented to streamline the energy efficiency in them to benefit the environment and economy. Objects such as streetlights, LED signs, car headlights, flashlights, and televisions contribute to glare and trespass levels in urban
environments. Glare, over-illumination, and light clutter have a stronger presence in metropolitan cities such as San Juan and Bayamón compared with wildlife reserves or deep in El Yunque National Rainforest. That is not to say that light pollution does not exist in these areas. They
merely have different sources and levels of light pollution within them, and the areas with higher levels are more likely to be problem areas than the others.
Effects of Light Pollution on Humans
It has been shown that the human body and the behavior of many animals have biological cycles that are sensitive to natural and artificial light (Chepesiuk, 2009). The human sleep cycle is dependent on sunlight and has various effects on people psychologically. The presence of artificial lighting during the night interrupts the natural sleep cycles of people in addition to causing stress through repeated exposure to unwanted light intrusion in the home. Studies show that artificial lighting suppresses the production of Melatonin (Chepesiuk, 2009), a bodily hormone affecting the entrainment of, or the ability to acclimate to, the sleep cycle. Melatonin is produced significantly more during nighttime darkness than in a lit nighttime region. Melatonin has also been shown to suppress the growth of cancerous tumors when the blood had been exposed to night-time lighting (Cheney 2011). It has also been determined that there is an increased percentage of breast cancer in women who live luminous night-time areas as opposed to the least lit rural areas (Chepesiuk, 2009). Although people are more adaptable to the
environment than many species of animals, the adverse effects on humans are still present. The circadian clock of humans is responsible for brainwave, hormone, and cell regulations among other bodily functions (Chepesiuk, 2009). The intrusive trespass of lighting into homes may upset people’s natural bodily clock and cause stress and further develop adverse effects.
Effects of Light Pollution on Natural Life
The documented rise in urbanization and the steady development of technology over the past century have naturally led to a significant increase of the use of artificial lighting and, therefore, light pollution. The intrusion of these artificial light sources has had negative
consequences on local ecological systems. Plant life, specifically, undergoes interruptions in its natural photosynthetic cycles that can affect its growth, internal information flow, and
pigmentation (Gaston, Bennie, Davies, Hopkins, 2013). On the other hand, mammals as well as female sea turtles have been recorded to choose new breeding grounds with lower levels of light. Turtle hatchlings become disorientated upon birth due to light pollution, causing a sizable drop in their survivability (Taylor and Cozens, 2010). When a female lays her eggs on a dark beach, the hatchlings will instinctively head towards the ocean for survival. However, if the lights in the immediate area are strong enough to cause the baby turtles to become distracted, then this will result in a higher mortality rate in the turtles (Taylor and Cozens, 2010; Witherington, 1992). Certain nocturnal birds use the stars are guidance for their migrations across the landscape. When flying over cities, such as New York City, which produce extensive amounts of artificial light, birds have been seen to become confused and drawn towards buildings. The result of this attraction can be a fatal collision with buildings in cities (Cheney, 2011).
Animals, insects in particular, are especially susceptible to light pollution because certain species can view different portions of the light spectrum than humans. Moths are more attracted to high-powered, 100 watt, sodium lamps that produce ultraviolet lighting, and are therefore more visible to predators that prey on the captivated insects. Comparatively, moths are much less attracted to low-powered 100-watt sodium lamps, as they do not produce ultraviolet light (Rydell, 1992). The relative levels of absorption from low-pressure sodium lamps compared to pigment absorption are shown in Figure I: Taken from Royal Commission Report (Pollution, 2009). (Pollution, 2009) (See Appendix C: Figures). Although this moth attraction may seem beneficial to all predators, it will favor the faster hunting species of bats over the slower ones, which tend to avoid such lighted areas. This disadvantage threatens the food supply of the slower bat
communities. Artificial lighting at night, as Longcore describes as a “perpetual full moon”, will favor species that have a higher tolerance or adaptability to lighting, disrupting natural prey and predator relationships (Longcore and Rich 2004).
LEGISLATION CONCERNING LIGHT POLLUTION
Notable Regulations Around the WorldMany measures have been taken around the world to limit the extent of light pollution in urban environments. Some countries have just taken their first steps into creating useful policies. For example, Liberia has recently acknowledged the dangers of light pollution in its “Save the Sea Turtle and Protect the Mangroves” campaign (“Liberia; Mangroves Protection Awareness in Buchanan,” 2012). This reflects a growing interest in potentially limiting light pollution.
Countries such as South Korea have already begun to control their output of light pollution. The South Korean government passed a law concerning the regulation of artificial lighting, which went into effect February of 2013. This plan takes a rational approach to the issue, not completely eliminating lighting from the environment but reducing its effects (“Where did all the stars go?” 2012). China took a different approach in 2011; while programs were developed that would collect data and public opinion on light pollution, many officials thought that light regulation was unrealistic and sought to enforce voluntary guidelines. However, other officials such as Hahn Chu Hon-keung believed that these guidelines would be ignored. Therefore the thought process behind the addition of billboards is that the level of brightness is already so high that installing a few more billboards will no elevate this level significantly (“Officials Urge Guidelines On Light Pollution...” 2011). Such billboards have been shown to be a problem in many places, such that the US Federal Aviation Administration has even considered pre-emptively banning billboards in orbit of the planet (“Blinded by the Lights” 2008).
These early programs can often take time to develop. For example, in 1996 the Commission of the European Union was asked what plans they had to fix light pollution. A representative of the Commission stated that they were currently assessing the situation and developing more efficient lighting, but required more information before taking serious actions (“Written Question No. 514/96,” 1996). The question was asked again 6 years later, to which the commission replied that they did not have enough information to take action. However, different programs such as the Green Light Program were already in place to assess the efficiency of light fixtures (“Written Question E-1207/02,” 2002).
The Lombardy Law no. 17 of Lombardy, Italy, was a law passed in 2000 designed to ease the astronomical and economic impacts of wasteful lighting policies throughout the Lombardy district. It sought to do this by creating measures to make other existing lighting policies enforceable (CeloBuio, 2000). A law titled the Protection of the Atmosphere Act in the Czech Republic, based on the Lombardy Law, was passed on February 27th, 2002. This law called for a reduction of light pollution and defined light pollution as “every form of illumination by artificial light which is dispersed outside the areas it is dedicated to, particularly above the level of the horizon” (“Czechs against light pollution,” 2002). Similar laws were considered in Laguna Beach, California, but dealt exclusively with lights used during major holidays.
According to several petitions, celebrations held on many holidays produced such extreme amounts of light that the trespass became unbearable (Claudia, 2011).
In 2006, British Parliament passed a law with the purpose of severely limiting light pollution. This was made with the goal of limiting the biggest centers of light production in the UK, such as Nelson’s Column and the Liver Building in Liverpool (Tom, 2006). The plan of this law was to replace large, bright lights on different landmarks with smaller lights directed at the
ground. This legislation would influence several measures taken in Wales, which sought to maintain the level of darkness in its skies that attracted so many tourists (“Protect night skies plead stargazers; Light pollution is blotting out our views of the stars,” 2009). The Brecon Beacons National Park in Wales was able to obtain the much sought-after title of International Dark Sky Reserve from the International Dark-Sky Association, thanks to the efforts of the British Astronomical Society (“Astro-tourism set for star turn with grant of Dark Sky Reserve status to Beacons, 2013).
The next site to obtain this status, being the most recent with a June 28th, 2013 designation, was the Wood Buffalo National Park in Canada. Spanning portions of both the Northwest Territories and the province of Alberta, the park is roughly the size of Switzerland yet contains minimal artificial lighting. In the 4.4 million hectares that it covers, only shielded road lights for the highways that pass through it, and car headlights on the highways are allowed (“No lights in an area big as Switzerland,” 2013). This accomplishment displays that providing
lighting even in a largely natural area can be accomplished skillfully. Additionally, the success of other programs such as a law passed in Slovenia, which decreased the brightness of the capital city by 20% (Galbraith, 2012), shows that such measures can be effective.
Legislation in Puerto Rico
In 2008, Puerto Rico passed into law Act 218, the Light Pollution Control and Prevention Program, which strived for the “complete eradication” of light pollution, which it defines as skyglow, for the sake of local astronomers, lowering energy costs, reducing conventional pollution, and to protect the indigenous creatures of the island through “necessary and
appropriate” measures (“Light Pollution Control and Prevention Program,” 2008). However, the governor who supported this program, Anibál Acevedo Vilá, was replaced by Luis Fortuño in the 2009 gubernatorial elections. Fortuño placed much of his focus on other types of pollution, and
Act 218 was reduced much in scope by Act 29 in 2012, which amended Act 218 so more focus could be applied to other kinds of pollution (“Amendment to the Light Pollution Control and Prevention Program,” 2012). If it comes to drafting new laws concerning light pollution, it would be a good idea to keep what occurred with these two acts in mind to ensure that the regulations survive.
MEASURING LIGHT POLLUTION
There are several different forms of light pollution: skyglow, light trespass, lightglare, and light clutter. Skyglow is the measure of light radiated directly upward into the sky, with the use of cameras and special computer software. Light clutter and glare do not have well defined measurements methods currently. Light pollution can be measured quantitatively using different methods and equipment (Kolláth, 2010). Light pollution was first established as a problem and measured in 1970 by Merle Walker (Walker, 1970). Since then, the study of light pollution has grown tremendously, with the creation of many new techniques to collect light pollution data. There are many commercially produced hand-held light meters and computer programs that will collect and analyze light pollution data (Biggs, Fouché, Bilki, & Zadnik, 2012).
Measuring Ground Level Light Pollution
Gathering data about ground level light pollution can only be collected using light meters unlike skyglow which is able to be accurately measured with the use of a camera. The majority of light pollution prevention support is by astronomers who are solely interested in skyglow (Hölker et al., 2010). Therefore, there has been very little research focused on ground level light pollution. Ground level light pollution includes the types glare, trespass light, and clutter, each measured differently. This type of pollution also has much more variation over time, which makes it more difficult to gather meaningful data. The light meters used for skyglow can also be
used for ground level light pollution (Biggs et al., 2012) but due to the narrow scope of the project, we will not be doing these measurements.
The Illuminating Engineering Society of North America recommends that in areas of an extreme lighting source, that the entire area be observed. IESNA does not recommend measuring individual luminaires, because this will not take reflection into account (IESNA, 2000). The Federal Highway Administration Lighting Manual suggests the Outdoor Site-Lighting
Performance Method (OSP) to measure the true impact of luminaires. This method creates an imaginary square around the property to be measured. Luminance measurements are then taken every two meters around the square, which will give average luminance inside the square and illumination of each wall. Using these measurements, the location of the maximum trespass lighting can also be located. Measuring the ambient luminance inside the property before measuring the trespass level is beneficial because it gives a reference for the contrast.
Chapter 3: Methodology
Growing awareness of adverse effects of light pollution demands an increased response to the issue, including the gathering of more knowledge of the subject. The goal of this project was to develop methods of gathering data on ground level light pollution for further studies in Puerto Rico. An additional objective was to gain an understanding of residents’ knowledge and opinions on light pollution. To accomplish these goals the project was broken down into three main objectives:
1. Developing a method for collection of ground level light pollution data using hand held light meters.
2. Testing this method in the field and collected initial data sets for ground level light pollution.
3. Surveying Puerto Rican citizens to gain a better understanding of the public knowledge and opinion of light pollution.
DEVELOPING A METHOD FOR DATA COLLECTION
One of our main objectives was to develop a method for ground level light pollution data collection. This method needed to be clear and thorough because it lays the groundwork for a long-term light pollution study to be carried out by technicians who must perform these measurement processes on a routine basis. The four aspects of the project were: understanding light meters, deciding which locations were important for data collection, setting the standard set of conditions to gather readings, and designing a plan for organizing the stored data. This method is specific to our research with the JCA. For a more general methodology please refer to our lab manual located in Appendix G.
Understanding the Light Meters
The Junta de Calidad Ambiental (JCA) already owns two light meters for the purpose of studying light pollution, namely the Extech 407026 and the Konica/Minolta T-10A (See
Appendix A: Light Meter Data Sheets). The Konica/Minolta device is extremely useful at extremely dark areas because it provides the greatest level of accuracy, which is three decimal places. The Extech photometer is better suited for extreme levels of brightness as it can detect larger quantities of light than the Konica/Minolta is able to. For the reasons of accuracy, we have chosen to conduct all measurements with the Konica/Minolta device.
One of the first steps in developing the research method was to understand the user interface of each meter. They are complicated pieces of equipment with many features and functions, some of which were not needed for our research. We then documented the process and created a manual (See Appendix G: Lab Manual) for setting up each light meter from startup to data collection for future users in the JCA, such that they could easily make many routine measurements. The process of creating the manual was determined after trial runs using the hardware. The purpose of this manual is to minimize the effort required to understand the light meters for the benefit of the operators, who may have not had preexisting experience working with the devices. The manual includes detailed instructions on how to operate the instrument in an easily understandable manner, including graphics and diagrams where appropriate. We used the existing manuals for the devices as references for formatting the guide (See Appendix A: Light Meter Data Sheets).
Choosing Data Collection Locations
While it would have been productive to collect light pollution data all over the island, we were limited in the time given to perform research in Puerto Rico, and therefore were forced to focus on key locations. The San Juan Planning and Territory Office provided a map of Old San
Juan overlaid with 384 quadrants. Each quadrant is 100 meters by 100 meters subdivided into one hundred 10 meter by 10 meter sub-quadrants. Using software (ArcGIS) from the Planning and Territory Office, one 10 by 10 meter sub-quadrant is selected. This method provided statistical information about the light pollution levels of the district.
Ambient Light Level Collection
At each location we made a total of 60 measurements in order to accurately gather the amount of ambient light. The 60 measurements consist of 3 measurements taken every 2.5 meters along the edge of the quadrant (Brons, Bullough, & Rea, 2008). Along each edge of the 10 meter by 10 meter sub-quadrant, measurements were taken facing the interior of the quadrant. Each measurement was parallel to the other 4 measurements on that edge. The ambient light level was then calculated by averaging these 20 values in each sub-quadrant. We chose to construct our quadrants based on the cardinal directions in order to standardize our method of data. We realize that we may be missing a certain aspect of the data collection by orienting our quadrant in this manner, but further studies will have o be conducted in order to conclude that fact.
Standard Conditions for Data Collection
It was crucial to keep detailed notes about the weather conditions when collecting data. This allowed the determination of whether certain conditions produced erratic measurements relative to others, and therefore finding a standard for future studies. However, there were some constraints for data collection that could be implemented while in Puerto Rico. To minimize the sunlight, data was collected after atmospheric twilight, which is when the sun is 18 degrees below the horizon (Kolláth, 2010). In Puerto Rico this condition existed from roughly 6:45 PM to 4:25 AM local time in the seven-week period we performed our study (Gronbeck, 2009).
The light meter Konica/Minolta T-10A was used for instantaneous measurements. A reading was taken at each of the 60 points described and recorded by hand on data table. This hand data is then uploaded to a computer. In addition the average of these individual points were calculated and recorded, as well as the maximum reading and the minimum reading.
TESTING THE RESEARCH METHOD IN THE FIELD
During pretesting of the research method, some aspects of the plan were found to be less than effective, and testing these methods located some weaknesses. The three main issues that became apparent while conducting field testing were problems such as mastering the user interface of the various meters, understanding the ideal conditions for data collection, and performing the various methods for storing data.
User Interface of Light Meters
We developed a procedure for using the light meters, but navigating menus and following the procedure in the dark provided its own challenges. The interface is rather simple, but requires a calibration before start up in order to have a zero light reading for comparison. The lack of calibration would cause man difficulties when comparing our data due to the fact that the data between locations may not be comparable. For these reasons, we included a short
troubleshooting section in the user manual in order to prevent this simple error.
Achieving Standard Conditions
It is unrealistic to test only on nights with clear weather, because there are so few of them in Puerto Rico. Therefore, a part of the procedure is to maintain an accurate log of the weather conditions at the times of observations. It would be ideal to make measurements in the same time of a lunar cycle, however the times constraints of this project did not allow this and thus affected the standardization of the data and changing the amount of ambient light. There was not enough time to gather concrete data that would be representative of how measurements can vary under
different conditions, but it was enough to provide suggestive analyses for other researchers to reference in the future.
Storing and Organizing Data
We were able to develop a method to store this data for the duration of the project. This was determined by taking measurements, recorded in foot-candles (See Glossary), at several locations. Through first-hand experience we quickly developed an understanding that each of the meters stored its data in its own format, so we had to find a standard in which our data could be presented from each device. To standardize the measurements we converted them all to one unit, footcandles.
DETERMINING PUBLIC OPINION
We asked survey questions in Puerto Rico to assess the general feelings and knowledge of residents of the Commonwealth, especially in the areas that appeared to contain a relatively high level of ground-level light pollution. We used surveys to gather information concerning the opinions of the locals of Puerto Rico. Data was collected through the use of a website, Survey Monkey.
Developing the Questions
Since Spanish and English shared relative dominance in terms of spoken language in Puerto Rico, we chose to conduct these surveys in both languages. We translated our initial questions and revised them with the help of native speakers. Once satisfied with the questions, we submitted them to the JCA for approval by Sr. Alicea. Additionally, we determined that it was best to have a member of our sponsor organization that is fluent in Spanish present for translating follow-up questions on the spot in Puerto Rico.
Conducting the Surveys
Conducting the surveys in various localities allowed us to question a large number of Puerto Rican residents living in the Old San Juan area. With this information we tried to gain an
idea as to how much the average Puerto Rican resident understands light pollution, and also to form hypotheses as to how people’s perceptions of light pollution vary by environment.
This method proved to be ineffective as most of people willing to answer were tourists who are only exposed to Old San Juan for a matter of days. This also imposed a strong bias in our sample population. In order to continue surveys, we decided to use an additional source, the website Survey Monkey. The electronic survey is easily distributed to a list that the JCA had.
Organization of Responses
The responses were pooled and analyzed based on what category the surveyed individual belonged to. Once the responses were transcribed we determined the correlation between
location and level of light with the answers we received. We recorded who said what, as different ages and genders are affected differently in terms of health effects caused by high light exposure levels (See Chapter 2: Background).
Chapter 4: Results and Discussions
This chapter outlines the results of our measurements. Firstly, we gathered qualitative results concerning the light sources at each sampled quadrant in order to make generalizations as to which kinds of sources most needed to be shielded better. Secondly, we gathered quantitative readings that gave us the ambient level of light in the area as well as the levels of light in specific directions. We were also able to learn specifically how a portion of the population of San Juan as a whole feels towards the concept of light pollution.
DAYTIME AND NIGHTTIME SITE ASSESSMENTS (OBSERVATIONS)
To understand the significant of certain readings, we performed qualitative assessments of the areas surrounding each 100m2 quadrant that we sought to analyze. These data gatherings included taking notes on the light sources in every cardinal direction from the center of each quadrant, both during the day when we explored the points to determine their safety and
accessibility, and also during the night while we performed our measurements. We additionally took a video at night starting at the north position and slowly spinning counter-clockwise in the center of the square, in case different sources were missed in the daytime photographs.
There was a noticeable difference between the observations we made during the day and those we made during the night. This was because some lights were not noticeable during the day, as well as the fact that the actual brightness of the lights could not be determined while they were off during the daytime. The consistency of the collected information varied as our
This is an example of observations made in Quadrant 182, located in the Muñoz Rivera Park. These observations were performed during the night. (See Appendix E: Collected
Observational Data for complete set)
" OBSERVATIONS"AT"182"(DAY)"
NORTH" 9"post"lights"
EAST" 1"post"light,"a"small"road"contiguous"to"the"park" SOUTH" Traffic"lights,"lampposts,"and"a"large"building"
WEST" 4"luminaries"on"the"ground,"apartment"buildings"with"street"lights."The"skies"here"are"relatively"dark."
The following eight pictures were taken at the site. In the night photo, members of our team can sometimes be seen:
Quadrant 182, East, During The Day And Night
Quadrant 182, South, During The Day And Night
AMBIENT LIGHT CONCENTRATIONS
To assess the general light level in Old San Juan, we based our methodology off of an altered form of the Outdoor Site-Lighting Performance Method to establish the ambient light level of 54 quadrants. However due to time constraints, we were only able to accomplish 27 of these quadrants. Each quadrant we measured is a 10x10m square randomly selected by ArcGIS, a cartography software application. At each site, we used caution tape to set up a quadrant. At each quadrant we took a total of 60 luminance readings using the Konica Minolta T-10A. If a quadrant passed through a building or some other structure, we had a 5 meter tolerance to shift our quadrant due to the tolerance on the GPS that we were using. If the problem still could not be resolved, we would re-select another point randomly to replace the problematic quadrant. We took three measurements every two meters along the perimeter of the quadrant in triplicate for accuracy improvements. In addition, we recorded the time, date, weather, and coordinates at the moment of measurement. We filled out tables located in the appendix to organize our data (See Appendix F: Numerical Data Sheets). Analyzing these measurements in combination with the pictures, videos, and written sight assessments brought us to the following findings:
1. The ambient light level varies greatly in different areas, even within just Old San Juan.
The darkest area we measured was the field surrounding El Morro. The average ambient light levels in the points around El Morro were as low as 0.007 footcandles. This is so dark that the less accurate Extech meter registered zero. Other areas such as the boardwalk in front the cruise ships had an average luminance of 1.700 footcandles. To give this some perspective, this is bright enough to read a book without any problem. Unlike sky glow, which is relatively constant over a short distance, ground level light pollution can be blocked by buildings, trees,
and geographic features. Therefore noting which geographically features are present at each of the locations is important.
The map above shows the ambient light level readings throughout all of old San Juan. These were the 27 quadrants that we successfully measured, and although not scientifically significant, one can draw conclusions about different regions and their relative brightness to others. For example, the highly commercialized area at the far West of the map is rather bright compared with that of some of the residential and public areas in the center. The West has lots of night life activities, well illuminated streets and contains the brightly light docks. However, the center of the map has more parks and homes and is relatively darker. Some of the brightest areas were also located on the right side of the map in ports and privately owned properties.
2. Even in areas of dark ambient light level, there can still be individual sources of glare.
It is important to record the maximum luminance reading in addition to the ambient light level in each quadrant so that individual luminaires can be identified. One of our quadrants was located on a shipping dock. Overall, the location was very dark with an ambient light level of
0.612 footcandles. There was an unshielded luminaire to the east of our quadrant that provided a discomfort glare to the observer, and a luminance reading of 1.453 footcandles.
3. Taking ambient light levels does not provide definitive evidence on the existence of trespass.
Trespass lighting is defined as light crossing over a property line into an area where it is not wanted. Our sample grids were randomly selected 10x10m squares without regard to
property lines. The ambient light level can give specific information about the amount of light in the city, and direct us towards areas of the city that may have problems with trespass, but it cannot give any data about trespass in the city as a whole. To gather trespass, separate case studies must be conducted that measure the light crossing into someone’s private property. Case studies must also be conducted in public areas such as those with trespass due to hotel lighting. Several people have already contacted the JCA to request case studies of their property, but we will not be conducting these due to time constraints. These will be carried out in the future by the agency.
Even though our data collection method did not relate to light trespass, we can compare the site assessments we performed to the light levels we collected in order to speculate what may or may not be major sources of trespass and glare in Old San Juan. For example, in one quadrant we saw a maximum luminance reading of 0.289 footcandles from the northeastern corner, facing south. Meanwhile, we saw a minimum reading at the southwestern corner facing north. From the pictures we took on-site, we can say that the brightness of the round, unshielded luminaires on the nearby sidewalk had a greater effect than the bright, half-shielded lights over the northern parking lot. This is most likely due to the nature of the lights, as well as the difference in proximity to the point of measurement. With this information future research can search for a
pattern and propose ways to further improve lighting in specific areas and in new luminaries, as a database of collected data grows.
COMPARING SITE ASSESSMENT DATA TO LUMINANCE
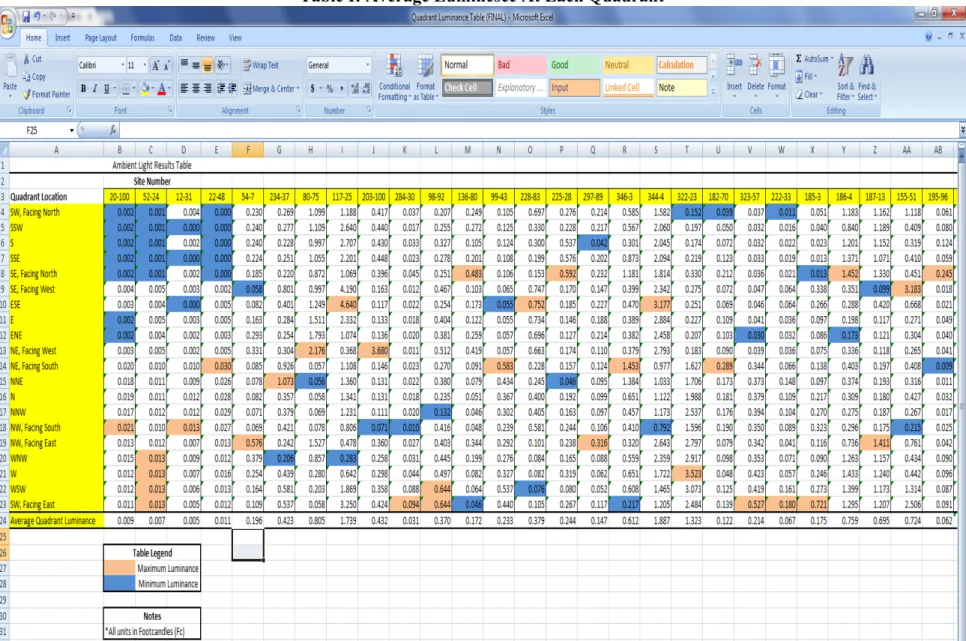
We were able to draw additional conclusions by looking at the averages and extrema for each point as a whole. The following table illustrates this method:
Quadrant Min Max Avg
20 .002 .021 .009 52 .001 .013 .007 12 .000 .013 .005 22 .000 .030 .011 54 .058 .576 .196 234 .206 1.073 .423 80 .056 2.176 .805 117 .283 4.640 1.739 203 .071 3.680 .432 284 .010 .094 .031 98 .132 .644 .370 136 .046 .483 .172 99 .055 .583 .233 228 .076 .752 .379 225 .046 .592 .244 297 .042 .316 .147 346 .217 1.453 .612 344 .792 3.177 1.887 322 .152 3.523 1.323 182 .039 .289 .122 323 .030 .527 .214 222 .011 .180 .067 185 .013 .721 .175 186 .173 1.452 .759 187 .099 1.411 .695 155 .215 3.183 .724 195 .009 .245 .062
The extrema and average of each measured point, in the order they were recorded. The data highlighted in yellow on this table represents the 5 maximum points measured under the minimum, maximum and average values measured, while the blue data represents the 5 minimum points. Some of the quadrants share two or three yellow or blue data points; these can
be determined to be the all-around brightest and darkest measured quadrants, respectively. As such, we can see that points 12, 20, 22, 52 and 284 were the darkest areas while points 117, 155, 322 and 344 were the brightest.
The quadrants 12, 20, 22 and 52 were all located on the property of El Morro, an important landmark in Old San Juan. The area is a large, unlit park with a dimly lit fortress on the northern end, water to the east and west and a tourist area including galleries, bars and a school of arts to the south. It is, therefore, easy to believe that out lowest luminance readings were taken at this site, as well as the fact that the largest readings were taken facing south
(except at point 52, where the tourist area was further east than south). Since we had not begun to take pictures at this point in our methodology, the videos taken at the sites were relied upon to perform the analysis. In most of these the picture is almost completely black except when facing the fortress or the buildings to the south. The lack of lighting here adds great contrast to the other measured points and draws attention to the tourist area of Old San Juan as an area to focus upon.
Point 284 was located in a private dock on the southeastern coastline of Old San Juan. We required special permission from the dock master to access this area, which was located in the middle of a dark parking lot. The area has a few lights surrounding it of modest brightness, then two spotlights at a distance away that light up another section of the yard to the east; these can be clearly seen in the site video:
The Two Bright Light Sources At Quadrant 284.
The largest measurements we encountered at this site were facing the east; more
specifically the spotlight on the right side of that screenshot. This location illustrates the potential dark levels of a private property, as well of the effects of lights not angled properly. The
spotlights that reach the quadrant we are measuring are not intended to bring light to the area we measured, as evidenced by the low value light readings. Therefore, they should be set up to only light up the area they should; that on the other side of the parking lot. Because the light is unshielded and aimed poorly, a massive amount of glare is created that may bother the night workers at the dock or workers on boats in the bay.
Quadrant 117 is the second brightest quadrant observed over the course of this project, with the second highest minimum and average readings as well as the highest maximum reading of 4.640 footcandles. This point was located on a stretch of grass between El Paseo del Morro and La Caleta de las Monjas. The reason the area is so bright is clear from the video: to the east and west there are extremely bright luminaries that illuminate a large wall to the north and the road, while simultaneously producing a large amount of glare since they are only partially
shielded. Meanwhile, lights from across the bay provide a decent amount of light to the area. The lights to the west produced the largest amount of light recorded during the course of the project,
while the combination of all the elements involved led to the second highest total luminance average.
"
The Direction Of The Largest Recorded Luminance Value
This shows the dangers of using unshielded lights; reflections off of nearby objects as well as their own light may cause large amounts of light glare, skyglow, and, potentially, light trespass.
Quadrant 155, located in El Paseo la Princesa, was another of the most illuminant locations in Old San Juan. This was next to a small park along the walkway, and some of the measurements were taken standing inside of a shallow pond. There was a giant ficus tree with an assortment of lights to the east, a single bright luminaire to the north, a brightly lit pathway with 10 luminaries to the south, and a dark overview of the bay to the west. Interestingly enough, the brightest reading was taken facing west and the darkest measured to the south. A potential explanation for this would be that the first measurement West would be measuring along our quadrant line to the North, as shown in this photograph:
Quadrant 155 South, Showing The East To West Quadrant Line
From this image, it can be seen that the first measurement taken facing west (from the southeastern corner) was directly impacted by two lampposts, one of which was directly above the point of measurement. In contrast, the measurement facing south from the northeastern corner, while it could have been very bright, was facing a wall with very little impact from the luminaries in the park, making it one of the darkest points measured at the site. This illustrates the differences that can exist between site assessment results and actual luminance
measurements; the brightest measurement recorded was in a direction where there should have been very little luminaires, while the lowest measurement was in a direction with almost 10 different sources of light.
Another bright area was located in a small parking lot in Muelle Frontier, in Quadrant 322. It was necessary to acquire special access to this dock from the dock master. The parking lot which we measured appeared to have very few light sources during the day, but at night it
became clear that there were many extremely bright sources that were not visible during the day, and the lamppost closest to our quadrant was much brighter than anticipated:
Quadrant 322, In The Eastern Direction
There is very little wonder that this direction contained the highest measurements taken at this quadrant. The reflection of this light off of the ground even went on to affect our other measurements, as there were no direct luminaries to the north but the light measured there was significant.
Quadrant 344 was the overall brightest quadrant we encountered. Recorded at this site were the highest minimum reading encountered, the fifth highest maximum reading, and the highest average reading. This was located in the private property of El Club Naútico de San Juan, and required special permission from the director of the club to access at night. This location was surrounded by many bright luminaries, as it was located in one of the main parking lots in the club. Additionally, the sand that made up the ground for the parking lot was extremely reflective, complementing the brightness of the lights in such a way that the entire area was illuminated. It is no wonder that the smallest reading seen here was 0.792 footcandles, and that only one other measurement fell below one footcandle.
PUBLIC OPINION
1. The initial surveying method of asking people to fill out a questionnaire was not successful.
The original survey consisted of 7 short questions on a double-sided piece of paper. However, despite the concise formatting, of all the people approached, only tourists were willing to take the time to answer it. This is understandable, as many of the people we came across in Old San Juan were out for the day with their families. Tourists from the mainland United States were the only ones who were willing to complete our survey; however, they had limited
knowledge of the lighting of San Juan and struggled to complete the questionnaire. After hours of attempting to collect responses, and only collecting four completed surveys we decided to reassess the methodology as we had previously designed it. It would not be possible for us to complete a physical survey that would give us statistically significant results, as it was not feasible to collect the statistically necessary surveys required in Old San Juan.
2. The online survey provided insight into the public opinion on light pollution.
Sr. Alicea distributed our survey to his colleagues and friends through Survey Monkey. The survey consisted of seven questions about light pollution and can be found in Appendix D: Surveys. We were able to analyze the results of 100 responders, of these the majority were women and there was a wide distribution of ages. Of the responders, 50% believe that light pollution is a very important problem in Puerto Rico. 60% have noticed an increase in artificial lighting in their neighborhood. On a scale from 0 to 10, people ranked the amount of light entering their homes from the streets at a 5 on average. The most common response to classifying the amount of discomfort from artificial light entering their home was moderate discomfort.
Two of the questions in the online survey were meant to identify the most prevalent sources of outdoor artificial lighting as well as the amount of discomfort that each source provides for those living in their direct vicinity. The five most referenced categories in the one hundred responses that we analyzed were: lamp posts, roadways and vehicles; buildings, houses, and hotels; billboards; and parks, gardens, and parking lots. Lamp posts held the second highest number of references, and were found to be moderately discomforting by 34% of those who listed it in the survey. Only a quarter of those surveyed referenced roadways and vehicles, but it shared a tie between moderately and very discomforting at a solid 28%. The most frequently referenced category was buildings, houses, and hotels. It too had a tie between moderately and very discomforting at a slightly higher 30%. Billboards placed third in terms of frequency, but they shared a tie between moderately and extremely discomforting at 34%. Much to our surprise parks, gardens, and parking lots was the only group that had its highest categories in both very and extremely discomforting. The very and extremely discomforting ratings for this category each received 33.33% of the vote.
Although the results from this survey are not statistically significant, as the amount of surveys required to accomplish this status would be large, we can see that light pollution is seen as a problem by those surveyed. At the same time it must be noted that the sample population may be biased based on their preexisting connection to the Junta de Calidad Ambiental. If nothing else, this is evidence that the research on light pollution, and the public perception of it, should continue. The tabular data from the survey can be seen Appendix D: Surveys.
Chapter 5: Conclusions and Recommendations
CONCLUSIONS ABOUT OUR METHODOLOGY
This methodology was developed based on the similar Outdoor Site-Lighting Performance method, which is used for case studies. At this point, it is time to assess the effectiveness and value of conducting this study. The goal of the study is to find ambient light levels throughout a section of the city. When viewed on an individual site basis, will this provide information beyond that which a researcher could conclude through observations? Since this method will not be directly used for enforcement, does it need to be quantified in this manner? One way to test this would be to give one researcher just the observations and pictures, and give a second researcher the observations, pictures, and the luminance readings. It would be
interesting to compare the conclusions drawn from the provided information. Another potential use for this study is the ability to come to conclusions and make general statements about the light levels for a larger surveyed area. Unfortunately, we did not take enough measurements to be statistically significant; however we are able to see the type of information that will be provided.
If this survey is continued until 54 randomly selected locations in Old San Juan are measured, statements such as the average ambient light level in Old San Juan could be made. We must ask what conclusions could be drawn from this. Old San Juan has several different land uses including residential, commercial, and tourism. The lighting requirements in these different locations are different, so higher light levels could be justifiable. If this is the case than making general statements about ambient light levels in Old San Juan may not be helpful in addressing the real problem of light pollution. Another research question is whether our method generates a
definitive ambient light level measurement. If our grid was laid out on an angle instead of lined up with the cardinal directions, would we calculate a different average ambient light level? Slight variation may be acceptable; however the directional nature of light could potentially cause significantly different results. Luminaires we measured in the cardinal directions might be ignored, while other sources that were not directly measured might be, which would likely cause a high degree of variance in the results. Despite this, we would not be able to measure both cardinal and inter-cardinal directions; if we were to rotate the quadrant 45 degrees to get those measurements, we would be creating a second quadrant that covers a different area of land. While the two quadrants might be centered on the same point, the two would have to be analyzed separately.
Additionally, we would not be able to place a circle centered at each quadrant because the distance between the opposite side of the quadrant and the point on the edge of the circle would vary based on location based on the edge of the circle. Since light values can vary so much when just a little distance is gained or reduced, this is not optimal for measuring the light values. It is also important to note that an area on a map cannot be divided into circles or octagons, which would allow analysis of all 8 directions, without ignoring a significant amount of the surface area of the zone to be observed. Therefore, while a square quadrant system based on cardinal
directions may not seem the best way to perform measurements at each point (since it potentially ignores some light values), it is the most practical way to analyze ambient lighting. In order to take this missed data into account, however, it is recommended that photographic and analytical site assessments also incorporate these directions.
RECOMENDATIONS
Old San Juan has shown to have varying levels of light readings. They differ from area to area influenced by a number of factors such as geographical obstacles. However, it can be
gathered from our research that a number of areas have light sources that spill light into areas outside of their own. This spillage is a possible cause of light trespass in residential areas. One trend that we noticed was lower income housing, especially in public apartments, had much lower light levels than wealthy residential areas. Overall, the brightest areas we visited were tourism districts. This is expected because it provides an increased level of safety. Situations like this can justify bright lighting, but abutting properties can be negatively affected if the lighting is not controlled. Our methodology is not designed to determine this, because it can be used to identify potentially problematic areas; however case studies are necessary for measuring trespass and enforcing regulations.
We recommend that the implementation of semi-cutoff, full-cutoff, and shielded lighting be promoted. The difference we were able to see when these types of lights were used was very evident both quantitatively in our measurements as well as qualitatively when the lights were viewed. These types of luminaires can decrease three types of light pollution, trespass, glare, and sky glow. Angled lights should be discouraged, when lights are angled they create unnecessary glare, can cause trespass, and waste light. This is shown in detail with examples in Appendix H.
It is highly recommended that case studies be done on specific property lines in order to precisely determine amounts of trespass into residents’ properties. A separate methodology will be needed for this. Enforcing regulations is one of the more challenging aspects of light pollution, however many other states and countries have developed protocols for this. Arizona is
considered to be one of the most progressive states, as far as light pollution is concerned, so they will have several protocols which the JCA could adopt for enforcement.
Glossary
Illuminance: The measure of light being shone on a surface, weighted to represent wavelengths visible to the human eye (Approximately between 390 nm and 770 nm). It is measured in Lux (lx), (lumens per square meter) and foot-candles (lumens per square foot).
Light Clutter: A product of light pollution that occurs when a large number of lights exist in a small area. It is usually caused by colored lights or business signs
Light Glare: A product of light pollution that occurs when a bright light source comes in direct contact with an organism, causing discomfort. !
Light Trespass: A product of light pollution that occurs when light is shone where it is not wanted, such as into private property or a natural habitat. !
Luminosity: The brightness of a light source of a certain wavelength as it appears to the eye, measured as the ratio of luminous flux to radiant flux at that wavelength
Luminous Flux: The power of light, weighted to measure the wavelengths perceived by the human eye. Luminous flux is most commonly measured in terms of its Systeme International (SI) unit, the lumen (lm).!
Natural Light: The light radiated from celestial objects as opposed to light created by man-made objects. !
Over-illumination: A product of light pollution that occurs when more lighting is produced than is actually needed. It is a key cause of the other forms of light pollution. !
Skyglow: A product of light pollution; the illumination of the nighttime sky due to artificial lighting. Blocks the visibility of stars and distorts astronomical data.!