Research Article
Genomic Analysis of a Marine Bacterium: Bioinformatics for
Comparison, Evaluation, and Interpretation of DNA Sequences
Bhagwan N. Rekadwad,
1Juan M. Gonzalez,
2and Chandrahasya N. Khobragade
11School of Life Sciences, Swami Ramanand Teerth Marathwada University, Nanded 431606, India 2Institute of Natural Resources and Agrobiology, Spanish National Research Council, IRNAS-CSIC,
Avda. Reina Mercedes 10, 41012 Sevilla, Spain
Correspondence should be addressed to Bhagwan N. Rekadwad; [email protected] Received 11 July 2016; Revised 10 October 2016; Accepted 13 October 2016
Academic Editor: Marco Bazzicalupo
Copyright © 2016 Bhagwan N. Rekadwad et al. This is an open access article distributed under the Creative Commons Attribution License, which permits unrestricted use, distribution, and reproduction in any medium, provided the original work is properly cited.
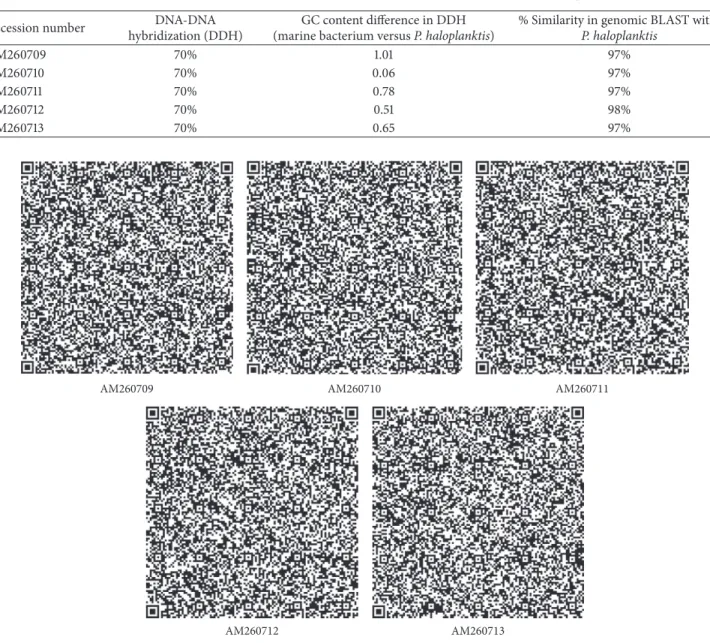
A total of five highly related strains of an unidentified marine bacterium were analyzed through their short genome sequences (AM260709–AM260713). Genome-to-Genome Distance (GGDC) showed high similarity to Pseudoalteromonas haloplanktis (X67024). The generated unique Quick Response (QR) codes indicated no identity to other microbial species or gene sequences. Chaos Game Representation (CGR) showed the number of bases concentrated in the area. Guanine residues were highest in number followed by cytosine. Frequency of Chaos Game Representation (FCGR) indicated that CC and GG blocks have higher frequency in the sequence from the evaluated marine bacterium strains. Maximum GC content for the marine bacterium strains ranged 53-54%. The use of QR codes, CGR, FCGR, and GC dataset helped in identifying and interpreting short genome sequences from specific isolates. A phylogenetic tree was constructed with the bootstrap test (1000 replicates) using MEGA6 software. Principal Component Analysis (PCA) was carried out using EMBL-EBI MUSCLE program. Thus, generated genomic data are of great assistance for hierarchical classification in Bacterial Systematics which combined with phenotypic features represents a basic procedure for a polyphasic approach on unambiguous bacterial isolate taxonomic classification.
1. Introduction
A wide range of microorganisms are isolated and identified using morphological, biochemical, and molecular features by numerous research groups worldwide. Bacterial differenti-ation and classificdifferenti-ation is a highly time-consuming proce-dure involving some ambiguous steps for the nonspecialist. Besides, most microorganisms on Earth are difficult or unable to be cultured and barely 1% of all the expected different microorganisms on our planet have been properly described [1, 2]. Recent views of the microbial community structures in nature and artificial complex environments highlight the huge diversity of microorganisms forming these communi-ties. In fact, microbial diversity is, at present, hard to deter-mine and numerous efforts are carried out on this hot topic [3, 4]. The only methodological strategy to face this enormous
microbial diversity is the use of DNA sequencing procedures and the consequent bioinformatic analyses.
In the proposed research paper an attempt has been made to digitize the marine bacterium data for the first time using short DNA sequences (16S rDNA sequences). Obtained DNA sequences are used to confirm identity of bacterial species amongst the known sequences available in databases, such as NCBI-BLAST and Ribosomal database. While identifying microorganisms using the conserved DNA sequence, mistakes frequently occur due to large number of hits with minute differences. Additionally, at present, the use of sequencing technology often lacks tools for visual inter-pretation and comparison of DNA sequences with other cells from the environment. To overcome this problem DNA digi-talization including QR code, CGR, FCGR, GC content, and PCA are proposed as potential satisfying tools for the study Volume 2016, Article ID 7215379, 7 pages
AM260709 AM260710 AM260711
AM260712 AM260713
Figure 1: QR codes of marine bacterial 16S rRNA gene sequences: AM260709–AM260713.
of genes/DNA sequences. The proposed pipeline represents a standardizable, fast, and reliable tool for identification of microorganisms up to the species level using DNA sequences.
2. Materials and Methods
The FASTA format sequences of identified bacteria (AM260709–AM260713) were retrieved from NCBI repository. These correspond to five highly similar marine bacterium isolates which we will attempt to unambiguously differentiate. Genome-to-Genome Distance Calculator tool, DSMZ (http://ggdc.dsmz.de/distcalc2.php), was used for calculation of DNA to DNA difference [5]. The DNA QR codes of identified bacterial species were generated using DNA BarID tool, http://www.neeri.res.in/DNA BarID/DNA BarID.html. The generated QR codes for the species do not resemble any other species or strains in any database. Any
user can scan these QR codes and read more information on bacterial species. This information is useful to identify and compare the QR-coded isolates or sequences. The generated data were compared with other visual techniques such as CGR and FCGR. GC contents of the marine bacteria were determined using ENDMEMO GC calculating and GC plotting tool [6, 7]. The phylogenetic tree was constructed using MEGA6. The evolutionary history was inferred using the Neighbor-Joining method. The optimal tree with the sum of branch length equaling 2.34244687 is shown. The percentage of replicate trees in which the associated taxa clustered together in the bootstrap test (1000 replicates) is shown next to the branches. The tree is drawn to scale, with branch lengths in the same units as those of the evolutionary distances used to infer the phylogenetic tree. The evolutionary distances were computed using the Maximum Composite Likelihood method and are in the
AM260713(1529bp) AM260712(1490bp)
AM260711(1490bp) AM260710(1504bp)
AM260709(1515bp)
Figure 2: CGR of marine bacterial sequences: AM260709–AM260713.
units of number of base substitutions per site. The analysis involved 5 nucleotide sequences. All positions containing gaps and missing data were eliminated. There were a total of 1480 positions in the final dataset. Evolutionary analyses were conducted in MEGA6 [8–12]. Principal Component Analysis (PCA) was carried out using multiple alignment program EMBIL-EBI MUSCLE (http://www.ebi.ac.uk/Tools/msa/mus-cle/) for comparative analysis [13–15].
2.1. Data Summary. DNA sequence data for marine bac-terium (accession nos.: AM260709–AM260713) are avail-able via the NCBI repository (http://www.ncbi.nlm.nih.gov/ nuccore).
3. Results
A total of five strains of marine bacterium short genome sequences (AM260709–AM260713) were retrieved from NCBI BioSample repository. Genomic BLAST revealed that all marine bacterium species showed 99% similarity with each other. The percentage of similarity of marine bac-terium (AM260709–AM260711 and AM260713) with Pseu-doalteromonas haloplanktis (X67024) is 97%. AM260712 showed 98% similarity with P. haloplanktisin NCBI taxo-nomic database. The Genome-to-Genome Distance (GGDC) results clearly indicated that all marine bacterium showed
70% DDH similarity with P. haloplanktis. The differences between DDH values between marine bacterium and P. haloplanktiswere ranged from 0.06% to 1.01% (Table 1). The unique quick response (QR) codes for each strain gener-ated did not show identity with any other species or gene sequences in any database (Figure 1). Each QR code occupies 2 kb to 65 kb in the computer memory space which is similar to the space occupied by DNA sequences. Chaos Game Representation (CGR) drawn and appearance of bases in the graphical representation were studied. It was visually observed that a higher number of bases concentrated on the G corner of the CGR image (Figure 2). It was observed that guanine residues were higher in number followed by cytosine. The appearance of Frequency of Chaos Game Representation (FCGR) was recorded. FCGR image has a unique pattern of distribution of nucleotides in the blocks. Increase in dark color in the block is directly proportional to the number of nucleotides. It was represented that CC and GG blocks in FCGR were darker and have higher frequency of repetition in the area in all tested marine bacterium strains (Figure 3). GC contents of marine bacterium strains were determined using ENDMEMO GC calculating and GC plotting tool using short DNA sequences. Upper and lower red lines indicate maximum and minimum GC content in the given plot. Similarly middle blue line indicates the average GC percentage in the given short DNA sequence. Maximum
A: 695 C: 818 G: 818 T: 695 Oligonucleotide length: 2 Frequency TA AA AT TT A: 706 C: 796 G: 796 T: 706 Oligonucleotide length: 2 Frequency TA AA AT TT GC
Over- or underrepresentation of oligonucleotides Chaos game representation of frequencies (FCGR) Results for both strands
A: 707 C: 820 G: 820 T: 707 Oligonucleotide length: 2 Frequency TC AG GA CT TA AC CA AA AT TG GT TT Sequence name: AM260713(1529bp) GC
Over- or underrepresentation of oligonucleotides Chaos game representation of frequencies (FCGR) Results for both strands
A: 687 C: 801 G: 801 T: 687 Oligonucleotide length: 2 Frequency CG CG TC AG GA CT TA AC CA AA AT TG GT TT Sequence name: AM260711(1490bp) GC
Over- or underrepresentation of oligonucleotides Chaos game representation of frequencies (FCGR) Results for both strands
A: 691 C: 797 G: 797 T: 691 Oligonucleotide length: 2 Frequency CG TC AG GA CT TA AC CA AA AT TG GT TT Sequence name: AM260712(1490bp)
65 53.4 44.4 67.5 54 40 0 800 2Kb AM260713 0 760 2Kb 70 52.8 40 AM260710 0 760 67.5 53.4 42.5 1Kb AM260712 0 760 2Kb AM260709 0 760 1Kb 67.5 53.7 45 AM260711
Figure 4: GC plots of marine bacterial sequences: AM260709–AM260713.
GC content was observed in marine bacterium species average 53-54% and ranged 40–70% (Figure 4). The use of QR codes, CGR, FCGR, and GC dataset helps to identify and interpret short genome sequence of isolates. The QR codes were generated using sequences. The darkness of QR codes and appearance of mosaic spot reflect the differences amongst them. The visual data of QR codes in the form of images
can be scanned using any smartphone containing QRStuff tool (http://www.qrstuff.com/qr phone software.html) and compared for presence of different nucleotides. Both CGR and FCGR can be interpreted and compared visually. Each CGR image has four corners (C, G, A, and T) forming four equal squares in each image. The number of dots appearing in each subsquare is directly proportional to the number of
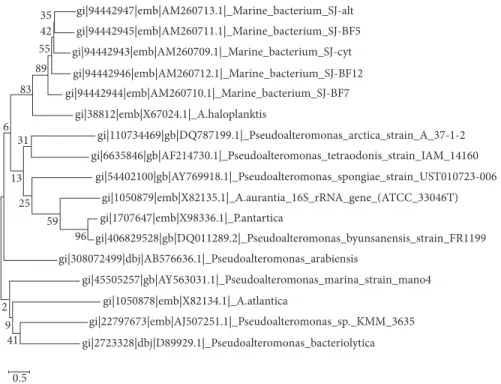
gi|1707647|emb|X98336.1|_P.antartica gi|406829528|gb|DQ011289.2|_Pseudoalteromonas_byunsanensis_strain_FR1199 gi|308072499|dbj|AB576636.1|_Pseudoalteromonas_arabiensis gi|45505257|gb|AY563031.1|_Pseudoalteromonas_marina_strain_mano4 gi|1050878|emb|X82134.1|_A.atlantica gi|22797673|emb|AJ507251.1|_Pseudoalteromonas_sp._KMM_3635 gi|2723328|dbj|D89929.1|_Pseudoalteromonas_bacteriolytica 0.5 41 96 59 9 12
Figure 5: Evolutionary relationships amongst the evaluated marine bacteria (sequences AM260709–AM260713) showing three lineages and the differentiation of the distinct strains.
nucleotides appearing in it. The number of dots is equal to the number of nucleotides. In FCGR image, a color tape is given. The color tape has lighter color indicator changing to darker and darkest color. The 12 subsquares in each FCGR were not the same. The color of each square is directly pro-portional to the number of base pairs/nucleotides. Lighter color indicates few nucleotides while darkest color indicates more numbers of nucleotides. It can be compared with color tape provided with each FCGR image. The phylogenetic tree was constructed amongst the marine bacterium strains under study using MEGA6 software. The bootstrap test was carried out using 1000 replicates (Figure 5). It is observed that marine bacterium sequences showed more similarity about more than 97% with Pseudoalteromonas haloplanktis (A. haloplanktis).Pseudoalteromonasspecies in each clad showed identity with marine bacterium. This reveals and confirms the similarity between marine bacterium and typical Pseu-doalteromonasspecies. Principal Component Analysis (PCA) was carried out using EMBL-EBI MUSCLE program. It was observed that all marine bacterium strains except marine bacterium strain SJ-alt (AM260713) fall in another plane and show slight differentiating sequence compared to the rest of the strains with sequences AM260709–AM260712 (Figure 6, Table 2). Hence, the present digital data probe to be highly useful to investigate differences amongst very similar strains. Thus, generated genomic digital data help for higher level hierarchical classification in Bacterial Systematics along with unambiguous differentiation of closely related isolates.
3.1. Impact Statement. Digital data (i.e., digitalization of data obtained from DNA sequencing) act as limelight for identi-fication, exactness, and comparison of new isolated marine
AM260709
AM260710
AM260711
AM260712 AM260713
Figure 6: Principal Component Analysis of marine bacterial strains (AM260709–AM260713) showing clear differentiation of the stud-ied marine bacterium strains forming a phylogenetically close group of bacteria.
bacterium species. At present, the differentiation of closely related bacteria and the quick bacterial identification are present major gaps and represent areas of high demand of novel initiatives for simplified and quick procedures. Digital data would be valuable for quantitative and qualitative anal-yses of newly isolated microorganisms, for example, the case of marine bacterium strains. At present, these generated data represent a baseline to any researcher by economics, rapidity, and ease of obtaining. Herein, we propose an original analysis pipeline which includes a novel bioinformatics approach generating digital data from DNA sequencing information. This is applied to the case of marine bacterium strain differ-entiation and classification.
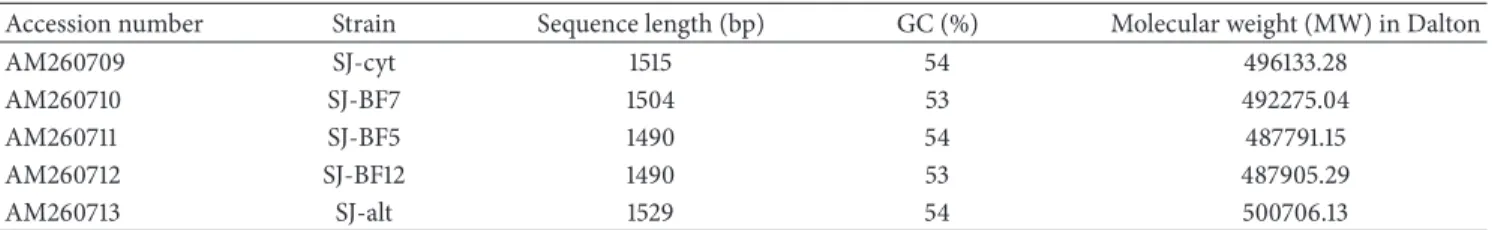
Table 2: Molecular characteristics of marine bacterium short DNA sequences.
Accession number Strain Sequence length (bp) GC (%) Molecular weight (MW) in Dalton
AM260709 SJ-cyt 1515 54 496133.28 AM260710 SJ-BF7 1504 53 492275.04 AM260711 SJ-BF5 1490 54 487791.15 AM260712 SJ-BF12 1490 53 487905.29 AM260713 SJ-alt 1529 54 500706.13
4. Discussion
This study provides a digital dataset for the identification, comparison, evaluation, and interpretation of newly isolated strains from the environmental samples. Differentiation of bacteria obtained from an environment results in a relatively complicated task when those bacteria are phylogenetically closely related and is even more problematic when one is dealing with so far unclassified bacteria (which are abundant in noncurated public repositories). An easy differentiating pipeline would be greatly useful for a large number of appli-cations including natural environments and man-generated habitats such as the clinical or industrial scenarios. The type of data generated in this study can be produced for any prokaryotic species using the protocol herein described. As well, similar types of data and analyses may be performed on eukaryote sequence data. Overall, the enlisted data and protocol will be useful to research and industry in a very broad range of disciplines. The proposed pipeline for the digital short sequence data comparisons solves the problem of identification and/or differentiation of newly detected microorganisms, above all, those closely related amongst them, either previously described or unclassified microor-ganisms. The method can be directly applied to be used with any gene, set of genes, or DNA fragments of variable nature and length. Thus, this novel approach can increase its specificity and applicability as needed. This will be a function of the DNA sequences introduced in the pipeline for analysis.
Competing Interests
The authors declare that there is no conflict of interests regarding the publication of this article.
References
[1] R. Rossell´o-Mora and R. Amann, “The species concept for prokaryotes,”FEMS Microbiology Reviews, vol. 25, no. 1, pp. 39– 67, 2001.
[2] M. S. Rapp´e and S. J. Giovannoni, “The uncultured microbial majority,”Annual Review of Microbiology, vol. 57, pp. 369–394, 2003.
[3] T. P. Curtis, W. T. Sloan, and J. W. Scannell, “Estimating prokary-otic diversity and its limits,”Proceedings of the National Academy of Sciences of the United States of America, vol. 99, no. 16, pp. 10494–10499, 2002.
[4] C. Pedr´os-Ali´o, “Marine microbial diversity: can it be deter-mined?”Trends in Microbiology, vol. 14, no. 6, pp. 257–263, 2006.
[5] J. P. Meier-Kolthoff, A. F. Auch, H.-P. Klenk, and M. G¨oker, “Genome sequence-based species delimitation with confidence intervals and improved distance functions,”BMC Bioinformat-ics, vol. 14, article 60, 2013.
[6] B. N. Rekadwad and C. N. Khobragade, “Digital data for Quick Response (QR) codes of thermophiles to identify and compare the bacterial species isolated from Unkeshwar hot springs (India),”Data in Brief, vol. 6, pp. 53–67, 2016.
[7] B. N. Rekadwad and C. N. Khobragade, “Bioinformatics data supporting revelatory diversity of cultivable thermophiles iso-lated and identified from two terrestrial hot springs, Unkeshwar, India,”Data in Brief, vol. 7, pp. 1511–1514, 2016.
[8] B. N. Rekadwad and A. P. Pathak, “First report on relevatory diversity of Unkeshwar hot spring (India) having biotechnolog-ical applications,”Indian Journal of Biotechnology, vol. 15, pp. 195–200, 2016.
[9] N. Saitou and M. Nei, “The neighbor-joining method: a new method for reconstructing phylogenetic trees,”Molecular Biol-ogy and Evolution, vol. 4, no. 4, pp. 406–425, 1987.
[10] J. Felsenstein, “Confidence limits on phylogenies: an approach using the bootstrap,”Evolution, vol. 39, no. 4, pp. 783–791, 1985. [11] K. Tamura, M. Nei, and S. Kumar, “Prospects for inferring very large phylogenies by using the neighbor-joining method,” Pro-ceedings of the National Academy of Sciences of the United States of America, vol. 101, no. 30, pp. 11030–11035, 2004.
[12] K. Tamura, G. Stecher, D. Peterson, A. Filipski, and S. Kumar, “MEGA6: molecular evolutionary genetics analysis version 6.0,” Molecular Biology and Evolution, vol. 30, no. 12, pp. 2725–2729, 2013.
[13] B. N. Rekadwad and C. N. Khobragade, “Digital data for quick response (QR) codes of alkalophilicBacillus pumilusto identify and to compare bacilli isolated from Lonar Crator Lake, India,” Data in Brief, vol. 7, pp. 1306–1313, 2016.
[14] M. A. Larkin, G. Blackshields, N. P. Brown et al., “Clustal W and clustal X version 2.0,”Bioinformatics, vol. 23, no. 21, pp. 2947– 2948, 2007.
[15] R. Chenna, H. Sugawara, T. Koike et al., “Multiple sequence alignment with the Clustal series of programs,”Nucleic Acids Research, vol. 31, no. 13, pp. 3497–3500, 2003.
Submit your manuscripts at
http://www.hindawi.com
Hindawi Publishing Corporation
http://www.hindawi.com Volume 2014
Anatomy
Research International Hindawi Publishing Corporation
http://www.hindawi.com
International Journal of
Volume 2014
Zoology
Hindawi Publishing Corporation
http://www.hindawi.com Volume 2014
Molecular Biology International
The Scientific
World Journal
Hindawi Publishing Corporation
http://www.hindawi.com Volume 2014
Hindawi Publishing Corporation
http://www.hindawi.com Volume 2014
Bioinformatics
Advances inMarine Biology
Journal ofHindawi Publishing Corporation
http://www.hindawi.com Volume 2014 Hindawi Publishing Corporation
http://www.hindawi.com Volume 2014
Signal Transduction
Journal ofEvolutionary Biology
International Journal of Hindawi Publishing Corporation
http://www.hindawi.com Volume 2014
Hindawi Publishing Corporation
http://www.hindawi.com Volume 2014 Biochemistry Research International
Archaea
Hindawi Publishing Corporation
http://www.hindawi.com Volume 2014
Hindawi Publishing Corporation
http://www.hindawi.com Volume 2014
Genetics
Research International
Hindawi Publishing Corporation
http://www.hindawi.com Volume 2014
Hindawi Publishing Corporation
http://www.hindawi.com Volume 2014
Enzyme
Research
Hindawi Publishing Corporation
http://www.hindawi.com Volume 2014
International Journal of