Explaining the diversification discount
39
0
0
Full text
(2) The CIIF (Centro Internacional de Investigación Financiera) is being set up as a result of concerns from an interdisciplinary group of professors at IESE about financial research and will function as part of IESE’s core activities. Its objectives are: to unite efforts in the search for answers to the questions raised by the managers of finance companies and the finance staff of all types of companies during their daily work; to develop new tools for financial management; and to go more deeply into the study and effects of the transformations that are occurring in the financial world. The development of the CIIF’s activities has been possible thanks to sponsorship from: Aena, A.T. Kearney, Caja Madrid, Datastream, Grupo Endesa, Fundación Ramón Areces, Telefónica and Unión Fenosa..
(3) EXPLAINING THE DIVERSIFICATION DISCOUNT. Abstract Diversified firms trade at a discount relative to similar single-segment firms. We argue in this paper that this observed discount is not per se evidence that diversification destroys value. Firms choose to diversify. Firm characteristics which make firms diversify might also cause them to be discounted. Not taking into account these firm characteristics might lead to the observed discount being wrongly attributed to diversification. Data from the Compustat Industry Segment File from 1978 to 1996 are used to select a sample of single-segment and diversifying firms. We use three alternative econometric techniques to control for the endogeneity of the diversification decision. All three methods suggest the presence of selfselection in the decision to diversify and a negative correlation between firms’ choice to diversify and firm value. The diversification discount always drops, and sometimes turns into a premium, when we control for the endogeneity of the diversification decision. We do a similar analysis in a sample of refocusing firms. Again, some evidence of self-selection by firms exists and we now find a positive correlation between firms’ choice to refocus and firm value. These results consistently suggest the importance of taking the endogeneity of the diversification status into account when analyzing its effect on firm value. We thank Ben Esty, Stuart Gilson, Bill Greene, Charles Himmelberg, Vojislav Maksimovic, Scott Mayfield, Richard Ruback, Myles Shaver, Jeremy Stein, Emilio Venezian and seminar participants at Harvard Business School, Western Finance Association Meetings at Los Angeles, NBER Summer Conference in Corporate Finance, Cornell University, Georgetown University and Rutgers for helpful comments. We thank Sarah Woolverton for help with the data. Simi Kedia gratefully acknowledges financial support from the Division of Research at Harvard Business School. All errors remain our responsibility..
(4) EXPLAINING THE DIVERSIFICATION DISCOUNT. Firms choose to diversify. They choose to diversify when the benefits of diversification outweigh the costs of diversification and stay focused when they do not. The characteristics of firms that diversify which make the benefits of diversification greater than the costs of diversification may also cause firms to be discounted. A proper evaluation of the effect of diversification on firm value should take into account the firm-specific characteristics which bear both on firm value and on the decision to diversify. Research by Lang and Stulz (1994), Berger and Ofek (1995) and Servaes (1996) shows unambiguously that diversified firms trade at a discount relative to non-diversified firms in their industries. Other research confirms the existence of this discount on diversified firms and this result seems to be robust to different time periods and different countries (1). There is a growing consensus that the discount on diversified firms implies a destruction of value on account of diversification, i.e. on account of firms operating in multiple divisions. This study shows that the failure to control for firm characteristics which lead firms to diversify, and to be discounted, may wrongly attribute the discount to diversification instead of to the underlying characteristics. For example, consider a firm facing technological change which adversely affects its competitive advantage in its industry. This poorly performing firm will trade at a discount relative to other firms in the industry. Such a firm will also have lower opportunity costs of assigning its scarce resources in other industries, and this might lead it to diversify. If poorly performing firms tend to diversify, then not taking into account past performance and its effect on the decision to diversify will result in attributing the discount to diversification activity rather than to the firm’s poor performance. Also consider the case of a firm that possesses some unique organizational capability that it wants to exploit. Incomplete information may force this firm to enter into costly search through diversification to find industries with a match to its organizational capital. Matsusaka (1995) proposes a model in which a value maximizing firm forgoes the benefits of specialization to search for a better match. During the search period the market value of the firm will be lower than the value of a comparable single-segment firm. Maksimovic and Philips (1998) also develop a model where the firm optimally chooses the number of segments in which it operates depending on its comparative advantage. Not taking into account firm characteristics which make diversification optimal, in this case searching (1) Servaes (1996) finds a discount for conglomerates during the 1960s, while Matsusaka (1993) documents gains to diversifying acquisitions in the late 1960s in the United States. Lins and Servaes (1999) document a significant discount in Japan and UK, though none exists for Germany. The evidence from emerging economies is mixed. While Khanna and Palepu (1999), Fauver, Houston and Naranjo (1998) find little evidence of a diversification discount in emerging markets, Lins and Servaes (1998) report a diversification discount in a sample of firms from seven emerging markets..
(5) 2. for a match, may again attribute the discount wrongly to value destruction arising from diversification. This does not imply that there are no agency costs associated with firms operating in multiple divisions. Consider the impact of cross sectional variation in private benefits of managers. A firm with a manager who has high private benefits will undertake activities which are at conflict with shareholder value maximization. Such a firm will be discounted relative to other firms in its industry. Such a manager is also more likely to undertake valuedestroying diversification. However, even in this case the observed discount on multisegment years is partially accounted for by the ex ante discount at which the firm is trading, on account of high private benefits, before diversification. Not taking into account firm characteristics, in this case high agency costs, leads to an overestimation of the value destruction attributed to diversification. In this paper, we attempt to control for this endogeneity of a firm’s decision to diversify when evaluating the effect of diversification on firm value. The arguments suggest that the decision to diversify depends on the presence of firm-specific characteristics that lead some firms to generate more value from diversification than others. Choice of organization structure should therefore be treated as an endogenous outcome that maximizes firm value, given a set of exogenous determinants of diversification, i.e. the set of firm characteristics. Evaluating the impact of diversification on firm value therefore requires taking into account the endogeneity of the diversification decision. Controlling for the endogeneity of the diversification decision requires identifying variables that affect the decision to diversify while being uncorrelated with firm value. This becomes difficult as most variables that bear on the diversification decision also impact firm value. We build on the methodology of Berger and Ofek (1995) and the insights of Lang and Stulz (1994) to control for the endogeneity of the diversification decision. Like Berger and Ofek (1995), we value firms relative to the median single-segment firm in the industry. This measure has the advantage of being neutral to industry and time shocks that affect all firms in a similar way. However, Lang and Stulz (1994) show that industry characteristics are important in a firm’s decision to diversify (2). We explore the data for systematic industry differences among single-segment and diversifying firms that might help explain the decision to diversify. We first reproduce the results existing in the literature and identify a diversification discount in our sample. Preliminary data analysis shows that conglomerates differ from singlesegment firms in their underlying characteristics. We control for the endogeneity of the diversification decision in three ways. Firstly, we control for unobservable firm characteristics that affect the diversification decision by introducing fixed firm effects. Secondly, we model the firm’s decision to diversify as a function of industry, firm and macroeconomic characteristics. We use the probability of diversifying as an instrument for the diversification status in evaluating the effect of multiple-segment operations on firm value. Lastly, we model an endogenous self-selection model and use Heckman’s correction to control for the selfselection bias induced on account of a firm’s choosing to diversify. The diversification discount always drops, and sometimes turns into a premium, when we control for the endogeneity of the diversification decision. The evidence in all three. (2) Lang and Stulz (1994) find that firms that diversify tend to be in slow-growing industries. They also report that diversified firms have lower Tobin’s q than focused firms, but this difference was driven by differences among firms across industries rather than within an industry..
(6) 3. methods indicates that the discount on multiple-segment firm-years is partly due to endogeneity. The coefficient of the correction for self-selection is negative, indicating that there is a negative correlation between a firm’s choice to diversify and firm value. This supports the view that firm characteristics, which cause firms to diversify, also cause them to be discounted. Finally, we do a similar analysis in a sample of refocusing firms. Comment and Jarrell (1995), John and Ofek (1995) and Berger and Ofek (1996) document an increase in firm value associated with the decision to refocus. Much like the decision to diversify, the decision to refocus is also endogenous: Firms choose to refocus when the presence of firm-specific characteristics makes the benefits of refocusing greater than the costs of refocusing (3). Consider the case when changes in industry conditions generate higher-than-expected growth opportunities in one segment. This might increase the cost of an inefficient internal capital market, increasing the cost of operating in multiple divisions and making refocusing optimal. In this case, firm characteristics which make the refocusing decision optimal, i.e. growth opportunities, also cause the firm to be more highly valued. Unlike the diversification decision, the refocusing decision is positively correlated with firm value. Not taking firm characteristics (in this case growth opportunities) into account prior to refocusing may erroneously attribute the associated premium to multi-segment operations of firms. This would lead to an underestimation of the discount associated with multi-segment operations prior to refocusing. Controlling for firm characteristics which make the refocusing decision optimal may further increase the discount associated with multi-segment operations of these firms. We document evidence in support of this view. The rest of the paper is organized as follows. In the next section we briefly discuss related literature. Section III describes the data, sample selection criteria and preliminary analysis. Section IV discusses the estimation methodology. Section V presents the evidence for diversifying firms and Section VI does the same for refocusing firms. Section VII concludes.. Related literature There is a vast and well-developed literature on the benefits and costs of diversification. The gains from diversification could arise from many sources. Gains to diversification arise from managerial economies of scale as proposed by Chandler (1977) and from increased debt capacity as argued by Lewellen (1971). Diversified firms also gain from more efficient resource allocation through internal capital markets. Weston (1970) argues that the larger internal capital markets in diversified firms help them allocate resources more efficiently. Stulz (1990) shows that larger internal capital markets help diversified firms reduce the underinvestment problem described by Myers (1977). Stein (1997) argues that the winner-picking ability of headquarters may allow internal capital markets in diversified firms to work more efficiently than external capital markets. Gains to diversification also arise from the ability of diversified firms to internalize market failures. Khanna and Palepu (1999) document gains to business group. (3) In a static model, the above arguments would suggest that when the net benefit to operating in multiple segments is negative, the firm should immediately refocus. In practice, the decision to diversify and refocus involves large amounts of sunk and irreversible costs that lead to a lot of persistence in diversification status. There is as yet no clear understanding of the dynamic theory of firms’ diversification status, but one can draw an analog from recent theory on irreversible investment decisions (see Dixit and Pindyck, 1994). This literature has emphasized that temporary shocks can have permanent effects due to hysteresis, which is consistent with an observed discount of multiple-segment firms..
(7) 4. affiliation in India and emphasize the role of diversified groups in replicating the functions of institutions that are missing in emerging markets. Hadlock, Ryngaert and Thomas (1998) argue that diversified firms gain from a reduction of the adverse selection problem at the time of equity issues. Montgomery and Wernerfelt (1988), Matsusaka and Nanda (1994) and Bodnar, Tang and Weintrop (1998) propose gains to diversification based on the presence of firm specific assets which can be exploited in other markets. Schoar (1999) finds that diversified firms are more productive than firms within their industry on average, though they still appear to be discounted. There are costs to diversification as well. The costs can arise from inefficient allocation of capital among divisions of a diversified firm. Stulz (1990) and Scharfstein (1998) show that diversified firms invest more than single-segment firms in poor lines of business or in businesses with low Tobin’s q. Lamont (1997) and Rajan, Servaes and Zingales (1997) also report evidence on inefficient allocation of capital within conglomerates. Meyer, Milgrom and Roberts (1992) make a related argument of cross subsidization of failing business segments. The difficulty of designing optimal incentive compensation for managers of diversified firms also generates costs of multi-segment operations. Aron (1988, 1989), Rotemberg and Saloner (1994) and Hermalin and Katz (1994) show the greater difficulty of motivating managers in diversified firms in comparison to focused firms. Information asymmetries between central management and divisional managers will also lead to higher costs of operating in multiple segments, as has been shown by Myerson (1982) and Harris, Kriebel and Raviv (1982). Lastly, costs of operating in multiple segments could arise on account of increased incentive for rent seeking by managers within the firm (see Scharfstein and Stein (1997)) and opportunities for managers of firms with free cash flow to engage in value destroying investments (see Jensen (1986), (1988)). Denis, Denis and Sarin (1997) provide empirical evidence that agency costs are related to the diversification decision. They find that the level of diversification is negatively related to managerial ownership. Hyland (1999) examines firm characteristics including agency costs, and finds no support that agency costs explain the decision of firms to diversify. Our focus in this paper is not on identifying any of the above-mentioned individual benefits and costs of diversification, but rather to concentrate on the net gain to diversification. Firms are likely to diversify when there are net gains to diversification and stay focused when there are net costs to diversifying. Most importantly for us, the above research shows that the benefits and costs of diversification are related to firm-specific characteristics. We control for firm characteristics which cause firms to diversify, i.e. which generate a net gain to multi-segment operations, and isolate the net impact of the diversification decision. Our paper is not the first to take into account the endogeneity of the diversification decision. A growing theoretical literature has been modeling the decision to diversify as a value increasing strategy for the firm. Matsusaka (1995) develops a model in which the firm chooses to diversify when the gains from searching for a better organizational fit outweigh the costs of reduced specialization. Fluck and Lynch (1999) propose that diversification allows marginally profitable projects which could not get financed as stand-alone entities to get financed. Perold (1999) models the diversification decision in financial intermediaries and shows that diversification reduces firms’ deadweight costs of capital and so permits divisions to operate on a larger scale than stand-alone firms. Maksimovic and Philips (1998) also develop a model where the firm optimally chooses the number of segments in which to operate depending on its comparative advantage. They further show empirically that conglomerates allocate resources optimally, based on the relative efficiency of divisions..
(8) 5. There has been other recent empirical work that provides evidence in support of the importance of selection bias and the endogeneity of the diversification decision. Chevalier (2000) finds that even prior to merging, diversifying firms display investment patterns that could be identified as cross subsidization. Whited (1999) finds that after controlling for the measurement problems in Tobins Q, there is no evidence of inefficient allocation of resources in diversified firms. Graham, Lemmon and Wolf (1999) propose that diversified firms are discounted because they acquire discounted firms.. Data Sample Selection The sample consists of all firms with data reported on the Compustat Industry Segment database from 1978 to 1996. We follow the Berger and Ofek (1995) [from here on BO(95)] sample selection criteria and exclude from the sample years where firms report segments in the financial sector (SIC 6000-6999), years with sales less than $20 million, years with a missing value of total capital and years in which the sum of segment sales deviated from total sales by more than 1% (4). Additionally, we excluded years where the firm did not report four-digit SICs for all its segments. The final sample consists of 8,815 firms with a total of 58,965 firm years. Measure of Excess Value To examine whether diversification increases or decreases value, we use the excess value measure developed by BO (95), which compares a firm’s value to its imputed value if each of its segments operated as a single-segment firm. Each segment of a multiple-segment firm is valued using median industry sales and asset multipliers of single-segment firms. The imputed value of the firm is the sum of the segment values. Excess value is defined as the log of the ratio of firm value to imputed value. Negative excess value implies that the firm trades at a discount while positive excess values are indicative of a premium (5).. (4) Years with segments in the financial services were excluded on account of the difficulty in valuing financial firms using multipliers. Years with sales less than 20 million dollars were excluded to prevent distortions caused by including very small firms. (5) The imputed value of a segment is obtained by multiplying segment sales (asset) with the median sales (asset) multiplier of all single-segment firm years in that SIC. The sales (asset) multipliers are the median value of the ratio of total capital to sales (assets). Total capital is the sum of market value of equity, long and short-term debt and preferred stock. The industry definitions are based on the narrowest SIC grouping that includes at least 5 firms. Extreme excess values, where the natural log of the ratio of actual to imputed value is greater than 1.386 or less than –1.386, were excluded. The imputed value using sales multipliers of about 50% of all firms was based on matches at the four-digit SIC code, 26.5% were based on matches at the three-digit SIC code and 23.5% were based on matches at the two-digit or lower SIC code. The results using asset multipliers are similar. This is in line with the results reported in BO (95) of 44.6% matches at the four-digit level, 25.4% matches at the three-digit level and 30% matches at the two-digit level or lower. See BO (95) for further details on methodology..
(9) 6. Documenting the Discount In this section, we document the existence of a discount in line with prior work. We find that the median discount on multi-segment years is 10.9% (11.6%) using sales (asset) multipliers for the entire sample from 1978 to 1996, similar to the discount of 10.6% (16.2%) reported by BO (95) for the years 1986 to 1991 (6). We begin by estimating a model of excess value as specified by BO (95) so as to guarantee that any differences in the final results are not driven by differences in sample or methodology. They model excess value as a function of firm size, proxied by log of total assets, profitability (EBIT/SALES), investment (CAPX/SALES) and diversification, proxied by D, a dummy which takes the value 1 for years when the firm operates in multiple segments and zero otherwise. As seen in Table I, the coefficient of D is –0.13 (–0.12) and significant at the 1% (1%) level when sales (assets) multipliers are used. When we restrict the sample to the years 1986-1991, the coefficient of D is –0.12 (–0.13) using sales (asset) multipliers, which is very close to the value of –0.144 (–0.127) reported by BO (95). The estimated discount in our sample is similar to that documented by BO (95). We test the robustness of the estimated discount to model specification by including lagged values of firm size, profitability and investment. Past profitability and investment may control for firm characteristics which affect firm value. We also include log of total assets squared to control for the possibility of a non-linear effect of firm size on firm value. The coefficient of the square of firm size is negative, suggesting that the positive effect of firm size on excess value diminishes as firm size increases. We also include the ratio of long-term debt to total assets. The results, reported in columns 3 and 6 of Table 1, show that the estimated discount is about 11% with both sales and asset multipliers. There is weak evidence that firms with high past profitability (high EBIT/SALES) and high past investments (high CAPX/SALES) are valued higher than the median single-segment firm in the industry, though the coefficients are not significant. Summarizing, multiple-segment firms show a significant discount and this discount is robust to the inclusion of additional variables in the valuation equation. We report all results with this extended model. As a comparison, the results with the basic BO (95) model are similar and are discussed in Sections 5.5 and 6.5.. Are multi-segment firms different? In this section, we examine the characteristics of conglomerates which might cause them to diversify. We also examine if conglomerates differ from single-segment firms in their underlying characteristics. (6) For the years 1986 to 1991, we find that the median multiple-segment discount in our sample is 7.6% (10.3%) using sales (asset) multipliers. This difference with the BO (95) results is possibly due to a difference in sample size. The number of firm years, in the period 1986 to 1991, in our sample is 17875, greater than the 16181 reported by BO (95). There are 4565 firms in our sample as opposed to 3659 firms reported by BO (95). Our sample size is larger by 1142 (977) observations when using sales (asset) multiplier regressions. This increase in the sample size could arise on two accounts. Firstly, if firms restate their results such that they are no longer excluded due to one or more sample selection criteria, they might be included in our sample while not being included in the BO (95) sample. Secondly, Compustat might add firms to the database along with the data for prior years. The largest category in this group (according to Compustat sources) consists of small firms which trade on OTC markets and are added when they change listing or on client request. Our overall sample, from 1978 to 1996, of 8815 firms and 58965 observations is similar to the sample of 8467 firms and 58332 observations reported by Graham, Lemmon and Wolf (1999)..
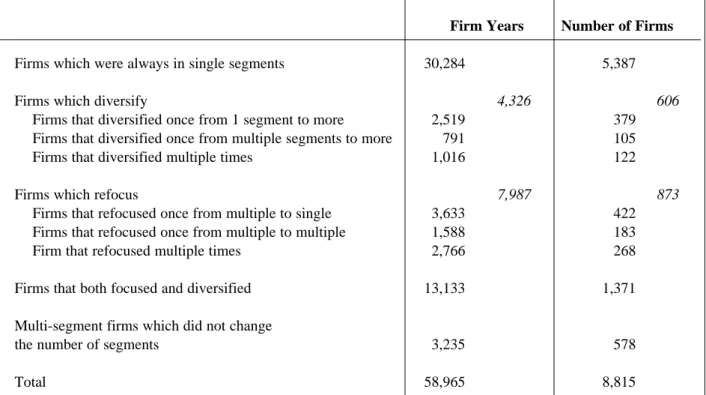
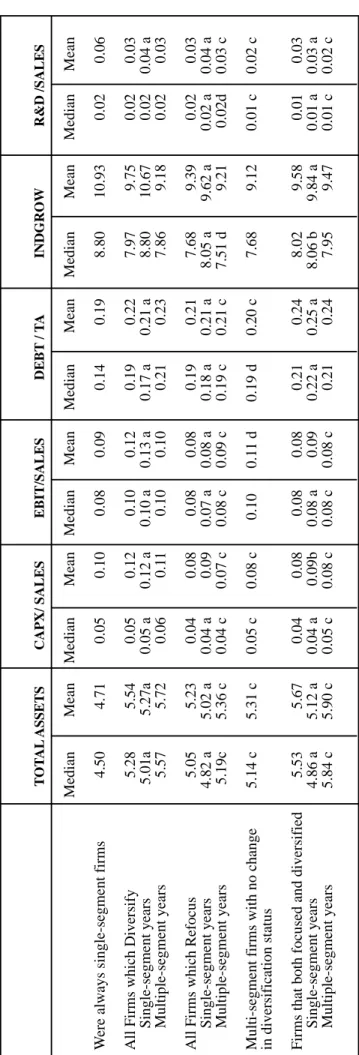
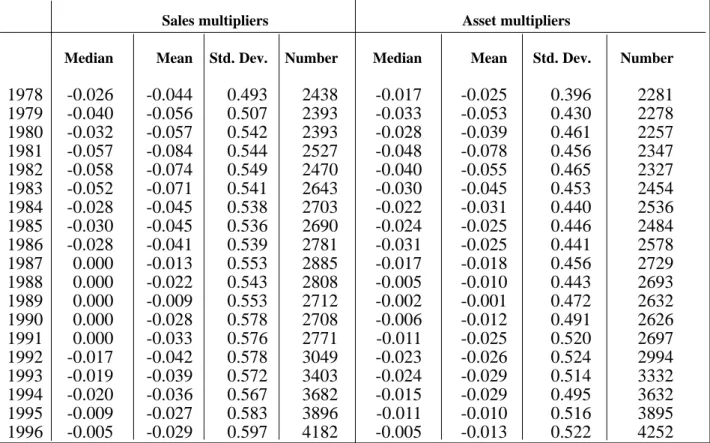
(10) 7. The 8,815 firms in our sample differ in their diversification profiles. The largest group consists of 5,387 single-segment firms, which accounted for 30,284 firm years, as shown in Table II. The rest are firms which report operating in multiple segments at some point in the time period under consideration. These firms will be referred to as multiplesegment firms or conglomerates in the paper. Among these multiple-segment firms, there were broadly four kinds: Firms which diversify, those that refocus, those that do both and lastly conglomerate firms which do not change the number of segments in which they operate. The largest group consists of 1,371 firms (13,133 firm years) which report both increasing and decreasing the number of segments in this time period. The next largest group consists of 873 firms (7,987 firm years) who refocused. There are 606 firms (4,326 firm years) which report diversifying in this period (7). Next we examine the characteristics of single-segment and multiple-segment firm years. Table III reports average value of firm size, investment, profitability, leverage, research and development and industry growth rates for the different diversification profiles. Industry growth rate is the increase in industry sales, defined at the two-digit SIC level. SIC classification was obtained from the business segment data. Divisional sales for conglomerates were included in the respective SICs for the calculation of total industry sales (8). Single-segment years of conglomerates are significantly different from single-segment firms in their characteristics. Single-segment years of conglomerates are bigger, have higher leverage and lower R&D than single-segment firms. This is consistent with Hyland (1999), who finds that diversifying firms have lower research and development expenses. With regard to CAPX/SALES and EBIT/SALES, not only do single-segment years of conglomerates differ from single-segment firms, but they also differ significantly among them. Single-segment years of diversified firms have higher CAPX/SALES and higher EBIT/SALES, while single-segment years of refocusing firms and firms which both refocus and diversify have lower CAPX/SALES and lower EBIT/SALES than single-segment firms. In summary, firm characteristics differ across single-segment years in different diversification profiles. There are also significant differences in the characteristics of multi-segment years of conglomerates. Multiple segment years of diversifying firms tend to invest more in research and development (RND/SALES) than others. They also have higher capital investment (CAPX/SALES) and higher profitability (EBIT/SALES) than multiple-segment years of refocusing firms and firms which both refocus and diversify. Conglomerates that do not change diversification status seem to be in mature industries with lower growth and have low research and development costs while enjoying a higher profitability (EBIT/SALES) and higher capital investment (CAPX/SALES). Multiple segment years of refocusing firms tend to have the lowest profitability and capital investment. This suggests that differences in characteristics of multiple-segment years might be related to the choice of diversification strategy. Next we examine the characteristics of the discount over time and across the different diversification profiles. Table IVa documents the average annual discount from 1978 to 1996 estimated using sales and asset multipliers. There is substantial variation, with the (7) Firms were classified using all available data, i.e. the years excluded on account of sample selection criteria were also taken into account for the purpose of categorizing firms. This ensures that restructuring activity in years that were excluded from the sample is also taken into account. (8) Total industry sales is a function of firms entering and leaving Compustat, of restructuring activities of firms and of accounting changes which cause firms to report sales in different SICs over the years. These growth rates therefore have been estimated with noise and have high volatility..
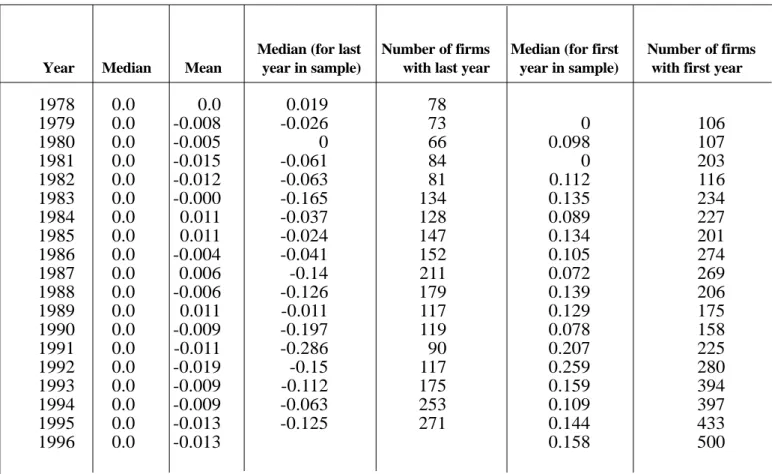
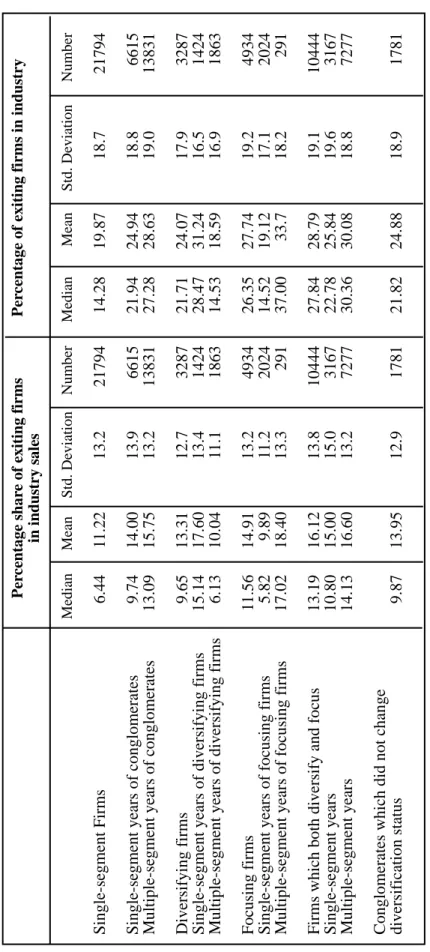
(11) 8. median discount using sales multipliers being as low as –0.058 in 1982 and zero for years 1987 to 1991. The excess value measures firm value relative to the median single-segment firm in the industry for that year. This makes the excess value measure industry- and timeneutral. What generates these time patterns in the excess value measure? Time patterns in the excess value measure could arise on account of two factors. Firstly, the distribution of single-segment firms around the median could change. As can be seen from Columns 2 and 3 of Table IVb, though the median excess value of all single-segment firm years used to estimate median industry multipliers is zero by construction, the mean varies from –0.02 in 1992 to +0.01 in 1989. Secondly, time effects could also arise on account of entry and exit of firms in the sample. Table IVb, columns 4-7, documents the average annual excess values (using sales multipliers) for the last and first year of firms in the data. There are two interesting facts which emerge from Table IVb. First, firms have negative excess value in the last year in the data. This effect is not limited to just the last year in the dataset but these firms are not average discounted. Let us refer to these firms that exit the sample, i.e. are included in the Compustat research tapes, as exiting firms. In contrast, new firms in the data set have positive excess values in their first year. These new firms entering the data are valued systematically higher relative to the median single-segment firm in the industry. Secondly, there is variation over time in the number of firms exiting and entering the data. Exit (entry) of firms with low (high) excess values reduces (raises) the median industry multiplier in that year, consequently increasing (decreasing) the relative valuation of existing firms in the industry. Though the median excess values of single-segment years have been normalized to zero, the median excess values of conglomerates will have a time pattern related to the changes in industry composition rather than to changes in its intrinsic value. This would not be of much concern in the estimation of the impact of diversification status on firm value if firms entered and exited the sample randomly. This is because the values of all firms, single and conglomerate, change proportionately over time, leaving the relative valuation of multiple-segment firm years unchanged. However, if changes in industry composition are not random but related to the decision of firms to diversify or refocus, then changes in industry composition become a source of concern. Consider, for instance, a firm which diversifies when poorly performing firms in the industry exit on account of few growth opportunities in the industry. Exit of poor performers raises the median industry multiplier and increases the imputed value of the diversifying firm when it diversifies. This will cause the firm to trade at a discount after diversification. This discount is due to change in industry composition (exit of poor performers), which is correlated with the decision to diversify, rather than due to any change in the firm’s intrinsic value. To examine whether changes in industry composition differ by diversification decision, we study the distribution and percentage sales accounted for by exiting firms. For each firm, we calculate the share of sales accounted for by exiting firms in their industry (at the two digit SIC level) for that year. For conglomerates, we weight each segment’s exposure to exiting firms by its sales. We also calculate the fraction of all firms in an industry that exit. Table IVc documents the average exposure to exiting firms for the different diversification profiles, and highlights some interesting patterns. Single-segment years of diversifying firms operate in industries with the highest incidence of exit. In these industries, 28% of all firms exit in a given year and the exiting firms account for 15% of industry sales. Single-segment firms in contrast belong to industries where exiting firms account for only 14% of all firms and 6% of industry sales. While single-segment years of diversifying firms have the highest exposure to exiting firms, multiple-segment years of diversifying firms have one of the lowest exposures to exiting firms. In contrast, single-segment years of refocusing firms operate in industries with the lowest fraction of exiting firms while multiple-segment years of.
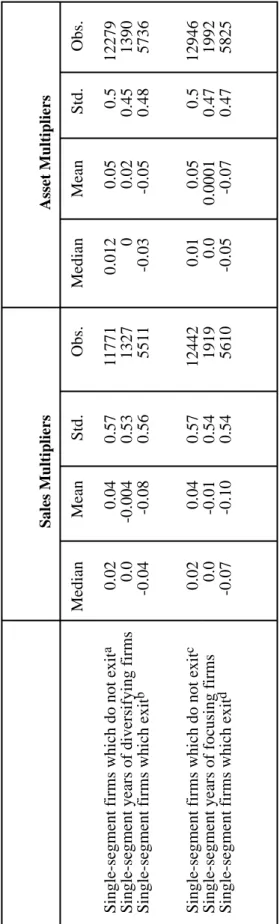
(12) 9. refocusing firms tend to be in industries with the highest incidence of exiting firms. We observe that firms are moving towards industries where the exit rate is significantly lower, which suggests that firms both diversify and refocus, from industries experiencing difficulties (higher exit) into industries with better prospects (lower exit). This also supports the finding in Lang and Stulz (1995) that diversifying firms tend to be in bad industries characterized by higher exit. This is consistent with our view that firms endogenously choose to diversify and refocus and indicates that changes in industry composition are related to the firms’ diversification strategy. Firms also show systematic patterns in their discounts prior to whether they decide to diversify or exit the industry. Single-segment years of diversifying firms do not trade at a discount. This indicates that these firms do not do badly compared to the median firm in the industry prior to diversifying. However, as seen from Table IVc these firms are in industries with high incidence of exit. Combining these two results suggests that single-segment years of diversifying firms might be better than the firms which exit the industry but worse than the firms which continue as single-segment firms in the industry. This intuition is confirmed by the statistics reported in Table IVd. Single-segment years of diversifying firms which do not exit, have a median discount of zero. This is better than the 4% discount for single-segment firms in the same four-digit SIC which exit and worse than the 2% premium for singlesegment firms in the same four-digit SIC which do not exit. Summarizing, there are significant differences in firm characteristics between singlesegment firms and single-segment years of conglomerates. There are also significant differences in firm characteristics between multiple-segment years of conglomerates with different diversification profiles. There are also differences in industry compositions over time. Firms which diversify (focus) come from industries with high exit rates. These firms have values prior to diversification that are significantly higher than those of firms that exit the industry but lower than those of the firms that remain as single-segment firms. These changes in industry composition seem to be correlated with the decision to diversify and refocus. We will try to control for both firm specific as well as these industry specific changes which might cause the decision to diversify/refocus to be correlated with the estimated discount. The next section discusses the methodology to control for this endogeneity.. Estimation methodology We examine the effect of diversification on firm value by modeling firm value as a function of firm characteristics. We define our measure of relative firm value, Vit, as: Vit = δ 0 + δ1 Xit + δ 2 Dit + eit. (1). where Xit is a set of exogenous observable characteristics of the firm, Dit is a dummy variable that takes the value of 1 if the firm operates in more than one segment and 0 otherwise, δ = {δ0, δ1, δ2} is a vector of parameters to be estimated, and eit is an error term. Our hypothesis is that firms that choose to diversify are not a random sample of firms. If the decision of these firms to diversify is correlated with the relative value of the firm, Dit will be correlated with the error term in equation (1). The OLS estimate of δ2 will therefore be biased. Specifically, we assume that a firm’s decision to diversify is determined by.
(13) 10. Dit* = βZit + µit Dit = 1 if Dit* > 0. (2). Dit = 0 if Dit < 0 where Dit* is an unobserved latent variable, Zit is a set of firm characteristics that affect the decision to diversify, and µit is an error term. The correlation between Dit and eit in equation (1) will arise when: (a) some of the exogenous variables in the diversification equation, Zit, affect the firm’s relative value but are not included as regressors in the value equation; or (b) the error terms eit and µit are correlated. In either case the estimation of δ2 using ordinary least squares will be biased. We use three different techniques to control for the correlation between Dit and eit in equation (1) and come up with an unbiased estimator of δ2. First, we take advantage of the availability of a panel data-set and use a fixed-effect estimator in equation (1), assuming that all the unobserved heterogeneity that leads to the correlation between the error terms is constant over time. Secondly, we attempt to jointly estimate equations (1) and (2) in a simultaneous equation framework. The estimation of this system of simultaneous equations is not easy because the natural instruments for Dit, the observed firm characteristics, are already included in the firm value equation (equation (1)), causing the system to be unidentified (9). As Vit is the firm’s value relative to the median firm in the industry in any given year, it is, by construction, independent of any observable characteristics which affect the value of all firms in a given industry and year in the same manner (10). Lang and Stulz (1994) show that industry characteristics influence the decision to diversify. Maksimovic and Philips (1999) highlight the importance of time characteristics and document that assets are reallocated across firms during economic expansions. We too have documented systematic patterns at the industry level that result in a correlation among a firm’s relative value and its decision to diversify (11). To capture the overall attractiveness of a given industry to conglomerates, we use the fraction of all firms in the industry which are conglomerates (PNDIV). The higher the fraction of multi-segment firms (PNDIV), the more attractive the industry factors are to diversification (12). We also include, for each firm, the fraction of sales by other firms in the industry accounted for by diversified firms (PSDIV). As these two variables are highly correlated, we evaluate them jointly to determine the effect of industry factors on the diversification decision. We instrument time effects on the diversification decision in various ways. Firstly, we capture time trends as evidenced by the existence of merger waves. We (9) Strictly speaking, identification could be obtained only from the non-linearity of Dit in equation (2), but relying exclusively on the functional form will lead to very weak identification. (10) Notice that the estimation of equation (1), where Vit is defined as firm value relative to the median firm in an industry, is almost analogous to the estimation of an industry fixed-effect estimator. (11) As stated in the introduction, Lang and Stulz (1994) report that diversified firms have on average lower Tobin’s q than single-segment firms, and that the q for diversifying firms was not significantly lower than the q for the median firm in their industry. This observation led them to the conclusion that industry characteristics influence the decision to diversify. These industry characteristics could, therefore, serve as instruments for diversification. Wernerfelt and Montgomery (1988) also find significant industry effects. (12) The industry specific factors which influence the decision to diversify may range from changes in industry regulation, introduction of new technology, market structure and business risk. We use two-digit SIC codes for industry classification. Firms were classified into industries based on their segment SIC. For conglomerates we use a sales weighted average of all its segments..
(14) 11. include the number of merger/acquisition announcements in a given year (MNUM). The more active the market for mergers/acquisitions, the higher the probability that a firm will diversify. We also include the annual value of announced merger/acquisitions, in billions of US $ (MVOL). Secondly, we capture time trends in the macroeconomic conditions and business cycles. We include real growth rates of gross domestic product (GDP) and its lagged value (GDP1). We also include the number of months in the calendar year that the economy was in a recession (CONTRAC) and its lagged value (CONTRAC1) (13). We also include exchange listing of the firm to predict the decision to diversify. We create a dummy (MAJOREX) which takes the value 1 when the firm is listed on NYSE, NASDAQ, or AMEX and zero otherwise. Firms are more likely to diversify or refocus if they are listed on the major exchanges. Listing on major exchanges facilitates firms’ acquisition and divestiture by generating greater visibility and reducing information asymmetries (making it easier to raise external financing) through greater analyst coverage. However, firms listed on major exchanges are also likely to have greater liquidity. As firms with higher liquidity might be valued higher this might also affect relative firm value. We create a dummy variable (SNP) which takes the value 1 if the firm belongs to the S&P industrial index or the S&P transportation index, and zero otherwise. This dummy variable (SNP) controls for liquidity as firms belonging to the S&P index have higher liquidity. As liquidity impacts both relative firm value and the decision to diversify, we include this SNP variable in both equations 1 and 2. Finally, we also use whether or not the firm is a foreign firm as an instrument. We create a dummy (FOREIGN) which takes the value 1 when the firm is incorporated abroad and zero otherwise. Foreign firms might list in the US prior to major financing or as part of acquisition/corporate restructuring strategy. Foreign firms are therefore more likely to engage in both diversification and refocusing activities. Though being foreign may predict the probability of diversifying and refocusing, it does not affect relative firm value. We also control for average firm characteristics by including the historical average value of log of total assets, EBIT/Sales and CAPX /Sales. The third method to control for endogeneity is to control for the self-selection of firms that diversify using Heckman’s (1979) two-stage procedure. We estimate expected firm value conditional on the firm being diversified as E (Vit / Dit = 1) = δ0 + δ1Xit + δ2 +E (eit / Dit = 1). Assuming that the errors in equations (1) and (2), eit and µit, have a bivariate normal distribution with mean zero, standard deviation σe and 1 and with correlation ρ, we have E (e it / D it = ρσ e λ1 (βZ it ) where λ1 ( βZit ) =. Ø (βZ. it. ). φ (βZit ). , Ø (.) and φ (.) are respectively the. density and cumulative distribution functions of the standard normal. Similarly, we estimate the expected firm value conditional on the firm being focused as E (Vit / D it = 0) = δ 0 + δ1 Xit + E (eit / Dit = 0). (13) We thank Scott Mayfield for the suggestion of using merger waves, and the editor, Rene Stulz, for the suggestion of using business cycles to instrument for time trends. The data on merger volume and number is from Securities Data Corporation and data on GDP growth rates and business cycles is from NBER..
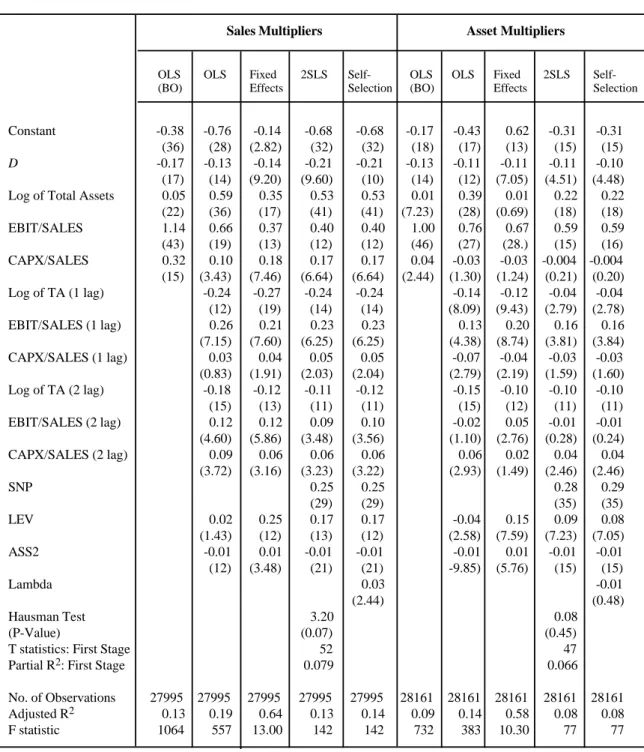
(15) 12. In this case, E (e it / D it ) = ρσ e λ 2 (βZ it ) where λ 2 (βZ it ) =. − Ø (βΖ it ) . 1 − φ (βZ it ). The difference in the value of single-segment and diversified firms, is given by E (Vit / D it = 1) − E (Vit / D it = 0) = δ 2 + ρσ e. Ø (βZ it ). φ (βΖ it )). .. (3). The right-hand side of the equation (3) is what is estimated by the OLS coefficient of Dit in equation (1). This estimated discount, using OLS, will therefore be biased downward if ρ, the correlation of the error terms, is negative, as hypothesized for diversifying firms. This estimated discount will be biased upward if ρ is positive, as hypothesized for refocusing firms. In line with the Heckman two-step procedure, we first estimate equation (2) using a probit model to get consistent estimates of β denoted by β̂ . These are then used to get estimates of λ1 and λ2, the correction for self-selection. In the second step, we estimate δ by estimating ^. ^. Vit = δ 0 + δ1 + X2 Dit + δ λ + [λ1 + ( β Zit ) * Dit + λ 2 (β Zit ) * (1 − D)] + ηit. (4). = δ 0 + δ1 Xit + δ 2 Dit + δ 2 Dit + δ λ λ + ηit where δλ = ρσe. The sign of δλ in the above regression is determined by the sign of ρ, the correlation between the error terms in equations (1) and (2). We separately examine diversifying and refocusing firms and control for the endogeneity of the diversification/ refocusing decision (14).. Diversifying firms We select a sample of all single-segment firms and all diversifying firms. Diversifying firms included in the sample are those that diversify once from single to multiple segments, those that diversify once from multiple to multiple segments and those that diversify multiple times (15). In this sample, we examine whether or not there is any loss of value associated with operating in multi-segments. We first estimate the model by ordinary least squares. Columns 2 and 7 in Table V report the results of the estimation of the BO (95) model in this sample. The estimated multi-segment discount is –0.13 (–0.11) using sales (asset) multipliers. The estimated discount in this sample of single-segment firms and diversifying firms is similar to the discount reported for the entire sample in Table I. Columns 3 and 8 report the OLS results for the extended model. The discount using sales (asset) multiples is 0-0.11 (–0.09) and is significant at the 1% (1%) level. (14) Given our lack of understanding of the full dynamics of diversification and refocusing by firms, we condition the sample based on whether firms choose to diversify or to refocus rather than pool all observations in one sample. (15) To ensure that the sample of firms stays the same across all methods, firms with only one year of data have been removed. These firms would not have been included in the fixed-effects estimation. Further, outliers have also been excluded..
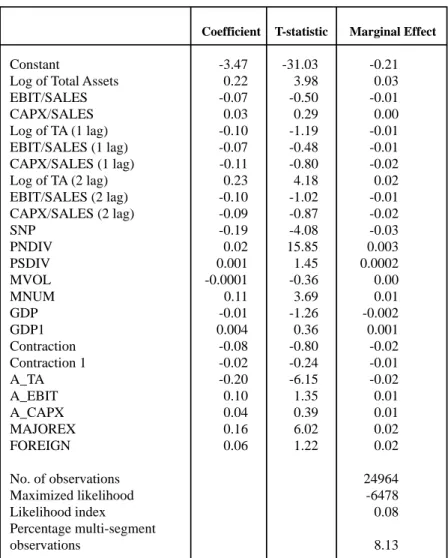
(16) 13. Fixed-effect estimation As discussed in the previous section, we introduce fixed firm effects to control for unobservable firm characteristics and year effects to control for time effects which affect the diversification decision. The results of this estimation are reported in Columns 4 and 9 of Table V. The introduction of two-way fixed effects reduces the estimated discount to 6% (4%) significant at the 1% (5%) level with sales (asset) multipliers. The introduction of firm fixed effects reduces the inter-firm variability in the data and might increase the noise-to-signal ratio in the estimation. However, the signs and significance of the coefficients on all other variables in the estimation, with the exception of leverage and square of assets, remain practically identical to the OLS estimation. The only coefficient that significantly changes in the regression is the coefficient on D. This result supports the view that diversification appears to be correlated with unobserved firm characteristics. Estimating the probability to diversify: Probit Estimation In this section, we discuss the estimation of the probability of diversifying. The results of this estimation will be used both in the two-stage least squares estimation and in the Heckman self-selection model. Firm specific characteristics influence a firm’s decision to diversify. Firms with low profitability in their current operations may diversify into other segments in search of more lucrative opportunities. To control for current and past profitability, we include EBIT/SALES and its lagged values. Firms with a high level of investment in current operations are less likely to diversify. We therefore include CAPX/SALES and its lagged values. R&D/SALES can also be used to control for firm level growth opportunities and section 5.5 reports the results including this variable in the model. We also control for firm size by including log of total assets and its lagged values. We also include historical average values of log of total assets, EBIT/Sales and CAPX /Sales to control further for firm characteristics. As discussed in Section 4, we identify four instruments which predict the decision to diversify while leaving firm value unaffected. The first instrument is the attractiveness of the industry to conglomerates and is proxied by PNDIV (the fraction of all firms in the industry which are conglomerates) and PSDIV (fraction of sales by other firms in the industry accounted for by conglomerates). The second instrument captures time trends which might influence the decision to diversify. These are the number of merger/acquisition announcements in a given year (MNUM) and their annual value in billions of US $ (MVOL). We also include real growth rates of gross domestic product (GDP), its lagged value (GDP1), the number of contractionary months in the year (CONTRAC) and its lagged value (CONTRAC1). The third instrument is the exchange listing of the firm. Firms listed on major exchanges (MAJOREX) are more likely to engage in acquisition/divestiture programs. We control for the effect of liquidity by including SNP (a dummy variable equal to 1 if the firm is on the S&P industrial index and zero otherwise). The fourth instrument is FOREIGN, which indicates whether the firm is foreign or not. Foreign firms are more likely to engage in diversification. The maximum likelihood estimates of the probit coefficients are reported in Table VI. As probit coefficients are difficult to interpret, the table also reports the marginal effects of the change in each explanatory variable calculated at its sample mean. Small firms (low.
(17) 14. average historical size) with an increase in assets in recent years are more likely to diversify. There is weak evidence that firms with low profitability (EBIT/SALES) and low investment (CAPX/Sales) in recent past years but with high average historical profitability and investment are more likely to diversify. The coefficients are not significant however. Firm level characteristics are not highly significant in explaining the diversification decision. Industry and time instruments significantly explain the probability of diversifying. The coefficient of PNDIV is positive and significant. The coefficient of PSDIV is positive though not significant at conventional levels. An increase in the fraction of conglomerates in the industry, by 4% from its mean of 48.6%, increases the probability of operating in multiple segments by 1%. An increase in merger/acquisition activity leads to an increase in the probability of operating in multiple segments, i.e. increases the probability of diversifying. An increase in the number of deals announced (MNUM) by 0.7 thousands, from its mean of 2.03 thousand, leads to an increase of 1% in the probability of multi-segment operations. Macroeconomic conditions, however, do not significantly influence the probability of diversifying, with the coefficients of both GDP (GDP1) and CONTRAC (CONTRAC1) being insignificant. Firms listed on major exchanges are significantly more likely to diversify. The coefficient of MAJOREX is positive and significant as hypothesized. The coefficient of SNP is negative and significant. Firms in the S&P industrial or transportation index are less likely to diversify. Foreign firms are also more likely to diversify, though this effect is not significant.. 2SLS estimation We use the estimated probability of operating in multiple segments from the probit models reported in Table VI as a generated instrument for the diversification status. In the first stage, we use all the exogenous variables along with the probability of diversifying as explanatory variables in the decision to diversify, i.e. D (16). In the second stage we use the fitted value from the first stage as an instrument for D. The results are reported in Columns 5 and 10 of Table V. We find that the coefficient of the instrumented D is 0.30 (0.19) with sales (asset) multipliers and is significant at the 1% (1%) level. To test for the existence of endogeneity, we use Hausman’s test. The Hausman test is based on the difference between the OLS estimator (which is consistent and efficient under the null hypothesis of no endogeneity and inconsistent under the alternative) and the IV estimator (which is consistent under both but inefficient under the null). We can reject the null of no endogeneity at the 1% level for both sales and asset mutlipliers. Bound, Jaeger and Baker (1995) show that when instruments are weakly correlated with the endogenous explanatory variable, then even a small correlation between the instruments and the error can seriously bias estimates and lead to a large inconsistency in the IV estimates. They suggest reporting partial R2 and F statistics on the instruments in the first stage regression as useful guides. We find that the probability of diversifying is highly significant, with a t statistic. (16) This involves regressing D on the estimated probability of diversification as well as on all the exogenous variables in the excess value equation. We also estimated an alternative model, in which we included all independent variables including the instruments in the probit equation in lieu of the predicted probability of diversifying. This alternative model does not impose the non-linear functional form of the probit. We found that the alternate specification was always dominated by the probit specification and therefore report the probit results..
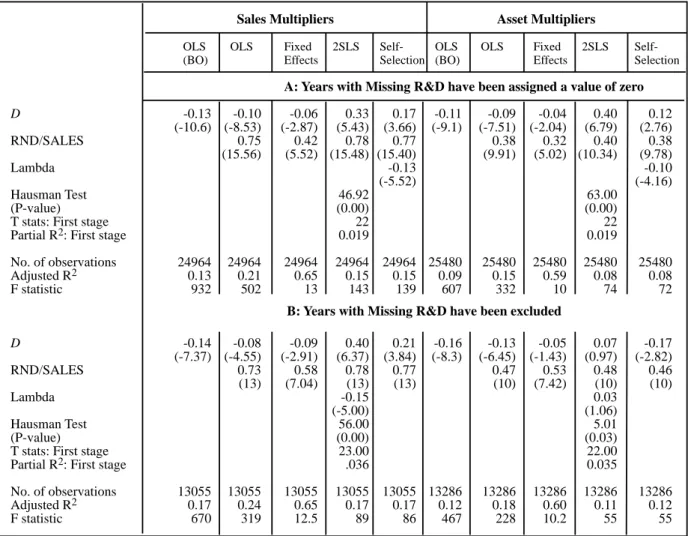
(18) 15. of 22 (referred to as T stats: first stage), and a partial R2 of 0.02 (17). This alleviates the concern that our estimation suffers from biases introduced on account of having weak instruments. Self-Selection Model Lastly, we report the results of a two-stage estimation of the endogenous self-selection model. The estimated parameters of the OLS estimation of equation (4) are reported in Columns 6 and 11 of Table V. The estimated coefficient of D is 0.18 when using sales multipliers and is significant at the 1% level. The estimated coefficient is 0.01 when using asset multipliers and is not significant. The coefficient of λ, the self-selection parameter, is –0.14 (–0.04) and is significant at the 1% (10%) level when using sales (asset) multipliers. The estimated coefficient of λ is negative as expected and significant. This indicates the prevalence of self-selection and suggests that characteristics which make firms choose to diversify are negatively correlated with firm value. Firms with a higher probability of diversifying also tend to be discounted. In summary, there is significant evidence of endogeneity with both 2SLS and selfselection models. The multi-segment discount turns positive under both methods and in three of the four cases it is significant at the 1% level. Robustness Checks To test the robustness of our results we ran various specifications of our model. We briefly report the results of some of these specifications. We include RND/SALES to control for growth opportunities within the firm. As firms are required to report research and development expenses only when they exceed 1% of sales, including RND/SALES gives too many missing observations and generates concerns about sample selection. We consequently estimate two models. In the first model, we treat all missing observations as having a value of zero. Results for this are reported in the first panel of Table VII. In the second model, we exclude all missing values of RND/SALES. The results for this are reported in the second panel of Table VII. As RND/SALES also affects relative firm value, we include it in both the probit and the value equation. The results for both models are similar. We find that higher levels of RND/SALES significantly increase relative firm value. We also found that firms with higher RND/SALES are significantly less likely to diversify (results not reported), consistent with results reported in Hyland (1999). When missing values of RND/SALES are included as zeros, controlling for RND/SALES does not materially affect the results on the multi-segment discount. There is significant evidence of endogeneity, with both λ and the Hausman test being significant. When we use two-way fixed effects the discount drops in comparison to its OLS estimate and changes to a significant premium with 2SLS and self-selection models. However, when missing values of RND/SALES are excluded, we find mixed evidence in support of the endogeneity of the diversification decision. The evidence with sales multipliers is like before.. (17) The R2 of the first-stage regression without including the generated probability of diversification was 0.035 (0.028) and increases to 0.053 (0.04) when the generated probabilities are included in the regression with sales (asset) multipliers. The partial R2 is the increase in R2 by including the probability to diversify and is 0.022..
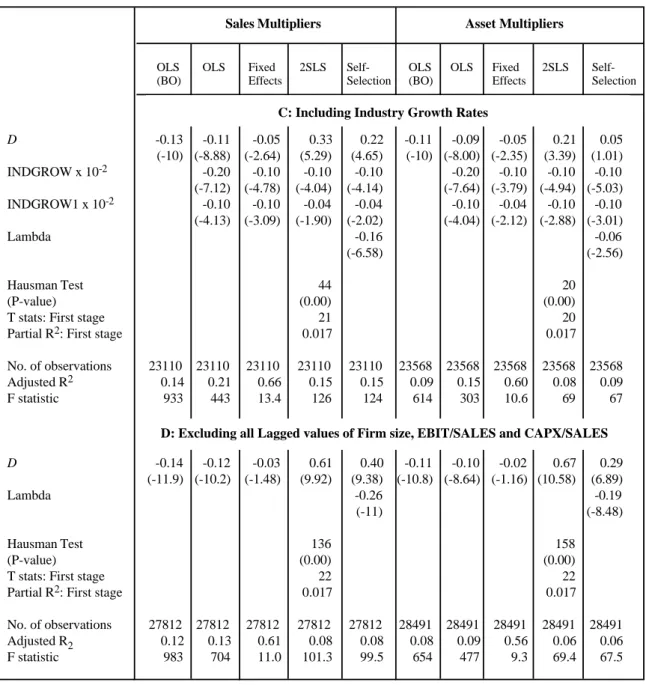
(19) 16. However, with asset multipliers, the coefficient of λ is not significant while the estimated discount of 17% is significant. Excluding missing values of RND/SALES substantially shrinks the sample. This significant discount with asset multipliers may be due to the sample selection bias. The estimated discount in the same sample but without including the RND/SALES variable is a significant 16%, with multiple-segment years accounting for only 4.8% of all observations. This is much lower in comparison to 6.7% of multiple-segment years in the sample with sales multipliers (with missing RND excluded). It is also much lower in comparison to the 6.7% (8%) in the full sample with asset (sales) multipliers. This suggests that sample selection issues might be important in this asset-multiplier sample. The last two panels of Table VII report the results including industry growth and without including the lagged values of firm size, profitability and investment. As can be seen, there continues to be significant evidence of endogeneity. The discount also drops. It is small when fixed effects are introduced and changes to a premium with 2SLS and self-selection models. Overall, there is significant evidence of endogeneity and a negative correlation between a firm’s decision to diversify and its value. There is little evidence that multisegment years of diversifying firms are discounted, and sometimes multi-segment years are associated with a significant premium. The inclusion/exclusion of variables leaves our initial results unchanged, indicating strong evidence of the endogeneity of the diversification decision. The sign, magnitude and significance of the estimated discount/premium remain intact. This supports the view that for firms that diversify, diversification is not a valuedestroying decision and could possibly be a value-enhancing decision.. Refocusing firms Evidence on the value destruction associated with multiple segment firms also comes from observed gains achieved by refocusing firms. Comment and Jarrell (1995), John and Ofek (1995) and Berger and Ofek (1996) all document gains achieved by refocusing firms. In this section, we follow the same empirical strategy detailed in the previous section and examine the firm’s decision to refocus in a sample of single-segment firms and all refocusing firms. In this sample, the estimated discount in the BO (95) model is 17% (13%) using sales (asset) multipliers. This discount drops to 13% (11%) with sales (asset) multipliers in the extended BO (95) model as seen in columns 3 and 8 of Table VIII. Columns 4 and 9 of Table VIII report the results of the two-way fixed effects. The estimated discount increases marginally from 13% to 14% with sales multiples. It is unchanged at 11% when excess values are estimated using asset multipliers. We find that we can better explain the decision to refocus in comparison to the decision to diversify. The likelihood ratio index (as seen in Table IX) in the estimation of the probability to refocus is 0.21, compared with 0.079 for the probability to diversify. Firms with high historical average investments (average CAPX /Sales) and low recent investments are less likely to operate in multiple segments, i.e. more likely to refocus. Firms with high historical average profitability and high recent profitability are less likely to operate in multiple segments or more likely to refocus. Firms with high historical average value of assets are more likely to operate in multiple segments. In summary, profitability, investments, and firm size all significantly explain the decision to refocus, which is in contrast to their inability to significantly explain the decision to diversify..
(20) 17. Besides, firm characteristics, industry characteristics and time trends significantly determine the probability to refocus. The coefficient of both PNDIV and PSDIV are significantly positive. An increase in the number of conglomerates, as well as an increase in the share of sales accounted for by conglomerates, leads to an increase in the probability of operating in multiple segments, i.e. firms in industries which are attractive to conglomerates are less likely to refocus. Increase in merger activity, as captured by an increase in the number of mergers/acquisitions, leads to a decrease in the probability of operating in multiple segments, i.e. an increase in the probability of refocusing. This is in contrast to the diversification results, where an increase in merger activity increased the probability of operating in multiple segments. Favorable merger/acquisition conditions prompt firms both to diversify and to refocus. Macroeconomic conditions significantly explain the refocusing decision. This is in contrast to the diversification decision, where the coefficient of GDP growth and CONTRAC were not significant. Firms are more likely to operate in multiple segments when in a recession. There is also evidence that high GDP growth rates increase the probability of operating in multiple segments. This suggests that extreme macroeconomic conditions reduce the probability of refocusing. This is only partially consistent with the evidence in Maksimovic and Philips (1999), who document that asset reallocations are highest in expansions. Aside from the significance of individual variables, a better fit of the probit model is also reflected in the significance of the fitted probabilities in the first stage of the two-stage least squares estimation. The probability of refocusing is highly significant, with a t-statistic of 52 and a partial R2 of 0.079 (18). The estimated discount increases from 13% to 21% with sales multipliers. The Hausman test rejects the null of no endogeneity at the 7% level. The results with asset multipliers are much weaker. There is no evidence of endogeneity and the estimated discount drops from 8% to 7%, though it is still significant. Similar results are obtained when the self-selection model is estimated. The coefficient of λ, the selectivity correction, is positive as expected and is significant at the 5% level when using sales multipliers. The estimated discount increases to 21%. However, the coefficient is not significant when we use asset multipliers, and the estimated discount stays roughly the same at 10%. In line with the results of the two-stage least squares, there exists evidence of self-selection only when sales multipliers are used. With sales multipliers there is evidence that, controlling for the endogeneity of the refocusing decision, there is an increase in the estimated discount associated with multi-segment operations. Also, the coefficient of the estimated selectivity bias with sales multipliers is positive as hypothesized, i.e. characteristics which make firms choose to refocus are positively correlated with excess value. This is in contrast to the results reported for diversifying firms, where it was estimated with a significant negative coefficient. Robustness checks We estimate the variants of the basic model to check the robustness of our results, analogously to what we did in the previous section with the diversification decision. The estimated results, including the RND/SALES variable, where missing values of RND have (18) Though this high significance may merely be a manifestation of a good instrument, it has to be interpreted carefully. If the instrument is very highly correlated with the endogenous variable, it may also be correlated with the error, making it an unfit instrument to control for endogeneity. The relatively low R2 in the firststage regression suggests this is not a problem in this case..
(21) 18. been replaced with zero (Panel A), including only non-missing values of RND/SALES (Panel B), including industry growth rates (Panel C), and excluding lagged values of the explanatory variables (Panel D), appear in Table X. Similarly to the analysis for the diversifying sample, the results do not change significantly. Our estimated discount for multiple-segment years of refocusing firms is robust to the inclusion of these variables. As reported in Table VIII, there is strong (weak) evidence of endogeneity using sales (asset) multipliers.. Conclusion Firms choose the extent of their operations and decide whether to operate in a single industry, diversify into multiple industries or refocus their operations. A firm’s choice to diversify is likely to be a response to exogenous changes in the firm’s environment that also affect firm value. In this case, the observed correlation between diversification and firm value is not causal. There are systematic patterns in diversification strategies and relative value of firms. Firms are more likely to move away from industries with relatively low growth and high exit rates. Firms that choose to diversify have higher value than exiting firms in their industry and lower value than other firms in the industry that remain focused. We model the effect this endogeneity has on the observed correlation between diversification and firm value. We use panel data and instrumental variables to control for the exogenous characteristics that predict the decision to diversify. Once these observed firm characteristics and firm fixed effects are controlled for, the evidence in favor of the assertion that diversification destroys value is substantially weaker. When we jointly estimate the decision of a firm to diversify and firm value, the diversification discount is more likely to be a premium. The evidence in this paper suggests that diversification is a value-enhancing strategy for those firms that actually pursue it. We follow a similar strategy to evaluate the correlation between firm value and the decision to refocus. The results are remarkably similar for this case. Firms that refocus their operations would have suffered a significant decrease in value if they had remained diversified. This evidence suggests that the observed correlation between diversification status and firm value need not be causal but rather the outcome of actions by profitmaximizing firms reacting to shocks in their environments. Our results highlight the value of constructing more complete models of the interaction between firm strategies and firm value. The development of a dynamic model that will jointly allow for both diversification and focus by firms in response to changes in their economic environment and that can also be structurally estimated with the available data seems to us to be the long-run objective. Short of a full dynamic structural model, the evidence in this paper highlights the importance of identifying large exogenous shocks to firms to adequately evaluate the relationship between firm choices and equilibrium outcomes..
(22) 19. References Aron, Debra, 1988, “Ability, Moral Hazard, Firm Size and Diversification”, The RAND Journal of Economics, Vol. 19, pp. 72-87. Aron, Debra, 1989, “Corporate Spin-offs in An Agency Framework”, Northwestern University, Working Paper. Berger, Philip G. and Eli Ofek, 1995, “Diversification’s effect on firm value”, Journal of Financial Economics, Vol. 37, 39-65. Berger, Philip G. and Eli Ofek, 1996, “Bustup takeovers of value destroying diversified firms”, Journal of Finance, Vol. LI, No. 4, 1175-1200. Bodnar, Gordon M., Charles Tang and Joseph Weintrop, 1998, “Both sides of Corporate Diversification: The value impacts of geographic and industrial diversification”, Working paper. Bound, John, David A. Jaeger and Regina M. Baker, 1995, “Problems with Instrumental Variables Estimation when the Correlation between the Instruments and the Endogenous Explanatory Variable is Weak”, Journal of the American Statistical Association, Vol. 90, No. 430. Chandler, R.B., The Visible Hand, Belknap Press Cambridge MA. Chevalier, Judith A., “Why do Firms Undertake Diversifying Mergers? An Analysis of the Investment Policies of Merging Firms”, Working Paper, University of Chicago. Comment, Robert and Gregg A. Jarrel, 1995, “Corporate focus and stock returns”, Journal of Financial Economics, Vol. 37, 67-87. Denis, David J., Diane Denis and Atulya Sarin, 1997, “Agency Problems, Equity Ownership, and Corporate Diversification”, Journal of Finance, Vol. 52, pp. 135-160. Dixit, A. and R. Pindyck, 1994, Investment under Uncertainty, Princeton University Press. Fauver, Larry, Joel Houston and Andy Narnajo, 1998, “Capital market development, legal systems and the value of corporate diversification: A cross country analysis”, Working paper, University of Florida. Fluck, Suzanna and Anthony W. Lynch, 1999, “Why do Firms Merge and Divest? A theory of financial synergies”, Journal of Business, Vol. 72, No. 3, pp. 319-346. Graham, John R., Michael L. Lemmon and Jack Wolf, 1999, “Does Corporate Diversification Destroy Value?”, Working Paper, University of Duke. Hadlock, Charles, Michael Ryngaert and Shawn Thomas, 1998, “Corporate Structure and Equity Offerings: Are there benefits to diversification?”, Working paper, University of Florida..
(23) 20. Harris, M., C.H. Kriebel and R. Raviv, 1982, “Asymmetric information, incentives and intrafirm resource allocation”, Management Science, Vol. 28, No. 6, 604-620. Hausman, J., 1978, “Specification Tests in Econometrics”, Econometrica, Vol. 46, 1251-1271. Heckman, J., 1979, “Sample selection bias as specification error”, Econometrica, Vol. 47, 153-161. Hyland, David. C., “Why Firms Diversify: An Empirical Examination”, Working Paper, University of Texas at Arlington. Jensen, M.C., 1986, “Agency costs of free cash flow, corporate finance, and takeovers”, American Economic Review, 76, pp. 323-329. Jensen, M.C., 1988, “Takeovers, their causes and consequences”, Journal of Economic Perspectives, 2, pp. 21-48. John, Kose and Eli Ofek, 1995, “Asset Sales and Increase in Focus”, Journal of Financial Economics, Vol. 37, 105-126. Khanna, Tarum and Krishna Palepu, 1999, “Is Group Affiliation Profitable in Emerging Markets? An Analysis of Diversified Indian Business Groups”, Forthcoming Journal of Finance. Lamont, O., 1997, “Cash flow and Investment: Evidence from Internal Capital Markets”, Journal of Finance, 52, 83-110. Lamont, O. and Chris Polk, 1999, “The Diversification Discount: Cash Flows vs. Returns”, Working Paper, University of Chicago. Lang, Larry and Rene Stulz, 1994, “Tobin’s q, corporate diversification and firm performance”, Journal of Political Economy, Vol. 102, No. 6, 1248-1280. Lewellen, Wilbur G., 1971, “A Pure Financial Rationale for the Conglomerate Merger”, Journal of Finance, Vol. 26, 521-537. Lins, Karl and Henri Servaes, 1999, “International evidence on the value of corporate diversification”, Forthcoming Journal of Finance, 1999. Lins, Karl and Henri Servaes, 1998, “Is corporate diversification beneficial in emerging markets”, Working Paper. Matsusaka, John G., 1995, “Match-Seeking: A Dynamic Theory of Corporate Diversification”, University of Southern California, mimeo. Matsusaka, John G. and Vikram Nanda, 1994, “A theory of the diversified firm, refocusing, and divestiture”, University of Southern California, mimeo. Maksimovic, Vojislav and Gordon Philips, 1998, “Do Conglomerate Firms Allocate Resources Inefficiently?”, Working paper, University of Maryland..
(24) 21. Maksimovic, Vojislav and Gordon Philips, 1999, “The Market for Corporate Assets: Who engages in Mergers and Assets Sales and are there Efficiency Gains?”, Working paper, University of Maryland. Montgomery, C.A. and B. Wernerfelt, 1988, “Diversification, Ricardian rents, and Tobin’s q”, Rand Journal of Economics, Vol. 19, No. 4, 623-632. Meyer, M., P. Milgrom and J. Roberts, 1992, “Organizational prospects, influence costs and ownership changes”, Journal of Economics and Management Strategy 1, 9-35. Meyerson, R.B., 1982, “Optimal Coordination mechanisms in Generalized Principal Agent Problem”, Journal of Mathematical Economics 10, 67-81. Myers, S.C., 1977, “The Determinants of Corporate Borrowing”, Journal of Financial Economics 6, 146-175. Perold, Andre. F., 1999, “Capital Allocation in Financial Firms”, Working Paper, Harvard Business School. Rajan, Raghuram, Henri Servaes, and Luigi Zingales, 1998, “The cost of diversity, the diversification discount and inefficient investment”, NBER Working paper No. 6368. Rotemberg, Julio J. and Garth Saloner, 1994, “Benefits of Narrow Business Strategies”, American Economic Review, Vol. 84, pp. 1330-1349. Scharfstein, David and Jeremy Stein, 1996, “The Dark Side of Internal Capital Markets: Divisional Rent Seeking and Inefficient Investment”, National Bureau of Economic Research, Working Paper No. 97-4. Scharfstein, David S., 1998, “The Dark Side of Internal Capital Markets II: Evidence from Diversified Conglomerates”, NBER Working paper No. 6352. Schoar, Antionette S., 1999, “Effects of Corporate Diversification on Productivity”, Working Paper, University of Chicago. Servaes, Henri, 1996, “The value of Diversification during the Conglomerate Merger Wave”, Journal of Finance, Vol. LI, No. 4, 1201-1225. Stein, Jeremy, 1997, “Internal Capital Markets and the Competition for Corporate Resources”, Journal of Finance, Vol. LII, No. 1, 111-133. Stulz, Rene M., 1990, “Managerial discretion and optimal financial policies”, Journal of Financial Economics, Vol. 26, 3-27. Wernerfelt, B. and C.A. Montgomery, 1988, “Tobin’s q and the Importance of Focus in Firm Performance”, American Economic Review, Vol. 78., No. 1, 246-250. Weston, J.F., 1970, “The nature and significance of Conglomerate Firms”, St. John Law Review 44, 66-80. Whited, Toni M., 1999, “Is it Inefficient Investment that Causes the Diversification Discount?”, Working Paper, University of Maryland..
Figure
+7
Related documents
