Using Effective Network Views to Promote
Distributed Application Performance
Gary Shao∗ and Fran Berman†Department of Computer Science and Engineering, 0114 University of California, San Diego
San Diego, CA 92093-0114
Rich Wolski†
Department of Computer Science University of Tennessee
107 Ayres Hall Knoxville, TN 37996-1301
Abstract In this paper, we show that distributed
parallel application performance in clusters of work-stations benefits from knowledge about network topology in cases where LAN resources can become
potential performance bottlenecks. These
perfor-mance bottlenecks often appear in common net-working technologies that employ highly shared
re-sources, such as ethernets and token-rings. A
method to discover network configuration as it re-lates to application performance, called Effective Network Views (ENV), is presented, and exper-imental results with an example application are given to show the value of including ENV infor-mation in the scheduling process when good perfor-mance is required.
Keywords: effective network views, topology
dis-covery, application-level scheduling
1
Introduction
All programs achieve performance by exploit-ing the architectural characteristics of the plat-forms on which they will run. This is especially true of distributed parallel programs, which are typically developed to leverage the spe-cial performance characteristics of distributed processors and their associated interconnection networks. Parallel applications targeted to
∗Supported by NASA GSRP grant #NGTS-50131. †Supported in part by NSF grant #ASC-9701333,
DARPA/ITO contract #N66001-97-C-8531, NPACI award #ASC9619020, DoD Modernisation contract #9720733-00.
MPPs with specialized communication struc-tures have often depended on having accurate static information about the underlying com-munication architecture of these platforms to achieve good performance. In the clusters of workstations environment, information about the configuration and deliverable performance of the interconnection network is seldom accu-rate or constant. The availability, capability, and arrangement of network resources that can be effectively observed by an application varies with the changing needs and demands of many different users and administrators.
Network capacities are most often charac-terized by simple measurable values, such as bandwidth and latency. Bandwidth is a mea-sure of the quantity of data that can be carried by a network in a fixed period of time, while
la-tencyis a measure of the time needed for a
sin-gle data unit to traverse a path in the network. These capacities can often easily be obtained by measurement, even at an ordinary user level [11]. High performance application schedulers often use these measures to promote applica-tion performance in distributed and clustered environments [3]. Most useful to application schedulers areeffective measures of bandwidth and latency, i.e. the network performance in terms of bandwidth and latency that is actu-ally delivered to an application [4].
Networks can also be described by their
topology, a representation of interconnection
relationships between resources. Application schedulers that include knowledge of the
net-work topology in their decisions can avoid mak-ing some poor schedulmak-ing choices, such as allo-cating frequently communiallo-cating tasks to pro-cessors linked by slow or heavily loaded net-works. Note that it is not the physical topol-ogy that the application scheduler requires, but rather the topology corresponding to the per-formance that the applicationexperiences(i.e. observes). We term the network organization that is consistent with observable network be-havior the effective topologyof the network for the application.
In this paper, we show that beneficial effec-tive topology information about networks can be derived from user-level observations and mea-surements; and that this new information can be used effectively by schedulers to improve
ap-plication performance. Section2describes how
user-level observations of network performance can be used to create an effective profile of net-work configuration, Section3illustrates results of this network profiling procedure on several test LAN systems, and Section 4 shows how scheduling techniques can use the network pro-file data to detect potential resource contention problems and apply appropriate scheduling so-lutions to solve them. Section 5 gives a short list of related work, and we summarize this pa-per in Section6.
2
Creating Effective Network
Views
Network configuration can play an important role in the performance of parallel applications running on clusters of workstations. In some environments, relevant information about the interconnection configuration in real networks may be hard to obtain. Sometimes, only the person who installs or services the equipment really knows or cares about exactly how things are hooked up. Common network tools, like
traceroute [8] and pathchar [7], are able to
re-port network routing down to the switch level and produce estimates of router congestion, but once past the switch they are unable to distinguish whether two hosts are on a
com-mon subnet sharing a single hub, or on sepa-rate subnets. Moreover, even if complete maps of physical connections were available for all components in a network,this topological infor-mation is only useful for scheduling if its effects
on application performance can be quantified.
If the application’s performance is to be op-timized, what a scheduler needs is a represen-tation of the network as the application will
see it, i.e. in terms of the quantifiable
perfor-mance that it is likely to deliver to the user’s application. The physical network is not as im-portant to the performance-oriented applica-tion scheduler as the effective network; config-urations of network resources should be repre-sented in terms of their effective properties. In this paper, we describe a prototype mechanism for determining what we call effective network
views(ENV) which provide a representation of
the logical network as perceived by the applica-tion. ENV information is created by grouping together network components that have signif-icant interaction and similarities in response to events on the network. The grouping is ef-fective rather than physical because only the measurable performance responses that are ob-served determine the grouping results. Using an ENV, an application scheduler can place in the same group those hosts that will experience similar performance limitations in response to application-driven loading of shared network resources.
We have developed a procedure for dis-covering ENV information using a collec-tion of straightforward network performance tests. Because our ultimate goal is to develop scheduling methods and approaches that can be used by any ordinary user, we have chosen to develop techniques which do not require the presence of special system tools or access priv-ileges. We use this approach to make our ap-proach widely portable across a range of clus-tered and meta-computing environments.
The procedure for creating ENV groupings involves a series of steps designed to identify clusters of machines that will likely have sig-nificant sharing of a network resource, such as being on the same physical ethernet subnet.
FutureGateway Switch PCLGateway Switch ApeNet2 Hub PCL100Net Hub Circus10Net
Hub kingkong kongo
tandem azulejo soleil mystere
CircusNet Hub
Figure 1: Physical Topology. Shows intercon-nections of resources on the network, but does not include performance data.
We detect the sharing by looking for similar re-sponses to network events from machines dur-ing an initial test phase.
In our procedure, almost all testing activ-ity originates from a single test machine. The resulting ENV data is relative to this test ma-chine. After roughly filtering a set of machines by straightforward criteria like domain name and subnet addressing boundaries, we apply our first active test. The test machine conducts a bandwidth test between itself and each of the other machines being tested, keeping track of the results. Using the results of the first band-width test, machines with similar bandband-width values are clustered together.
The second active test chooses pairs of ma-chines within the same candidate cluster, and runs simultaneous bandwidth tests between them and the test machine. If there is sig-nificant interference1
in the 2-host bandwidth test compared to the 1-host bandwidth test, we leave the machines in the same cluster. If we do not detect significant interference, we separate the machines into different clusters. At the end of the clustering procedure, we will have deter-mined which machines can be considered ef-fectively sharing the same subnet, and we will
1currently defined as a 30% decline in measured
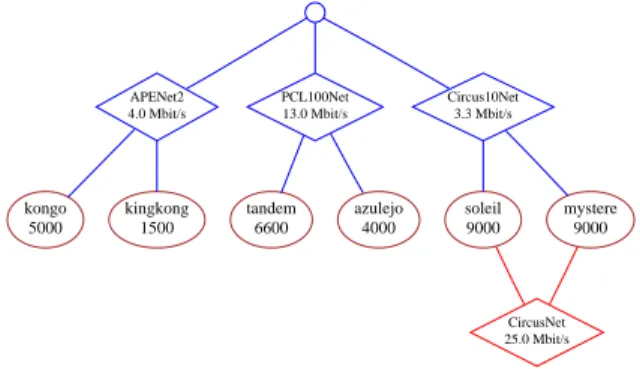
bandwidth APENet2 4.0 Mbit/s PCL100Net 13.0 Mbit/s Circus10Net 3.3 Mbit/s kongo 5000 kingkong 1500 tandem 6600 azulejo 4000 soleil 9000 mystere 9000 CircusNet 25.0 Mbit/s
Figure 2: Effective Topology. The figure shows effective configuration of resources, which in-cludes performance information. Values for network bandwidth are taken from ENV mea-surements, while values for machine speeds are based on benchmark data.
have annotated the topology information with estimates of the subnet performance relative to the test machine view.
Optionally, a third active test can be run between machines within each cluster to find private network resources that cause different communication behavior with machines inside and outside the cluster. Testing identifies dif-ferences between internal and external commu-nication bandwidth, and labels detected pri-vate networks with their observed performance values. Figure1shows the physical topology of a set of workstations located in the Computer Science and Engineering (CSE) Department at UCSD. Figure2shows a sample ENV graph of that same set of workstations that was gener-ated by the ENV tool. In the figure, the test machine was located at the San Diego Super-computer Center (SDSC) which is separated from the CSE Department by a campus-wide ATM network.
Our ENV representations differ from physi-cal mappings of network resources in one im-portant way: each view of a network reflects
the vantage point of a single process, i.e. the
one that ran the performance tests and col-lected the results. As an example, an initiat-ing machine whose connection to outside net-works is through a 10 Mbit/sec ethernet port could not accurately test the bandwidth of a
FutureGateway Switch PCLGateway Switch DangerNet Hub PCLNet Hub
mystere quidam soleil sojourner
TESTER
tandem roastbeast thing1
(a) Physical topology
PCLNet 6.7 Mbit/s PCLNet100 35.4 Mbit/s mystere 9000 quidam 9000 sojourner 5300 soleil 9000 tandem 6600 roastbeast 5300 thing1 6000
(b) Effective network view
Figure 3: Effective network view of PCL re-sources from a machine within the PCL net-work.
100 Mbit/sec ethernet segment, since it would only see its own 10 Mbit/sec limit on network speed during tests. This notion of perspective is consistent with the application’s view: if the application is initiated from a host with the 10 Mbit/sec network speed for communication, it would experience an effective rate of at most 10 Mbit/sec to all other computational resources, no matter how fast the other network links might be. We also concern ourselves here only with bandwidth measurements, believing that latency issues are much less important in the LAN scenarios discussed in this paper.
3
ENV Examples
In this section we give some examples of LAN networks, and the resulting ENV profiles that were generated for these networks by a pro-totype tool implementing the ENV discovery procedure.
The first example (Figure 3) shows a set
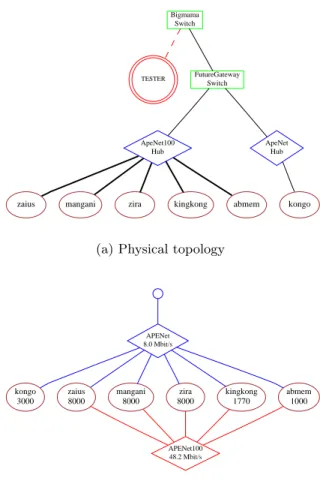
Bigmama Switch TESTER FutureGateway Switch ApeNet100 Hub ApeNet Hub
zaius mangani zira kingkong abmem kongo
(a) Physical topology
APENet 8.0 Mbit/s kongo 3000 zaius 8000 mangani 8000 zira 8000 kingkong 1770 abmem 1000 APENet100 48.2 Mbit/s
(b) Effective network view
Figure 4: Effective network view of APE lab resources from a machine outside the APE lab network.
of machines in the Parallel Computing Lab (PCL) at UCSD. The physical network in the lab is a mixture of 10 and 100 Mbit/sec ether-net subether-nets, all connected to a central switch. Figure 3 shows an ENV graph generated for these machines, using as a test machine a work-station located within the network on a 100 Mbit/sec ethernet link.
The second example (Figure 4) shows a set of machines in the instructional Advanced Pro-gramming Environment (APE) lab at UCSD. This lab also has a mixture of 10 and 100 Mbit/sec ethernet subnets, each going to a dif-ferent switch from the PCL machines shown above. Figure 4 shows an ENV graph gener-ated for these machines using as a test machine
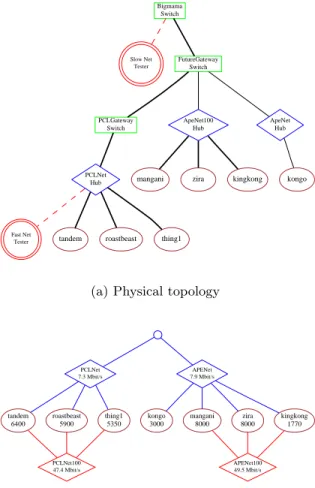
Bigmama Switch Slow Net Tester FutureGateway Switch PCLGateway Switch ApeNet100 Hub ApeNet Hub PCLNet
Hub mangani zira kingkong kongo
Fast Net
Tester tandem roastbeast thing1
(a) Physical topology
PCLNet 7.3 Mbit/s APENet 7.9 Mbit/s tandem 6400 roastbeast 5900 thing1 5350 PCLNet100 47.4 Mbit/s kongo 3000 mangani 8000 zira 8000 kingkong 1770 APENet100 49.5 Mbit/s
(b) Effective network view from machine on slow network APENet 7.0 Mbit/s PCLNet100 35.9 Mbit/s kongo 3000 mangani 8000 kingkong 1770 zira 8000 APENet100 50.2 Mbit/s roastbeast 5900 tandem 6400 thing1 5350
(c) Effective network view from machine on fast network
Figure 5: Resulting effective network view can depend on network speed and connectivity of test machine.
a workstation located outside the network be-ing tested. The test machine in this example was located at SDSC, and was connected to
Number of blocks 1600
Work block transfer size (bytes) 8 Output block transfer size (bytes) 5028 Slave exec. timea (usecs/block) 52400 Master exec. timea
(usecs/block) 3000
a
relative to a processor with speed = 1000
Table 1: Runtime parameters for Mandelbrot master/slave application.
UCSD through a series of 10 Mbit/sec ether-net and ATM links.
Figure 5 shows two ENV graphs generated for a set of machines from both the PCL and APE labs; one using the previously described external test machine at SDSC, and another using a machine located on a 100 Mbit/sec link within the PCL lab to perform the tests. These graphs help illustrate the difference between an effective view and a physical mapping. From the point of view of the testing machine in Fig-ure 5(b), communication with all hosts would be through slow ethernet hubs, leading to po-tential communication bottlenecks. But from the point of view of the testing machine in Figure 5(c), network resources are uncovered that can be reached through fast ethernet hubs, avoiding the same bottleneck problems.
4
Using ENV Results
Once network configuration data has been col-lected, we wish to use the information to gen-erate schedules which promote application per-formance. The network discovery process out-lined in the previous section produces a graph-ical representation of a network. This graph is useful for performing several valuable types of analysis. One approach is to use the graph for the problem of resource selection; deciding which hosts to use in a computation, and cal-culating the best placement of processes on se-lected hosts.
As an example, Figure 6 shows an ENV graph which has been annotated with values
PCL100Net 13.0 Mbit/s PCL10Net 4.3 Mbit/s APENet1 2.6 Mbit/s APENet2 4.0 Mbit/s tandem 6600 azulejo 4000 alicatado 4000 thing1 6000 picard 1000 abmem 1000 kongo 5000 kingkong 1500 joeyoung 1000
Figure 6: Effective network view for a set of workstations we want to schedule a mas-ter/slave application for.
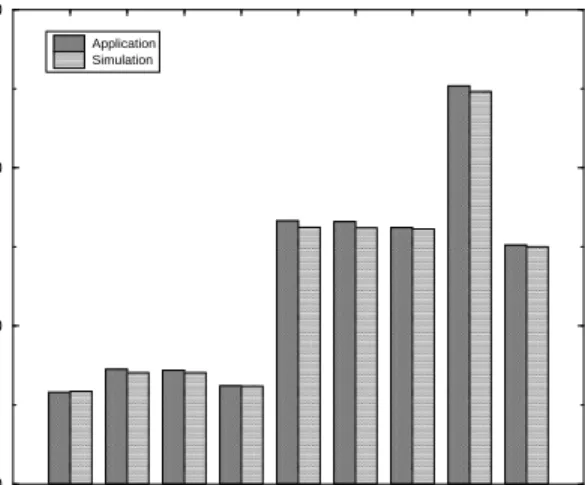
for subnet bandwidth (in Kbits/sec) and rel-ative processor speed (derived from applica-tion benchmarking). Onto this configuraapplica-tion we wish to schedule a master/slave Mandel-brot application that has known characteris-tics as shown in Table 1. This simple applica-tion starts off with the master process sending fixed-size work blocks to each slave in the sys-tem. Each slave receives work blocks, processes them in the order they are received, and sends fixed-size result blocks back to the master as soon as they are ready. When a result block reaches the master, a new work block is sent to the slave that generated the last result block. The process continues until all available work has been sent. Selection of which workstation to use as the master process has a significant impact on application performance. Figure 7
shows the effect on execution time of choosing each of the workstations in our example graph as the master machine, while using all other machines for slave computation.
A selection algorithm was run on the ENV graph to choose the processor on which to place the master process. The selection was made by identifying which processor would support the highest work throughput (based on processor speed and network bandwidth) from available slave processors, without exceeding either the local subnet capacities of the individual eth-ernet links, or the processing capacity of the candidate master processor.
Network throughput capacities N T P(s) for each ethernet subnet s were calculated using ENV values for subnet bandwidthBW(s), and a specified value for output blocksizeBsizewith
the relation:
N T P(s) =BW(s)/Bsize. (1)
tandem azulejo
alicatado thing1 kongo kingkong joeyoung abmem picard Master Host
0 10 20 30
Execution Time (sec)
Execution Time vs. Choice of Master
Mandelbrot application
Application Simulation
Figure 7: Effect on Mandelbrot execution time caused by selecting different machine as mas-ter.
Slave throughput capacities ST P(p) for each potential slave processor p were calculated us-ing ENV values for benchmarked processor speed S(p), predicted values for slave avail-ability A(p), and measured values for the time Tblock a processor with a specified speed would
require to process a single block with the rela-tion:
ST P(p) =S(p)∗A(p)/Tblock. (2)
Our selection algorithm uses these throughput values to form constraints on application per-formance that result from choosing a particu-lar host for the master process. Details for this algorithm will be presented in a later paper.
Our selection algorithm picked tandem as the best choice for master in this particular network configuration and application, a re-sult confirmed by the rere-sults shown in Figure7. What is striking is that it makes considerable difference which machine is assigned the mas-ter process. In particular, a poor choice of placement for the master process results in ex-ecution times that are greater by a factor of four than a good placement in the experiments shown here.
APENet 38.4 Mbit/s kingkong 1900 cygor 1900 koko 1900 joeyoung 1900 kimba 1900 memba 1900 cornelius 1750 magilla 1750
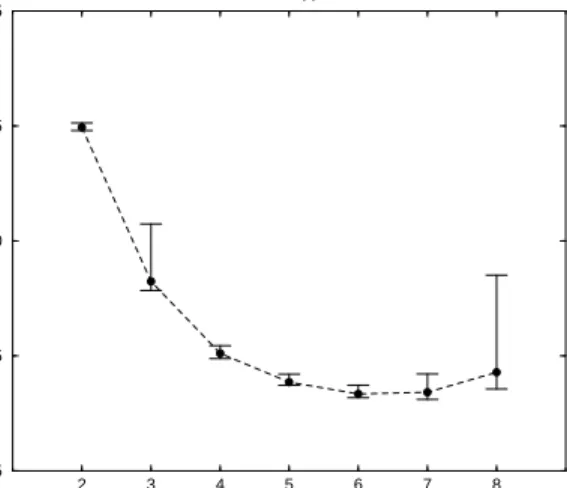
Figure 8: Effective network view for a set of workstations from which we want to select the best number of slaves.
The ENV graph data is also useful in se-lecting the number and placement of slave processes to give the best application perfor-mance. Because of contention for network re-sources, adding more slaves to a computation than can be supported may actually result in reduced application performance. We can use the ENV graph data in an algorithm that iden-tifies how many processors from each subnet can be added to a computation before the ca-pacity of that subnet, or the caca-pacity of the subnet the master is on, is exceeded.
As a simple example of this slave selec-tion algorithm, the network configuraselec-tion rep-resented in the ENV graph of Figure8contains eight processors, on the same subnet, that we wish to consider as slaves for the Mandelbrot application described earlier. Calculating NTP for this network configuration gives a value of 954 blocks/second. Calculating STP for each of the nearly identical processors gives a value of 172 blocks/second. Assuming each proces-sor contributes its maximum work throughput, we can expect the capacity of the network to be reached when using approximately 954/172 = 5.5 slave processors. Figure 9 shows the re-sult of varying the number of slaves while run-ning the Mandelbrot application on the pro-cessors of Figure 8. The results, showing no average gain in performance over 25 trials for more than six slaves, agrees quite well with our prediction based on ENV data.
5
Related Work
It is widely recognized that achieving good per-formance of parallel and distributed applica-tions in a clustered environment benefits from
2 3 4 5 6 7 8 Slaves 5 7.5 10 12.5 15
Execution Time (sec)
Execution Time vs. Number of Slaves
Mandelbrot application
Figure 9: Effect on Mandelbrot execution time caused by selecting different numbers of slaves.
knowledge of the underlying network state. Crandall and Quinn [6], Basney and Livny [2], the AppLeS Project [4] and others use network information to improve the execution of appli-cations in multi-user environments. Bolliger and Gross [5] present a framework to support network-aware applications.
Perhaps most closely related to the work presented here is that of Weissman and Zhao [10] and Subhlok, Lieu and Lowekamp [9] who each discuss systems to provide resource infor-mation (including network characteristics like bandwidth, latency and topology) for local-area environments. Our work differs from these last two examples by demonstrating a method for determining effective network con-figurations using only user-level observations
and measurements, and by not relying on
ex-ternal resource management services.
Finally, the PMH model [1] provides a parameterizable generic programming model, based on a hierarchical view of memory, that is intended to assist in the development of performance-efficient programs for a variety of architectural platforms. The ENV approach shares similar goals, but applied to the prob-lem of scheduling, in representing observable network properties in a structural format that can be related to application performance.
6
Conclusion
We have described in this paper a method for generating effective network views using only user-level testing mechanisms, presented ex-amples for generating effective views for LAN-based systems, and have given an example of how this can be used in distributed applica-tion scheduling. We are currently working on extending the concepts to cover the wide-array network (WAN) case as well as the local-area setting described here. In addition, we are developing the ENV discovery tool as a fun-damental component to improve the determi-nation of efficient schedules in AppLeS dis-tributed application schedulers.
Acknowledgements
We would like to thank the members of the AppLeS Project and our colleagues at SDSC, NCSA and the University of Tennessee for sub-stantive discussions and assistance with the ex-periments.
References
[1] Alpern, B., Carter, L., and
Fer-rante, J.Modeling parallel computers as memory hierarchies. InProceedings of the 1993 Conference on Programming Models
for Massively Parallel Computers (Sept.
1993).
[2] Basney, J., and Livny, M. Improving
goodput by co-scheduling cpu and net-work capacity. submitted to International Journal of Supercomputer Applica-tions and High-Performance Computing.
http://www.cs.wisc.edu/condor/publications.html.
[3] Berman, F. High-performance
sched-ulers. In The Grid: Blueprint for a New
Computing Infrastructure, I. Foster and
C. Kesselman, Eds. Morgan Kaufmann Publishers, July 1998, ch. 12.
[4] Berman, F., and Wolski, R.
Schedul-ing from the perspective of the applica-tion. In Proceedings of the Fifth IEEE
Symposium on High Performance
Dis-tributed Computing (Aug. 1996), pp. 100–
111.
[5] Bolliger, J., and Gross, T. A
framework-based approach to the devel-opment of network-aware applications.
IEEE Transactions on Software
Engineer-ing 24, 5 (1998), 376–390.
[6] Crandall, P. E., and Quinn, M. J.
A partitioning advisory system for net-worked data-parallel processing.
Con-currency: Practice and Experience 7, 5
(1995), 479–495.
[7] Jacobson, V. Pathchar — a tool
to infer characteristics of internet paths. Presented at the Mathematical Sciences Research Institute (MSRI), April 1997. Slides available from ftp://ftp.ee.lbl.gov/pathchar.
[8] Kay, J. Internet
Mea-surement Tool Survey.
http://www.caida.org/Tools/taxonomy.html.
[9] Subhlok, J., Lieu, P., and
Lowekamp, B. Automatic node
se-lection for high performance applications on networks. In to appear in Proceedings of the Seventh ACM SIGPLAN Sym-posium on Principles and Practice of
Parallel Programming (May 1999).
[10] Weissman, J. B., and Zhao, X.
Scheduling parallel applications in dis-tributed networks. Journal of Cluster
Computing 1, 1 (1998).
[11] Wolski, R. Dynamically forecasting
network performance using the network weather service. InProceedings of the 6th High-Performance Distributed Computing