MICHELE CARMINATI,
Politecnico di MilanoMARIO POLINO,
Politecnico di MilanoANDREA CONTINELLA,
Politecnico di MilanoANDREA LANZI,
Università degli studi di MilanoFEDERICO MAGGI,
Politecnico di Milano, Trend Micro Inc.STEFANO ZANERO,
Politecnico di MilanoThe significant growth of banking frauds, fueled by the underground economy of malware, raised the need for effective detection systems. Therefore, in last the years, banks have upgraded their security to protect transactions from frauds. State-of-the-art solutions detect frauds as deviations from customers’ spending habits. To the best of our knowledge, almost all existing approaches do not provide an in-depth model’s granularity and security analysis against elusive attacks.
In this paper, we examine Banksealer, a decision support system for banking fraud analysis, evaluating the influence on the detection performance of the granularity at which the spending habits are modeled and its security against evasive attacks. First, we compare user-centric modeling, which builds a model for each user, with system-centric modeling, which builds a model for the entire system, from the point of view of the detection performance. Then, we assess the robustness of Banksealer against malicious attackers that are aware of the structure of the models in use. To this end, we design and implement a proof-of-concept attack tool that performs mimicry attacks, emulating a sophisticated attacker that cloaks frauds to avoid detection. We experimentally confirm the feasibility of such attacks, their cost and the effort required to an attacker in order to perform them. In addition, we discuss possible countermeasures.
We provide a comprehensive evaluation on a large, real-world dataset obtained from one of the largest Italian banks.
CCS Concepts: •Information systems→Online banking; •Security and privacy→Intrusion/anomaly detection and malware mitigation; •Computing methodologies→Machine learning;
Additional Key Words and Phrases: Online banking, fraud and anomaly detection, spending pattern granularity analysis, mimicry attack;
ACM Reference Format:
Michele Carminati, Mario Polino, Andrea Continella, Andrea Lanzi, Federico Maggi, and Stefano Zanero. 2018. Security Evaluation of a Banking Fraud Analysis System.ACM Trans. Priv. Sec.21, 3 (June 2018), 30 pages. https://doi.org/10.1145/3178370
This work has received funding from the European Union H2020 Programme, under grant agreement 700326 “RAMSES,” as well as from projects co-funded by the Lombardy region and Secure Network S.r.l.
Authors’ addresses: Michele Carminati, Politecnico di Milano, [email protected]; Mario Polino, Politecnico di Milano, [email protected]; Andrea Continella, Politecnico di Milano, [email protected]; Andrea Lanzi, Università degli studi di Milano, [email protected]; Federico Maggi, Politecnico di Milano, Trend Micro Inc. Federico_ [email protected]; Stefano Zanero, Politecnico di Milano, [email protected].
Permission to make digital or hard copies of all or part of this work for personal or classroom use is granted without fee provided that copies are not made or distributed for profit or commercial advantage and that copies bear this notice and the full citation on the first page. Copyrights for components of this work owned by others than ACM must be honored. Abstracting with credit is permitted. To copy otherwise, or republish, to post on servers or to redistribute to lists, requires prior specific permission and/or a fee. Request permissions from [email protected].
© 2018 Association for Computing Machinery. 2471-2566/2018/6-ART $15.00
1 INTRODUCTION
The popularity of Internet banking has led to an increase of frauds, perpetrated through cyber-attacks, phishing scams and malware campaigns, resulting in substantial financial losses [5, 48]. Financial malware seems to be evolving through the collaboration between malware creators, growing by 16% since Q1 2016 [14]. In 2016 financial malware infected about 2,8 million personal devices, a 40% increase since 2015 [1].
This raised the need for effective fraud analysis systems able to detect frauds with a low False Positive (FP) rate. What makes banking fraud detection extremely challenging is the inherently dynamic behavior that characterizes them. One of the main challenges to address is being able to spot frauds spread across different customer profiles, and dispersed in large datasets. An additional challenge is creating systems that are adaptive both to changing customer behavior and to the cultural and behavioral differences in different regions of the world.
Commercial systems do exist, but they offer limited insight in their inner workings due to obvious intellectual property concerns. Academic research on the subject, on the other hand, is severely limited because of the limited availability of datasets of transactions and frauds (due to obvious privacy concerns).
To the best of our knowledge, state-of-the-art solutions detect frauds as deviations from the spending habits of bank customers and build black-box models that are not very insightful for ana-lysts in the subsequent manual investigations, making the process less efficient. More importantly, as far as we know, almost none of them provides an accurate analysis of model’s granularity and an in-depth security analysis against evasive attacks (i.e., mimicry attack).
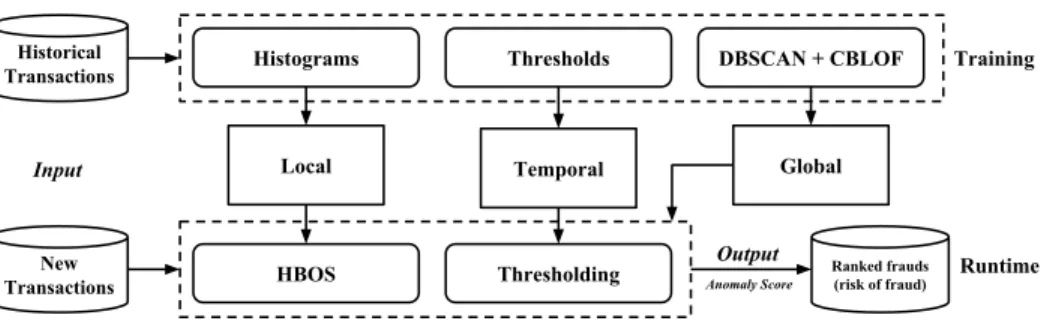
With Banksealer [10, 11] we introduced an effective online banking decision and fraud analysis system. In particular, Banksealer automatically ranks frauds and anomalies in wire transfer, prepaid phone, and debit cards transactions. During a training phase, it builds a local, global, and temporal profile for each user. The local profile models past user behavior to evaluate the anomaly of new transactions. The global profile clusters users according to their transactions features. The temporal profile aims to model transactions in terms of time-dependent attributes. Banksealer also handles the undertraining of user profiles.
While the experiments presented in [11] showed the effectiveness of Banksealer, two important points were left open for research at the time. First, the approach described in the original paper was based on a user-centric profiling, and did not consider a system-centric approach, where the detection model characterizes the general interactions between “users” and the bank. This approach has been broadly used for behavioral malware detection [13, 25]. Second, a security analysis of the detection model against a motivated and advanced adversary was needed in order to validate the robustness of the system.
For these reasons, in this paper we aim to (1) provide an analysis of the influence of model’s granularity on Banksealer by comparing the performance of the user-centric approach against the system-centric approach and (2) to perform an in-depth security analysis of Banksealer by measuring its effectiveness against evasive attacks in terms of detection performance. We first redesign Banksealer with a system-centric approach (see Section 5). We then compare the original approach with the redesigned one, using real-world banking transactions data. Thanks to the collaboration with an important Italian bank and leveraging the domain expert’s knowledge, we reproduced frauds (in a controlled environment) performed against banking users, and recorded the resulting fraudulent transactions. As a result, we can experimentally confirm that a user-centric modeling outperforms a system-centric one in terms of detection rate, while the latter has less computational requirements and is more generic (see Section 7.3.1). We then analyze the security of Banksealer against an attacker who is equipped with knowledge about its inner workings. We
implement a proof-of-conceptmimicry attack, allowing the adversary to try to cloak frauds and evade the detection. We find that this attack is effective, hiding a considerable amount of fraudulent transactions. Still, we show that Banksealer mitigates mimicry attack and correctly detects such frauds with up to 80% detection rate and a false positive rate lower than 10% (see Section 7.4).
This paper extends [11] with original concepts, discussions and new results. In summary, we make the following novel contributions respect the previous work:
• We extend and complement the original Banksealer paper by comparing its effectiveness against a system-centric approach.
• We assess the robustness of Banksealer against a mimicry attack in which an attacker, equipped with knowledge of the system, tries to perform frauds that mimic legitimate transactions.
• We provide a comprehensive evaluation of the above aspects by using an anonymized, real-world dataset of banking transactions.
1.1 Document Organization
The reader interested in a high-level introduction on Internet banking frauds should start from Section 2, which provides the background terminology and concepts, along with a general overview of typical fraud schemes. We highlight the importance of model granularity and the feasibility of attacks that weaken the detection capabilities of a system such as ours.
In Section 3 we review the state of the art of research on fraud detection. We focus on
prac-ticalapproaches and mechanisms that can be applied in real scenarios and that recognize the
consequences, or post-conditions, of a fraud. This includes techniques to find anomalous financial transactions in a bank account. In addition, we review the literature related to mimicry attacks.
Section 4 provides a detailed summary of our previous work in the field [11]. We refer the interested reader to the original paper for further details, although we provide enough information to understand the contributions of this work.
In Section 5 we evaluate, from the theoretical point of view, the influence of the granularity at which the spending habits are modeled. We compare the user-centric modeling, used in [11], with a system-centric one. We discuss their respective advantages and disadvantages.
In Section 6 we introduce the definition of mimicry attacks applied to fraud analysis systems. We present the design and the implementation of an attack tool which allows a sophisticated attacker to cloak frauds to avoid detection.
In Section 7 we provide a comprehensive evaluation of Banksealer. First, we compare user-centric and system-centric modeling from the point of the detection performance. Then, we present the results of the security analysis of Banksealer against the mimicry attack.
In Section 8 we discuss the limitations of our work and the impact of the security and granularity analysis.
Finally, Section 9 provides conclusions and key aspects of the evaluation of Banksealer from the point of view of modeling granularity and the security against expert attacks.
2 PROBLEM STATEMENT AND MOTIVATION
Banking services are heavily targeted by cyber criminals. A compromised banking account can be used to directly steal funds from the available balance, or can be sold on the underground market1. Moreover, fraudsters constantly improve their techniques to contrast online banking defenses. For this reason, fraudulent behavior is dynamic, rare, and dispersed in very large and highly imbalanced 1https://blog.kaspersky.com/hacking-value/2161/
TOKEN TOKEN BANKING TROJAN TOKEN AUTHENTICATION TRANSACTIONS AUTHENTICATION $$$$
Fig. 1. Typical Fraud Scheme: MitB and MitMo attacks.
datasets. In addition, customer habits change over the time making more difficult to distinguish fraudulent transactions from normal ones.
2.1 Banking Fraud Scenario
In this paper, we use the broad termattackto refer to any attempt to commit a fraud against an unaware user. During the years several threats have emerged against banking services. Besides the traditional ones, such asPassword Database Theft, which aims at stealing users’ credential from a web service to re-use them to hack other website’s accounts, orPhishing, which aims to acquire sensitive information by masquerading as a trustworthy entity in an electronic communication, the main threat is represented bybanking Trojanor “infostealers”. This malware leverages Man-in-the-Browser (MitB) techniques to intercept and modify web pages, as well as transaction content, at the level of the rendering engine of the browser, in a way undetectable by the user and host application. Endpoint solutions offer little protection because are hard to deploy uniformly, due to the variety of devices (e.g., phone, tablet, desktop). Also, modern banking Trojan are often able to bypass the second factor authentication, if present, by infecting the mobile device (Man-in-the-Mobile (MitMo) attack) and stealing the OTPs sent via text messages, or by deceiving the user into entering the OTP when needed, or by stealing the complete set of OTPs (e.g., grid card). Therefore, effective fraud-detection solutions to identify fraudulent transfers are still a much-needed product.
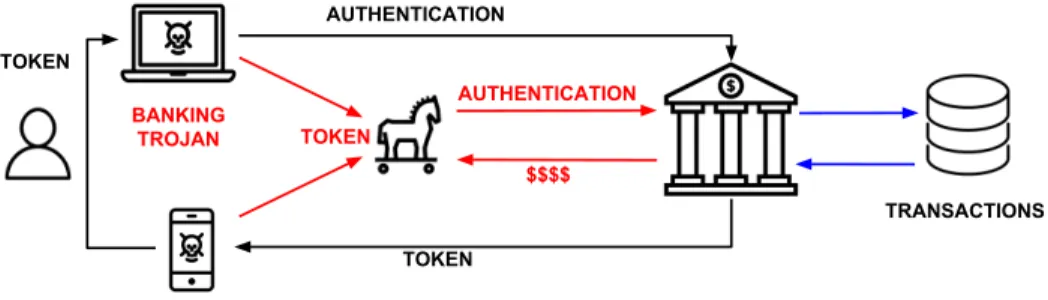
In Figure 1 we show the typical scheme of a fraud in which a banking Trojan infects the victim’s PC and mobile device and has the capabilities of executing multiple transactions (MitB and MitMo attacks), while remaining undetected.
2.2 Fraud Analysis and Detection Systems
To contrast fraudulent cyber-attacks banks developed fraud analysis and detection systems that aim at identifying unauthorized activities as quickly as possible once they have been carried out. These systems monitor and scrutinize banking transactions, comparing their patterns with transactions history and scoring suspicious transactionson-the-flyfor analyst’s verification. Since all analysis needs a time-consuming manual investigation, the number of high ranked transactions should be kept at a manageable level (i.e. the systems must have a low false positive rate).
Fraud analysis and detection systems must evolve because criminals will adapt their strategies in order to circumvent them. Despite the importance of the problem, the development of new banking fraud detection and analysis methods is made difficult by the limited availability of transaction and fraud datasets, due to privacy concerns. As a consequence, only a limited amount of papers deals with this problem. Existent solutions detect frauds as deviations from the spending habits of bank customers. Commercial systems do exist, but they offer limited insight in their inner workings due to obvious intellectual property concerns.
2.3 Research Goal
Our previous work, Banksealer [11], tried to overcome the limitations of state-of-the-art solutions. First, it has been developed and evaluated on a real-word dataset of Internet banking transactions. A major difference between existing approaches is that they do not give the analyst a motivation for the analysis results, making manual investigation and confirmation more difficult. On the contrary, Banksealer supports analysts by ranking new transactions that deviate from the learned profiles, with an output that has an easily understandable and immediate statistical meaning. In other words, it helps the analyst in understanding the reasons behind fraud alerts.
While the experiments presented in [11] showed that Banksealer is an effective approach in identifying bank frauds, several important points were not addressed. First, the approach described in the original paper based its own detection on the profiling of users and it did not take into con-sideration an analysis of the detection performances varying the granularity at which transactions are modeled. A system-centric approach, where the detection model characterizes the general interactions between users and the bank operations, must be considered. Second, a deeper security analysis of the detection model need to be considered in order to validate the robustness of the system attacks.
Therefore, the focus of this work is to overcome these limitations, evaluating the influence on the detection quality of the granularity at which the spending habits are modeled and its security against sophisticated attacker that cloaks frauds to avoid detection.
3 RELATED WORKS
Fraud analysis and detection, mainly focused on credit card fraud, is a wide research topic, for which we refer the reader to [5, 12, 32] that present a comprehensive survey of data mining-based fraud detection research.
Fromthe supervised point of view,[2] proposed an offline rule-based Internet banking fraud detection system based on key-features, extracted from data analysis, necessary, for the authors, to detect frauds. The proposed technique cannot work in real time and thus is profoundly different from Banksealer.
FraudMiner[38] proposed a credit card fraud detection model for detecting fraud from highly
imbalanced and anonymous credit card transaction datasets. The class imbalance problem is handled by finding legal as well as fraud transaction patterns for each customer by using frequent itemset mining. A matching algorithm based onApriorifrequent itemset mining is also proposed to find to which pattern (legal or fraud) the incoming transaction of a particular customer is closer, and a decision is made accordingly. However, the proposed technique does not consider users that have only one transaction: these users are removed, and the dataset is reduced to a half. This is a very strong limitation, because undertrained users are common and important too in the fraud detection domain. On the contrary, our approach handles the problem of dealing with the scarcity of data that might not be enough to train an anomaly detection system in a reasonable time frame.
Other two supervised approaches are [44], and [3]. The first proposes a dynamic model which is updated with a sliding window approach. A model is trained each day and it is used to classify transactions of the next day. For each transaction, it computes aggregate attributes (e.g., average amount, number of transactions) and network attributes based on relationships between credit card holders and merchants. The second applies two approaches for fraud detection: neural network committee, which is an ensemble of neural networks with different topologies, and clustering. Clustering is used to produce training sets that are given in input to the neural network committee. All attributes are converted into binary variables (e.g., attributes that represent real values are split into intervals while binary variables represent the membership to each interval). The main
limitation of these two works is that they depend on supervised information, which are not always available, to build the fraudulent model. Unlike Banksealer, they are not very insightful for analysts in the subsequent manual investigations, making the process less efficient. Furthermore, we believe that a general problem of supervised detection approaches is that usually adopt static supervised models of fraudulent behavior, which cannot be automatically updated, but always require a manual intervention (i.e., addition of a rule, a label). Consequently, these systems usually have a high false positive rate when a new fraud pattern emerge.
Fromthe unsupervised point of view, [29, 41] proposed a detection mechanism to identify illegitimate users and trace their unlawful activities using Hidden Markov Model (HMM). HMM is a very powerful model when it works on temporal classification problems and on a large training dataset. In other cases when the training dataset is not large enough it can easily miss-classified data and produce high false positive rate [34]. Our approach, instead, uses semi-supervised learning model that lies between supervised and unsupervised learning. In addition to unlabeled data, the algorithm is provided with some supervision information – but not necessarily for all examples. In our case, the supervised information was the absence of fraud in the training dataset. Moroever semi-supervised learning also support a computational model for understanding human category learning, where most of the input is self-evidently unlabelled [49]. In addition, unlikely our approach, they are not designed on real data. Real transaction data, has many peculiarities (e.g., skewed attribute distribution) that have huge implications for the typical statistical and data mining methods used in the outlier detection field.
The approach presented in [48] is interesting as it combines various algorithms by considering the dependence between events at different points in time, to produce an overall risk score. In particular, it differentiates fraudulent behavior from genuine behavior trying to overcome contrast pattern mining shortcomings. In practice, it introduces a hybrid model, combining decision forests, cost-sensitive artificial neural networks and a classifier based on Emerging Patterns to increase its statistic modeling capability and to reduce the number of “false” rejections. Another interesting aspect is represented by the dataset description and feature extraction, which confirms the peculiarity of our dataset and the assumptions made in our previous work [11]. However, this approach deals with the logs of the online banking web application, and thus is profoundly different from Banksealer since it does not detect frauds as much as irregular interactions with the bank application.
[45] presents an analyst-in-the-loop security system, where analyst intuition is put together with state-of-the-art machine learning to build an end-to-end active learning system. The system has four key features: a big data behavioral analytics platform, an ensemble of outlier detection methods, a mechanism to obtain feedback from security analysts, and a supervised learning module. In particular, their platform integrates outlier detection methods based on Principal Component Analysis [39], neural networks ([20, 36, 37] and statistical models. The previous method, and in general neural network approaches [16, 26, 31] and decision tree techniques [35, 40] present several disadvantages in the fraud detection context. For example, they have poor explanation capability, are less efficient in processing large data sets and difficult to setup and operate. In addition, they are so sensitive to data format and data representations (i.e., a large number of parameters) that can produce different results. In general, these types of approaches build black box models that are not very insightful for analysts in the subsequent manual investigations, making the process less efficient.
A recurrent concept in many fraud detection works isthe granularity at which the detection is performed.
[23] is based on an unsupervised modeling of local and global observations of users’ behavior, and relies on differential analysis to detect frauds as deviations from “normal” behavior. This evidence is strengthened or weakened by the users’ global behavior. In particular, from the local point of view,
the proposed approach compares a buffer of current session transactions, “current profile”, with recent transactions, “mean profile”, through statistical methods. By doing this, the system monitors the payment frequency, number of failed, and successful logins. The global analysis instead, requires a software directly installed on client devices to login to the online banking portal. This software provides a device identification and associates devices with user’ account. The proposed system exploits the global profile to strengthen fraud hypothesis if the login happened from a device previously involved in frauds, to weaken it if the login belongs to a legit device. The probability of fraud, derived from the combination of the approaches, is obtained through the “Dempster-Shafer” evidence theory. The major drawback of this approach is that the data collection must happen on the client side, which makes it cumbersome to deploy in large, real-world scenarios.
Other works that exploit model granularity are [6] and [4] that apply Peer Group Analysis and Break Point Analysis on spending behavior. Peer Group Analysis detects individual objects that behave in a way different from objects to which they had previously been similar. On the other hand, Break Point Analysis operates on the account level. A break point is an observation where anomalous behavior for a particular account is detected. Such techniques present the disadvantages of the unsupervised techniques already explained above.
Other two relevant works that can be applied for fraud detection are [28, 33]. In particular, the PhD thesis by Maruatona[28], presents a background to online banking fraud, focusing on phishing attacks, followed by a survey of different methods for outlier detection used for intrusion and fraud detection. The author presents an innovative method for detecting fraud by using prudent analysis, a technique through which a system can detect when its knowledge is insufficient for a given case. The PhD thesis by Prayote, instead, presents a background to network traffic anomaly detection and proposes a method based on a knowledge acquisition approach named Ripple Down Rules. In essence the author uses Ripple Down Rules to partition a domain, and add new partitions as new situations are identified. Within each supposedly homogeneous partition the author used statistical techniques to identify anomalous data that are reasonably robust with small amounts of data. This critical situation occurs whenever a new partition is added. These methods can be considered complementary to our approach and can be used in conjunction with it.
Though there has been a good amount of research on fraud analysis,the security of these systems against evasive and adaptive adversarial attacksseems to us not to have received much attention in the banking fraud detection context. In particular, all the related works presented above does not even consider the problem of evasive and “smart” attackers. However, the idea of “mimicry attacks” [47] is a recurrent concept in the intrusion detection field. Here we report some
of the mostly significant work in the area.
In [47] and in the previous work [46], the “mimicry attack” concept was introduced. They proposed three methods to avoid detection: (i) modifying system call parameters; (ii) inserting system calls that are irrelevant to the attack being deployed while minimizing the anomaly rate; and finally (iii) generating equivalent attacks by replacing the system calls that can easily be identified by the detector.
[42] showed how attackers can render host-based IDS’s blind to the presence of their attacks. They presented compelling experimental results to illustrate the risk. They employed four methods to manually change the behavior of the attack: (i) hiding an attack in the blind spot of the detector; (ii) modifying an attack so that it looks like a normal behavior; (iii) hiding an attack so it looks like a less dangerous attack; and (iv) modifying an attack so that it looks like a different attack. In follow-up work, [43] refined the technique and gave further experimental confirmation of the risk from such attacks.
Using a categorization scheme, [15] divided anomaly detectors into three categories: black-box detectors that only make use of the system calls, gray-box detectors that use – in addition to system
calls – runtime observations, and white-box detectors that also incorporate information from the source code, which makes it difficult to hide the attacks. They introduced a gray-box model of system call behavior, called an execution graph and showed the benefits and overheads of changing gray-box anomaly detector parameters. When used as the model in an anomaly detection system monitoring system calls, it offers two strong properties: (i) it accepts only system call sequences that are consistent with the control flow graph of the program; (ii) it is maximal given a set of training data, meaning that any extensions to the execution graph could permit some intrusions to go undetected. Experimental results indicated that expanding the model by using more information would increase the mimicry attack length. In other words, attackers will need more code to hide their actions.
[24] developed a methodology to evade the detection features of state-of-the-art intrusion detection systems [9] and reduce the task of the intruder to a traditional mimicry attack. Given a legitimate sequence of system calls, their technique allows the attacker to execute each system call in the correct execution context by obtaining and relinquishing the control of the application’s execution flow through manipulation of code pointers. They have developed a static analysis tool for Intel x86 binaries that uses symbolic execution to automatically identify instructions that can be used to redirect control flow and to compute the necessary modifications to the environment of the process. They used their tool to successfully exploit three vulnerable programs and evade detection by existing state-of-the-art system call monitors. In addition, they analyzed three real-world applications to verify the general applicability of their techniques. Defensive mechanisms against such attacks are presented in [7, 8].
[17] generated mimicry attacks by applying automatic model checking to prove that no reachable operating system configuration corresponds to the effect of an attack.
[30] proposed a mimicry attack methodology against “powerful system call monitors”, detector that has full knowledge of the system call parameters as well as their roles in the execution of the system call. They introduced persistent interposition attack concept where the objective of the attacker is to modify the read and write system calls to deploy the attack. Their results showed that although the persistent interposition attacks are not powerful enough to obtain a root shell, they can evade monitors that monitor system call arguments while achieving goals such as stealing financial information or impersonating web servers.
[22] emphasized the importance of analyzing not only the exploit but also the preamble of an attack. In particular, they observed that although the attacker can modify the exploit component easily, the attacker may not be able to prevent preamble from generating anomalous behavior since during preamble stage, the attacker does not have full control. Their experiment results showed that preamble can be a source of anomalies, particularly if it is lengthy and anomalous.
4 OVERVIEW OF BANKSEALER
In this section, we recall Banksealer’s main underlying concept, describing its functionalities insofar as necessary to understand the granularity and the security analysis against mimicry attacks. We refer the interested reader to the original paper [11] for additional details about Banksealer.
Banksealer, depicted in Figure 2, characterizes the users of the online banking web application by means of a local, a global, and a temporalprofile, which are built during a training phase, taking as input a list oftransactions. Each type of profile (i.e., local, global, temporal) extracts different statisticalfeaturesfrom the transaction attributes (e.g., average, minimum, maximum, actual value), according to the type of model built. Once the profiles are built, Banksealer processes new transactions and ranks them according to their anomaly score and the predicted risk of fraud.
Theanomaly scorequantifies the statistical likelihood of a transaction being a fraud with respect to
Historical
Transactions Histograms Thresholds DBSCAN + CBLOF
Local Temporal Global
HBOS Thresholding New Transactions Training Runtime Ranked frauds (risk of fraud) Output Input Anomaly Score
Fig. 2. Banksealer architecture.
with the transaction amount. Banksealer provides the analysts with a ranked list of potentially fraudulent transactions, along with their anomaly score.
Thanks to the collaboration with domain experts, and after a preliminary analysis of the dataset (see [11]), we selected relevant attributes. Beyond the common ones (such asAmount,IPaddress of the customer, andTimestampof the transaction), we selected the following attributes:
• CC_ASN: the country from which the customer makes their connection, based on the Autonomous System.
• UserID: unique ID associated to a user.
• IBAN,IBAN_CC: the identifier of the beneficiary account, and country. • Card type(i.e., the circuit), andnumberof the prepaid card.
• Phone operator, andnumberof the beneficiary of the top-up.
From the actual values of all the attributes listed in Table 1, we extract the features used to model user’s spending pattern, for a total of more than 12 aggregated features (not counting bin of histograms as features). In particular:
• From the amount we automatically extract its marginal distribution by means of a histogram. By doing this we obtain one feature for each bin that corresponds to a range of amount (e.g., 0-100€, 100-500€). In addition, we aggregate its values and compute the monthly mean and the standard deviation.
• From the timestamp we automatically extract its marginal distribution by means of a his-togram. By doing this we obtain one feature for each bin that corresponds to a range of time (e.g., 0-6, 6-12).
• For categorical features (i.e., IBAN, IBAN_CC, ASN, IP) we count the frequency of each occurrence and keep a feature for each of these values.
• We aggregate transactions and compute the daily and monthly number of transactions.
4.1 Local Profiling
The goal of this profiling is to characterize each user’s individual spending patterns. It models the features of the user’s transactions and assigns an anomaly score to each unseen transaction.
Table 1. Attributes for each type of transaction. Attributes inboldare hashed for anonymity needs.
Dataset Attributes
Bank Transfers Amount, CC_ASN,IP,IBAN, IBAN_CC, Timestamp Phone recharges Amount, CC_ASN,IP, Phone operator,Phone number, Timestamp Prepaid Cards Amount, Card type,Card number, CC_ASN,IP, Timestamp
Training and feature extraction.During training, we aggregate the transactions by user and approximate each feature distribution by a histogram. More precisely, we calculate the empirical marginal distribution of the features of each user’s transactions. We do not consider correlation between features to gain lower spatial complexity and better readability of the histograms. This representation is simple, effective, and, hence, is indeed directly readable by analysts who get a clear idea of the typical behavior by simply looking at the profile. Forcategorical attributes(e.g., IP, CC), we count the occurrences of each category. Fornumerical attributes(e.g., amount, timestamp) we adopt a static binning and count how many values falls inside each bin. After this, we estimate the marginal frequency of the features, computing the relative frequency.
Runtime and Anomaly Score Calculation.At runtime, we calculate the anomaly score of each new transaction using a modified version of Histogram Based Outlier Score (HBOS) [18] method. The HBOS computes the probability of a transaction being anomalous, according to the marginal distribution learned. In particular, it considers the relative frequency of each bin to quantify the log-likelihood of the transaction to be drawn from the distribution. The HBOS score is computed as follow:
HBOS(t)= Õ 0<i≤d
log 1
histi(ti) (1)
whereti is thei-th feature of the transactiont, histi indicates the frequency of thei-th feature. We improved (1) to account the variance of each feature, by applying a min-max normalization [19, pp. 71–72] to the frequency of each value. In addition, we add a weighting coefficientwi to each i-th feature, to allow the analyst to tune the system according to the institution’s priorities. In conclusion, the anomaly score is computed as follow:
HBOS(t)= Õ 0<i≤d wi·logf1 (ti); Õ 0<i≤d wi =1 (2)
wheref(ti)is the normalization of histi that corresponds to the formula: f(ti)= histi(ti)
maxj∈f eatur eihisti(j)
(3) When a feature value has never occurred during training for a user (i.e., zero frequency within the local profile), the respective transaction may be assigned a high anomaly score. However, a user may have just changed his spending habits legitimately, thus causing false positives. To mitigate this, we calculate the frequency of unseen values ask/1−f, wheref is the frequency of that value in the entire dataset. This method quantifies the “rarity” of a feature value with respect to the global knowledge. The parameterkis an arbitrarily small, non-zero number.
4.2 Global Profiling
The goal of this profiling is to characterize “classes” of spending patterns, by separating anomalous users from normal ones. The global profile builds, for each user, a simplified version of the local profile (see Section 4.1), more suitable to compute the similarity between users. The global profile is also leveraged to find local profiles for undertrained users. The rationale is that users belonging to the same cluster exhibit similar spending patterns.
Training and Feature Extraction.During training, we first create a global profile for each user. Each user is represented as a feature vector of six components: total number of transactions, average transaction amount, total amount, average time span between subsequent transactions, number of transactions executed from foreign countries, number of transactions to foreign recipients (bank transfers dataset only).
To find classes of users with similar spending patterns, we apply an iterative version of the Density-Based Spatial Clustering of Applications with Noise (DBSCAN), using the Mahalanobis distance [27] between the vectors.
To mitigate the drawbacks of the classic DBSCAN when applied to skewed and unbalanced datasets such as ours (i.e., one large cluster and many small clusters), we run 10 iterations for decreasing values ofεfrom 10 to 0.2, which is the maximum distance to consider two users as connected (i.e., density similar). High values of this parameters yield a few large clusters, whereas low values yield many small clusters. At each iteration, we select the largest cluster and apply DBSCAN to its points with the next value ofε. The smaller clusters at each iteration are preserved. We stop the iterations whenever the number of clusters exhibits an abrupt increase (i.e., a knee). In all our experiments, we empirically observed that this happens at 0.2. As a result, we obtain a set of clusters, which contain similar user profiles.
Anomaly Score Calculation.We assign to each user global profile an anomaly score, which tells the analyst how “uncommon” the spending pattern is with respect to other customers. For this, we compute the unweighted-Cluster-Based Local Outlier Factor (CBLOF) [21] score, which considers small clusters as outliers with respect to large clusters. More precisely, the more a user profile deviates from the dense cluster of “normal” users, the higher his or her anomaly score will be. The CBLOF anomaly score is the minimum distance of a user profile from the centroid of the nearest largest cluster. CBLOF takes only two parameters (αandβ), which we evaluated empirically by considering as “normal” the 90%-percentile of the user profiles. The clustering is re-run according to the sampling frequency (i.e., 1 month).
4.3 Temporal Profiling
The goal of this profiling is to deal with frauds that exploit the repetition of legitimate-looking transactions over time (e.g., frequent wire transfers of amounts that not violating the local). We construct a temporal profile for each user having enough past transactions. It monitors the spending profile of users, comparing it against profiles learned during the training phase.
Training and Feature Extraction.During training, we aggregate the transactions of each user over time and calculate the sample mean and variance of the numerical features. For each user, we extract the following aggregated features: total amount, total and maximum daily number of transactions. During training, we compute the mean and standard deviation for each feature, and set a threshold at mean plus standard deviation to classify transactions as anomalous. Undertrained users are excluded from temporal profiling because occasional transactions have a high variance, unsuitable for this kind of analysis.
Runtime and Anomaly Score Calculation.At runtime, for each user and according to the sampling frequency, we calculate the cumulative value for each feature. Then, we compute the delta between each cumulative value and the respective threshold. Positive deltas are summed up to form the anomaly score.
4.4 Undertrained and New User Management
An undertrained user is a user that performed a small number of transactions. These users are a relevant portion of our dataset; thus, we need an effective way to deal with them. For undertrained users, we consider their global profile and select a cluster of similar users. For each incoming transaction, our system calculates the anomaly score using the local profile of both the undertrained user and thek nearest neighbor users (according to the Mahalanobis distance as detailed in Section 4.2). For new users, we adopt the same strategy. However, given the absence of a global profile, we consider all the users as neighbors.
5 GRANULARITY ANALYSIS
A fraud can be performed on a single user, or split it across multiple users (for higher efficiency and lower accountability). For this reason, anomaly detection approaches for fraudulent behavior can be roughly divided inuser-centricorsystem-centricdepending on the model granularity [5, 12, 32].
5.1 User-centric Approach
According to theuser-centricapproach, the dataset is modeled by many mutually independent models that represent different users. As a consequence, an outlier is a transaction that is anomalous when compared to data belonging to a user.
This low-level modeling approach is effective when the “population” in the data is heterogeneous. In fact, as shown in the analysis of the dataset presented in [11], this can be true for banking transaction data where spending behavior between accounts can vary according to amounts spent. In particular, we noticed a dissimilarity between system-centric vs. user-centric attribute distributions. When analyzed globally, most of the users tend to behave in a comparable way (e.g., low amounts are more common than high amount). However, when analyzed locally, some attributes show a skewed distribution, often with more than one modality. In this context, once we identify the spending behavior of a particular account, then a transaction is a fraud if it is anomalous with respect to this account, but not necessarily anomalous to the entire population of transactions. For example, a transaction of a thousand dollars in an account where, historically, all transactions have been under a hundred dollars, might be considered as an outlier. However, such a transaction may not have been considered unusual if it had occurred in a high spending account. Therefore, this modeling technique may lead up to obtain a high detection rate, since it is able to discern subtle differences between anomalies and normal transactions belonging to an account. Unfortunately, the strength of this model may turn into a weakness when it is tightly fitted to data (i.e., model over-fitting), that, in turn, produces a high false-alarm rate.
5.1.1 User-centric Design.The user-centric approach, implemented by Banksealer (see Section 4),
characterizes the users of the financial institution by means of a local, a global, and a temporal profile, which are built during a training phase taking as input a list of transactions. Once the profiles are built, it processes new transactions and ranks them according to their risk of fraud, computed thanks to the local and temporal profiles.
Training. During training, we aggregate transactions by user and approximate each feature distribution by a histogram for the local profile and by a set of thresholds at mean plus standard deviation for the temporal profile.
Runtime.At runtime, following the procedure described in Section 4.1 and 4.3, we compute the anomaly score of each new transaction using the HBOS [18] method for the local profile and the delta between each feature’s cumulative value and the respective threshold for the temporal profile.
5.2 System-centric Approach
According to thesystem-centricapproach, the dataset is modeled by a global model, responsible to represent the entire system. Consequently, in this context a fraud is a transaction anomalous to the entire data set; for example, a transaction of several thousand dollars would be a global outlier if all the other transactions in the database were considerably less than that amount.
This modeling approach suggests the existence of a common spending pattern between users. In fact, as shown in the dataset analysis presented in [11], the majority of users tend to behave in a similar way from a global point of view. In particular, we observed that some attributes (e.g. Amount, Timestamp) of the dataset, have a skewed distribution with a high cardinality associated
(a) PCA of the dataset on two dimensions Users
(b) ROC curve detail.
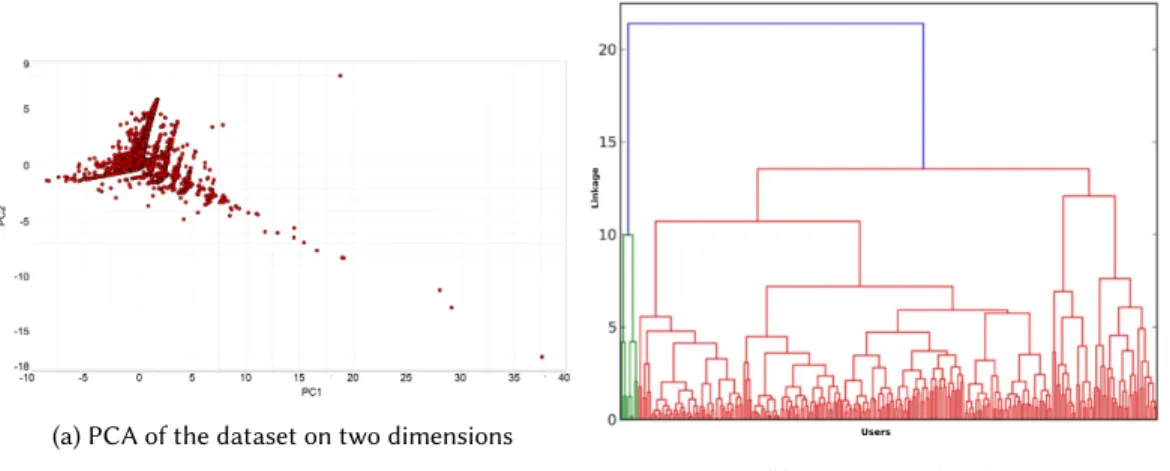
Fig. 3. Dendrogram representing the hierarchical clustering using the Mahalanobis distance. The different colors represent the clusters obtained cutting dendrograms at 75% linkage.
to few values. In Figure 3a we show the Principal Component Analysis (PCA) on two dimensions that we have applied to the users’ profiles. As it can be seen, they tend to congregate in one dense cloud of points, with several outliers points and small groups around it. Figure 3b presents the dendrogram relative to the application of the hierarchical clustering algorithm. The vertical axis expresses the linkage (measure of similarity) at which elements are joined: the lower the linkage, the more similar they are. As it can be seen, there are a lot of elements joined with a high similarity. These elements compose the large cluster of very similar profiles observed before. Hence, the majority of users yield densely “connected” areas of the dendrogram. On the other hand, users with rare spending profiles tend to form small, isolated groups.
This high level modeling approach is designed to represent the global behavior in terms of the interaction between the users and the system, and, hence, is more resistant to the over-fitting problem. However, they have a limited ability to adapt to all possible kind of transactions (under-fitting problem), which may result in both high false alarm rates and low anomaly detection rates.
Obviously, it is not simple to avoid the over-fitting or under-fitting problems.
5.2.1 System-centric Design.We re-design Banksealer with a system-centric approach paradigms
in mind, profiling all the users’ transactions together to characterize the entire system. In practice, the system-centric approach applies the local and temporal profiles at the whole dataset without distinguishing between users.
The system-centric approach does not implement the functionality of the global profile, since it does not work at user’s granularity (i.e., it does not distinguish between users).
Training.During training, we aggregate all the transactions together and approximate each feature distribution by a histogram for the local profile and by a set of thresholds at mean plus standard deviation for the temporal profile.
Runtime.At runtime, following the procedure described in Section 4.1 and 4.3, we compute the anomaly score of each new transaction using the HBOS [18] method for the local profile and the delta between each feature’s cumulative value and the respective threshold for the temporal profile.
6 SECURITY ANALYSIS
As explained in Section 2.2, the goal of a fraud analysis system is to identify unauthorized trans-actions as quickly as possible, so that banking analyst can take an appropriate action. To evade detection, fraudsters adapt in response to deployed defensive systems. As a matter of facts, most of the attacks arise from financial Trojans, malicious software that may someday incorporate techniques designed to evade popular fraud analysis systems. Therefore, it is not enough to design a system that can detect attacks that are common at the time the system is deployed. Instead, such systems should be robust also against potential future threats and evasive attacks.
Though there has been a good amount of research on fraud analysis (see Section 3), the security of these systems against adversarial and evasive attacks, defined as “mimicry attacks” [46], seems not to have received much attention in the banking fraud analysis context.
To remedy this shortcoming, we give a systematic study of the issue. In particular, we design mimicry attacks for the banking context in terms of an operational research problem and evaluate their power against Banksealer.
6.1 Mimicry Attack Theory and Definition
Mimicry attacks [46] allow sophisticated attackers to cloak their frauds to avoid detection. These attacks mimic the user behavior during the execution of transactions, but with a malicious intent. In other words, a successful mimicry attack will be recognized as “normal” by a detection system and will not raise any alarm. As a consequence, the more a detection system is resistant to a mimicry attack the more it is difficult and costly for an attacker to deploy an attack such that. The formalization of this attack is usually easier for signature-based detection systems, since it requires the attacker to simply generate “new frauds”, not known by the system. However, this is not true for anomaly detection systems that require a careful examination of their inner working [47]. Therefore, it is necessary to give a formal definition of mimicry attack, suitable for the banking context and applicable to Banksealer.
Following the methodology presented in [47], we start with a few assumptions that allow to simplify the analysis.
Since security through obscurity is not a reliable defense and Banksealer has been object of research publications [10, 11], it is natural to assume that the attacker knows how it works. Even for a generic fraud analysis system it is unavoidable: if it becomes popular and widely deployed, it is extremely difficult to prevent the reversing of the system itself by the attacker. As a consequence, we can assume that the algorithm is known by attackers.
Fraud detection systems rely on a database of users’ “normal behavior”. Therefore, it will require the attacker to create some approximation of this database. Users’ behavior depends primarily on the transactions executed during the interaction with the banking system. Moreover, in the light of the threat scenario presented in Section 2, we can also assume that the attacker can silently take control and infects the targeted user system without being detected. In general, attacks can be divided into 1) infection phase, when the attacker infects the target systems with a banking Trojan (e.g., exploiting a known browser vulnerability, phishing) and 2) exploitation phase, when the MitB attack, is activated. Therefore, an attacker could readily obtain a useful approximation of the transactions by collecting data from infected systems. Since Banksealer associate different models to each user, it will require the attacker time and a lot of effort to acquire enough data to build an approximation of the models in use. However, it seems reasonable to assume that the database of normal behaviors is mostly (or entirely) known.
Finally, we assume that the attacker will try to maximize the amount of money stolen, always under the assumption of remaining undetected. In fact, in this attack malicious transactions are
executed by the banking Trojan and depends on its persistence in the system: the malware can be detected on the victim’s system by an anti-virus software or the Command and Control server can be taken down by authorities.
Giving those assumptions, the attacker can now generate a malicious sequence of fraudulent transactions trying not to be detected (i.e., avoiding to introduce any noticeable change in the observable users’ behavior). To do so, the fraudster builds an approximation of the behavioral user’s model and simulates the detection system. In particular, the attacker generates transactions similar to the target user’s ones and verify if the malicious sequence is accepted by the detection system as a normal behavior (e.g., the sequence of malicious transactions must not trigger any detection system’s thresholds). Note that, checking all these options require a lot of effort for the attacker.
Another challenge from the attacker point of view is represented by the fact that he or she needs to inject malicious sequences in parallel to the legitimate user’s activity without being noticed in the short term. This is done by the “automatic transfer functionality” implemented by banking Trojan: they stop user’s activity (e.g., with a fake error message, unexpected operation’s delay) while executing the attack.
Under the previous assumptions, the attacker is in possessions of the knowledge about the Banksealer’s algorithms and models. With this data, the attacker can approximate users’ behavior and generate fraudulent transactions to trick the anti-fraud framework and silently commit frauds. However, the job of the fraudster is further complicated by the fact that he or she must observe the victim for a timespan sufficient to gain enough information to build a significant approximation of both user’s local and temporal profiles and forge adversary transactions that do not trigger any alert. In fact, as shown in Section 4, Banksealer computes the anomaly of a transaction using the HBOS for the local profile (see Section 4.1) and a series of thresholds for the temporal profile (see Section 4.3).
6.1.1 Mimicry attack Design.We can now formalize the mimicry attack as a problem of
op-erational research. To correctly design this attack, it is necessary to define thevariablesunder analysis, theobjective function, and theconstraintsto which the problem is subjected.
The goal of the mimicry attack is to generate, for each targeted user, stealthy malicious transac-tions. As shown in Table 2, a transactiontis characterized by a set of features that depends on the profile (i.e., local or temporal profile).
The local profile is based on the following categories2of features:
• Amount
• Timestamp
• IBANthat refers to the IBAN of the malicious recipient (e.g., usually a money mule)
• IP AddressandASNthat belongs to the customer target of the attack.
Hence, a transactiontcan be expressed as:
t=f(Amount,Timestamp,IBAN,IP,ASN) (4) However, the variables that an attacker can control to forge adversary transactions are limited to theAmountand theTimestamp, since the other attributes have predetermined values (i.e. the
IBANrefers to the malicious recipient, theIP Addressand theASNbelongs to the victim customer). Therefore, a transactiontis defined as:
t=f(Amount,Timestamp) (5)
From the point of view of the risk score, the local profile computes the riskRISK(t)of a transaction t of being fraudulent by multiplying the anomaly scoreHBOS(t)with the transaction amount 2For simplicity, in this formalization we are using only the categories of features. For the full list of features see Section 4.
Amount(t), as shown in Equation 6.
RISK(t)=Amount(t) ·HBOS(t) (6)
To remain undetected, the attacker must generate adversary transactions that will produce a “low” risk score when analyzed (i.e., transactions are placed in the lower part of Banksealer’s ranking). Hence, the mimicry attack will be subject to the following constraint:
RISK(t) ≤Tarдet_Risk_V alue (7)
whereTarдet_Risk_V alueis the value of the risk scoreRISK(t)in the transaction ranking below which the attacker wants to hide and to inject fraudulent transactions.
The temporal profile is based on the following features: • cumulative amountÍAmount(t)
• number of monthly transactions • number of daily transactions
As shown in Equation 8, for each featuref, it computes its meanµf and standard deviationσf, and sets a thresholdThresholdf at “mean plus the standard deviation” to classify transactions as anomalous when the threshold is exceeded.
Thresholdf =µf +σf (8)
In the light of the fact that the mimicry attack wants to cloak its frauds, it will hide malicious transactions below this threshold and, in particular, under the hypothesis of maximizing the amount of money stolen, in the “delta” between the mean and the standard deviation. In other words, the mimicry attack will be subject to the following constraints:
0≤ÕAmount(t) ≤Thresholdamount (9)
0≤number_of_daily_transactions ≤ThresholdDailyT r ansactions (10) 0≤number_of_monthly_transactions ≤ThresholdMonthlyT r ansactions (11) Now, the attacker has all the elements to formalize the mimicry attack against Banksealer as an optimization problem (see Definition 6.1).
Definition 6.1 (Mimicry attack). A mimicry attack can be defined as the problem of generating a
sequenceMof malicious transactionstexpressed in terms of thevariablesAmountandTimestamp: M=
t|t =f(Amount,Timestamp) ∧ t ∈mimicry_transactions (12) with the goal ofmaximizingtheobjective function:
objective_f unction=Õ
t∈M
Amount(t) (13)
under the followingconstraints:
RISK(t ∈M) ≤Tarдet_Risk_V alue (14)
0≤Õ
t∈M
Amount(t ∈M) ≤Thresholdamount (15)
0≤number_of_daily_mimicry_transactions ≤ThresholdDailyT r ansactions (16) 0≤number_of_monthly_mimicry_transactions ≤ThresholdMonthlyT r ansactions (17)
Table 2. Number of transactions and customers for each context.
Dataset Users Transactions Bank Transfers 92,653 718,927 Phone recharges 29,298 100,688 Prepaid Cards 16,814 71,362
In other word, the mimicry attack aims to maximize the amount of money stolen in time, keeping into consideration the constraints due to the behavioral models of each user (i.e., the local and the temporal anomaly score of malicious transactions must be kept low).
To solve our optimization problem, we formalized it with the “AMPL modeling language”3. As solver we used the “IBM CPLEX solver”4thakt exploits the well known simplex method to solve optimization problems.
7 EXPERIMENTAL EVALUATION: MODEL GRANULARITY AND SECURITY
ANALYSIS
This experimental evaluation aims to (1) compare the user-centric approach against the system-centric approach, in terms of detection performance, and (2) to measure the effectiveness of Banksealer against mimicry attacks.
7.1 Dataset description
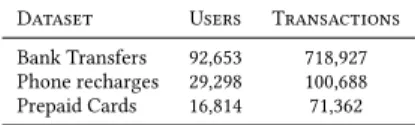
The dataset contains transactions from a large national bank, collected between December 2012 and August 2013. It was anonymized by removing personally identifiable information, and substituting it with randomly-generated unique values to ensure our analysis could still link values that happened to be equal. The data contains customer transactions related to Bank transfers(i.e., money transfers from any account of the bank to any other account),Prepaid cards(i.e., transactions to top up credit on prepaid cards),Phone Recharges(i.e., transaction to refill prepaid cellphone accounts). Table 2 summarizes the number of transactions and customers involved.
7.2 Evaluation Approach and Metrics
We split the preprocessed dataset, described in Section 7.1, following theholdoutmethod, using seven months for building the profiles and the last month, plus synthetic injected transactions (belonging to fraudulent scenarios or to the mimicry attack), for the detection performance analysis. Banksealer works by assigning an anomaly score to each transaction (or user) and by ranking the couple<transaction|user,score >in descending order. Hence, the detection performance is evaluated from this ranking as support for the bank analyst to extract the topN% of the ranking. The value ofN is chosen according to bank analyst workforce, but from our information, the team of analysts is able to analyze around 1-5% of transactions (or users).
After training, we randomly select users and inject (blindly to the systems under analysis)N% synthetically-generated frauds distributed into their transactions belonging to the testing data. Then, we use the system under analysis to analyze the testing data and to rank transactions (or users). As said before, to evaluate the detection performance, we consider the topN% transactions (or users) in the ranking. We perform these operations for each threat scenario described in Section 7.3). Moreover, we repeat the test 30 times and average the results to avoid statistical artifacts due to the injection pattern of frauds to random users (i.e., the transactioni ranking is deterministic, but the the ingjection of frauds is random at each iteration).
3https://www.ampl.com/REFS/amplmod.pdf
Metrics.Under these assumptions and considering the top N% transactions (or users) in the ranking, a True Positive (TP) is a fraudulent transaction (or defrauded user) correctly ranked as fraud (defrauded), False Positive (FP) is a legitimate transaction (or user) wrongly ranked as fraud (defrauded), a False Negative (FN) is a fraudulent transaction (or defrauded user) wrongly ranked as legitimate, and a True Negative (TN) is a legitimate transaction (or user) correctly ranked as non- anomalous.
Then, we compute the well-known evaluation metrics of:
• True Positive Rate (TPR)orRecallthat computes the percentage of correctly identified frauds
(or defrauded users):T PR=T PT P+F N.
• False Positive Rate (FPR)that computes the percentage of legitimate transactions (or users)
that are wrongly identified as fraud:FPR=T NF P+F P.
• Accuracy that measures the percentage of transactions correctly classified by the
rank-ing (a fraudulent transaction as fraud and a legitimate transaction as legitimate):ACC =
T N+T P T N+F P+F N+T P.
• Precisionthat is the proportion of TP over the transactions ranked as frauds:Precision =
T P T P+F P.
• Matthews Correlation Coefficient (MCC)that measures the quality of the detection rate in
terms of the correlation coefficient between the observed and predicted classifications (ranking); a coefficient of+1 represents a perfect ranking, 0 no better than random pre-diction and−1 indicates total disagreement between prediction and observation: MCC=
T P·T N−F P·F N √
(T P+F P)(T P+F N)(T N+F P)(T N+F N).
• F1-scorethat measures the harmonic mean between the Recall and the Precision:F1scor e =
2·Pr ecisionPr ecision+·RecallRecall.
The last two metrics are particularly useful in classification problem with unbalanced classes, like ours.
Finally, we graphically represent Banksealer performances with the Receiver Operating Charac-teristic (ROC) that express the ratio between the TPR and the FPR.
It is important to highlight that these metrics and evaluation, besides giving an index of the detection performance, allow us to indirectly evaluate Banksealer from the point of view of the cost of challenging frauds and amount of funds protected from defrauding attempts. In fact, while the cost of a FP is the time spent by the analyst in the verification process, the cost of a FN is the stolen amount and the loss of trust in the financial institution. Hence, a high TPR associated to a low FPR guarantees that the system under analysis is correctly ranking frauds while reducing the rate of “false” alarms, which directly impacts the banking analyst activity and the amount of founds defrauded (i.e., TN). Finally, by limiting the analysis to the topNpositions in the ranking, we are putting a cap on the costs of challenging frauds (i.e., cost of banking experts and systems).
7.3 Model Granularity Analysis: User-centric vs System-centric Experiment
The evaluation and comparison of the system-centric and user-centric approaches is particularly difficult because no frauds were known or reported at the bank. Therefore, we relied on domain experts (bank operators) to enrich our testing dataset with generated frauds based on three fraud scenarios that, based on their experience, well replicate the typical real attacks performed against banking users.
Fraud Scenarios.We focus on the most important and challenging fraud schemes nowadays, those driven by banking Trojans (e.g., ZeuS, Citadel):
Table 3. Amount transferred for each dataset and fraudulent scenario.
Fraud scenario Amount transferred (e)
Bank transfers Phone recharges Prepaid cards
1: Information Stealing 10,000–50,000 250–255 750–1,000
2: Transaction Hijacking 10,000–50,000 250–255 750–1,000
3: Stealthy Fraud
very low amount 50–100 5–10 50–100 low amount 100–500 10–25 100–250 medium amount 500–1,000 25–50 250–500
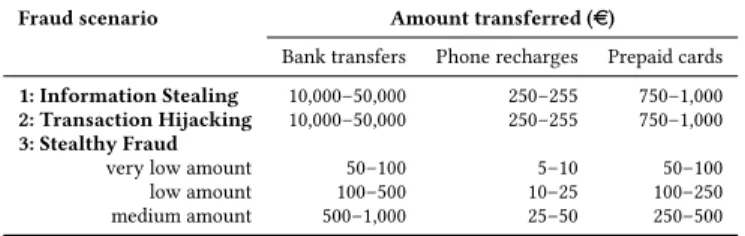
• Fraud Scenario 1: Info stealing.The Trojan modifies the login form to deceive the victim into
entering a one-time password (OTP) along with the login credentials. This information is used by the fraudster to execute a transaction (with a high amount) towards his account, where the victim never sent money to. We test both the case of the connection coming from a national and foreign IP address. To inject the fraud, we randomly choose a victim from the testing dataset and used a random timestamp for the transaction.
• Fraud Scenario 2: Transaction Hijacking.The Trojan, not the fraudster, hijacks a legitimate
bank transfer by manipulating the victim’s browser. The challenge is that the connection comes from the victim’s computer and IP address. Moreover, we execute the fraudulent transaction within ten minutes from a real one, to emulate a session hijacking.
• Fraud Scenario 3: Stealthy Fraud.The strategy of the fraudster is to execute a series of
low-medium amount transactions, repeated daily for one month during working hours, to better blend in. We analyze three cases (very low, low and medium daily amounts). We use the same number of users of the previous scenarios, each performing 30 fraudulent transaction.
• Mixed Fraud Scenarios: Information stealing and Transaction Hijacking.In addition to
consid-ering each scenario independently, we evaluate the proposed solutions with respect to frauds evenly generated from the first two scenarios to provide a more realistic analysis and to give an empirical evidence of the feasibility of our approach.
For the bank transfers dataset, the money can be transferred to a national or foreign account, whereas for the phone recharges and prepaid debit cards the money is charged on an unknown card. Table 3 shows the features’ values of injected frauds.
7.3.1 Model Granularity Analysis Results.
In this section we present the results of the granularity analysis. In particular, we injected the 1% of fraudulent transactions. For the evaluation, we considered the top 1% transactions (or users) in the final ranking from those classified as anomalous. We show the results for the bank transfers context only for brevity, but similar results were obtained for the other contexts (i.e., prepaid cards and phone recharges).
Theoverall resultsare summarized in Figure 4 and Figure 5. The user-centric approach outper-forms the system-centric approach in almost all the fraud scenarios under analysis, confirming its power in the banking fraud detection context.
From the ROC curves presented in Figure 4a and Figure 4a, it can be seen that both approaches show similar trends in the first part of the curves (i.e., high TPR and low FPR), but diverge progres-sively as the number of ranked transactions grows, leading the user-centric’s curves to dominate the system-centric’s ones. While forScenario 1the performance of the system-centric and the user-centric approaches are comparable, since the injected frauds are inherently globally anomalous, this is not true forScenario 2and even more forScenario 3. In fact, system-centric approach in
0.0 0.2 0.4 0.6 0.8 1.0 FPR(n) 0.0 0.2 0.4 0.6 0.8 1.0 TPR(n) ROC curves 1_L 2_L 3_L mix_L 1_UT 2_UT 3_UT mix_UT 1_T 2_T 3_T mix_T
(a) ROC curve
0 10000 20000 30000 40000 50000 60000 N 0.0 0.2 0.4 0.6 0.8 1.0 Recall Recall 1_L 2_L 3_L mix_L 1_UT 2_UT 3_UT mix_UT 1_T 2_T 3_T mix_T (b) Recall 0 10000 20000 30000 40000 50000 60000 N 0.0 0.2 0.4 0.6 0.8 1.0 Precision Precision 1_L 2_L 3_L mix_L 1_UT 2_UT 3_UT mix_UT 1_T 2_T 3_T mix_T (c) Precision 0 10000 20000 30000 40000 50000 60000 N 0.0 0.2 0.4 0.6 0.8 1.0 Accuracy Accuracy 1_L 2_L 3_L mix_L 1_UT 2_UT 3_UT mix_UT 1_T 2_T 3_T mix_T (d) Accuracy 0 10000 20000 30000 40000 50000 60000 N 0.0 0.2 0.4 0.6 0.8 1.0 f1 f1 1_L 2_L 3_L mix_L 1_UT 2_UT 3_UT mix_UT 1_T 2_T 3_T mix_T (e) F-measure 0 10000 20000 30000 40000 50000 60000 N 0.0 0.2 0.4 0.6 0.8 1.0 mcc mcc 1_L 2_L 3_L mix_L 1_UT 2_UT 3_UT mix_UT 1_T 2_T 3_T mix_T
(f) Matthews Correlation Coefficient Fig. 4. Model granularity analysis: performance of theuser-centric approachvaryingN, the number of transactions ranked as fraudulent, and for each of the fraudulent scenarios. The label “UT” means “with undertrained users”, “L” and “T” refers to the local and temporal profiles, respectively. Labels “1”,“2”,“3”, and “mix” refers to the fraudulent “scenario 1 Info stealing”, “scenario 2 Transaction Hijacking”, “scenario 3
0.0 0.2 0.4 0.6 0.8 1.0 FPR(n) 0.0 0.2 0.4 0.6 0.8 1.0 TPR(n) ROC curves 1_L 2_L 3_L mix_L
(a) ROC curve
0 10000 20000 30000 40000 50000 60000 70000 N 0.0 0.2 0.4 0.6 0.8 1.0 Recall Recall 1_L 2_L 3_L mix_L (b) Recall 0 10000 20000 30000 40000 50000 60000 70000 N 0.0 0.2 0.4 0.6 0.8 1.0 Precision Precision 1_L 2_L 3_L mix_L (c) Precision 0 10000 20000 30000 40000 50000 60000 70000 N 0.0 0.2 0.4 0.6 0.8 1.0 Accuracy Accuracy 1_L 2_L 3_L mix_L (d) Accuracy 0 10000 20000 30000 40000 50000 60000 70000 N 0.0 0.2 0.4 0.6 0.8 1.0 f1 f1 1_L 2_L 3_L mix_L (e) F-measure 0 10000 20000 30000 40000 50000 60000 70000 N 0.0 0.2 0.4 0.6 0.8 1.0 mcc mcc 1_L 2_L 3_L mix_L
(f) Matthews Correlation Coefficient Fig. 5. Model granularity analysis: performance of thesystem-centric approachvaryingN, the number of transactions ranked as fraudulent, and for each of the fraudulent scenarios. The label “L” refers to the local profile. Labels “1”,“2”,“3”, and “mix” refers to the fraudulent “scenario 1 Info stealing”, “scenario 2 -Transaction Hijacking”, “scenario 3 - Stealthy Fraud”, and “mixed scenario”, respectively.
these two scenarios cannot easily distinguish between legitimate and fraudulent transactions due to their similarity. For these reasons, the system-centric’s curves (and performance) are much lower the user-centric’s ones. These results are also confirmed by the graph shown in Figure 4b, which shows the Recall varying the number of transactions ranked as fraudulent.
However, it is interesting to observe that the performances of the system-centric approach are comparable (except for Scenario 3where system-centric approach has the worst overall performances) with the one of the user-centric approach under the influence of undertrained users. Sometimes, the system-centric approach is even better the user-centric approach, considering undertrained users. This is easy explainable since system-centric approach does not make distinction between users and consider the global behavior of users, in a similar way of what the undertraining management in the user-centric approach does.
The system-centric approach has also a lower overall precision (see Figure 4c) in all scenarios under analysis. In other terms, frauds are more scattered in the ranking and, hence, it would require the analyst more time to analyze them.
From Figure 4f) and Figure 5f), it can be observed that both system-centric and user-centric approach have a positive MCC and, hence, a positive correlation between the observed (i.e., injected frauds) and predicted classification (i.e., transactions ranked as frauds). Coherently with previous metrics, system-centric’s MCC is lower the user-centric’s one in all the considered scenarios. These findings are confirmed by Figure 4e) and 5e) that show the trend of the F-measure varying the number of transactions ranked as frauds. Consequently, both metrics confirm that user-centric approach is able to better detect frauds.
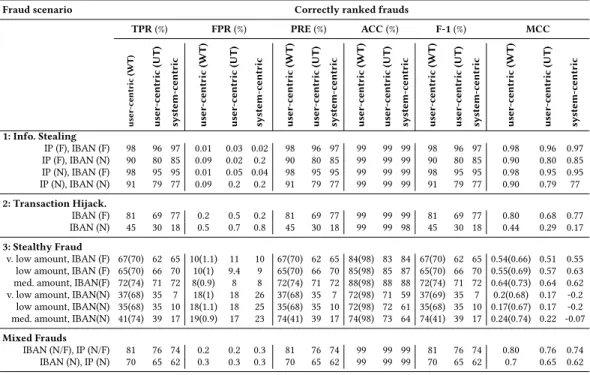
Table 4 summarizes the performance comparison between the user-centric approach (for well-trained users only and with underwell-trained users) and the system-centric approach, analyzing the top 1 % of the ranking (see Section 7.2 for further detail on the evaluation approach). In particular, it confirms the the better detection capabilities of the user-centric approach with respect to the system-centric.
The results on the information stealing scenario (Scenario 1) are very promising and both the user-centric and system-centric reach high performance. In fact, while the user-centric approach reaches a TPR up to 98% with a FPR of 0.01%, a precision of 98%, a F-1 measure of 98%, and a MCC of 0.98, the system-centric approach reaches a TPR of 97% with a FPR of 0.02, with a precision of 97%, a F-1 measure of 97%, and a MCC of 0.97.
Transaction hijacking frauds (Scenario 2) are particularly challenging, because the malware does not alter the overall amount of transactions performed but it leverages existing transactions by diverting them to a different recipient. The IP address is one of those usually used by the user and, in the case where the recipient fraudulent account is national, these transactions blend in quite easily. In fact, while the user-centric approach reaches a TPR up to 81% with a FPR of 0.2&, with a precision of 81%, a F-1 measure of 81%, and a MCC of 0.80, the system-centric approach reaches a TPR up to 77% with a FPR of 0.2, with a precision of 77%, a F-1 measure of 77%, and a MCC of 0.77. However, in case of national IBAN addresses, both performance drastically drop, especially for the system-centric approach. In particular, user-centric’s TPR goes down to 45% (FPR=0.5%) and system-centric’s TPR down to 18%(FPR=0.8%).
Stealthy frauds (Scenario 3) are also challenging: the user-centric and system-centric approaches perform well when the recipient account is foreign, with a TPR up to 72% with a FPR of 8%, a precision of 72%, a F-1 measure of 72%, and a MCC of 0.62, for both. When the recipient is national the performance is halved for the user-centric approach and reduced to a seventh for system-centric approach.
In general, it can be observed that when frauds contain attribute with foreign value (i.e., different from national) the system-centric performances are almost equivalent to the user-centric with