Volume 32
Number 446
Effects of the USDA corn storage
program on corn carryover stocks and corn utilization
Article 1
January 1957
Effects of the USDA corn storage program on corn
carryover stocks and corn utilization
Geoffrey Shepherd
Iowa State College
Allen Richards
Iowa State College
Follow this and additional works at:
http://lib.dr.iastate.edu/researchbulletin
Part of the
Agricultural Economics Commons
, and the
Agronomy and Crop Sciences Commons
This Article is brought to you for free and open access by the Iowa Agricultural and Home Economics Experiment Station Publications at Iowa State University Digital Repository. It has been accepted for inclusion in Research Bulletin (Iowa Agriculture and Home Economics Experiment Station) by an authorized editor of Iowa State University Digital Repository. For more information, please [email protected].
Recommended Citation
Shepherd, Geoffrey and Richards, Allen (1957) "Effects of the USDA corn storage program on corn carryover stocks and corn utilization,"Research Bulletin (Iowa Agriculture and Home Economics Experiment Station): Vol. 32 : No. 446 , Article 1. Available at:http://lib.dr.iastate.edu/researchbulletin/vol32/iss446/1
NORTH CENTRAL REGIONAL PUBLICATION NO. 77
EFFECTS OF THE USDA CORN STORAGE PROGRAM ON
CORN CARRYO.VER STOCKS AND CORN UTILIZATION
Agricultural Experiment Stations of
Illinois Minnesota Indiana Iowa Kansas Kentucky Michigan Missouri Nebraska North Dako"ta Ohio South Dakota Wisconsin
and United States Department of Agriculture cooperating
RESEARCH BULLETIN 446 JANUARY, 1957
BY GEOFFREY SHEPHERD AND ALLEN RICHARDS
IOWA AGRICULTURAL EXPERIMENT STATION
FOREWORD Agricultural policies affecting farm prices and
incomes as well as programs to implement these policies are subjects of great concern to farmers and also to the general public. The issues involved are controversial and subject to lively debate. Many statements, papers and publications have dealt with these issues. All too often these have been based on subjective opinions, prejudices and emotions, with little regard for basic facts and reI a tionshi ps.
Agricultural policy, as a subject-matter area, is amenable to research. Policy research is re-lated to, and depends in part on, research in such areas as price analysis, farm management and agricultural adjustments. However, the purposes and orientation of policy research are different.
In 1952 the directors of the agricultural experi-ment stations in the North Central Region took action to initiate regional research in this im-portant subject-matter area. A technical commit-tee consisting of a representative from each agri-cultural experiment station in the North Central Region was organized. A program of research was developed which, in its initial phases, was to investigate policies and programs affecting com-modities important to the region. These included wheat, dairy products, corn, hogs, beef cattle and poultry products.
This publication is the first regional bulletin to be published from this project. It has been
de-veloped through a subcommittee in charge of the corn policy subproject consisting of the repre-sentatives from the states of Iowa, Illinois, Indi-ana and Missouri. Additional regional bulletins are expected to be published as the work of the technical committee progresses.
The following persons have served on the tech-nical committee:
E. J. Working, Illinois *Vincent 1. West, Illinois *J. C. Bottum, Indiana *Geoffrey S. Shepherd, Iowa
George Montgomery, Kansas James O. Bray, Kansas Bernard J. Bowlen, Kansas, Dale C. Hathaway, Michigan Willard W. Cochrane, Minnesota *0. R. Johnson, Missouri
Clyde Mitchell, Nebraska Don Kanel, Nebraska
Ranier Schickele, North Dakota Perry V. Hemphill, North Dakota Mervin G. Smith, Ohio
Max Myers, South ,Dakota Richard Newberg, South Dakota H. W. Halvorson, Wisconsin
C. PEAIRS WILSON
Administrative Adviser ·Members of subcommittee for Subproject No.3. Corn.
PREFACE This is the first report from the corn
subcom-mittee of the North Central Regional Research Committee on Agricultural Price Policy, under project NCM-11.
Research men are naturally inclined to work their data over with meticulous care and delay publication until all their results can be shown in relation to each other in a comprehensive re-port. The subcommittee believes, however, that this is not the best way to proceed with the corn study and get the results of the research out into public use. The corn program is so big and di-verse that it has to be broken down into manage-able parts for analysis. The results of these analyses can then be published in a series of studies, each one dealing with a limited part of the field and published as soon as it is ready.
Accordingly, we are planning to conduct the study a step at a time and to publish the results of the research on the effects of the USDA corn program on producers, marketing agencies and consumers, in a series of separate reports, each report dealing with one part of the whole study. Each one of these reports will be published when it is ready, while the work on the later topics is still proceeding. Each report, therefore, will be
a progress report, subject to reVISIOn if subse-quent work shows that this is necessary.
The preliminary titles of this prospective series of reports are listed below. The present report is the first of the series.
1. Effects of the corn storage program on corn carryover stocks and corn utilization.
2. Effects of the corn storage program on corn prices and livestock production.
3. Effects of the corn acreage control program on corn and other feeds production.
4. Effects of the corn program on producer's and distributor's incomes and consumers' satis-faction.
5. Effects of the corn program on grain dis-tributors and processors.
A final report will be published eventually, re-vising and summarizing these progress reports and pulling them together in a comprehensive rep'ort covering the corn program as a whole, including a discussion of the estimated effects of alternative programs.
CONTENTS
Page Foreword __________________________________________________________________________________________________________ 962 Preface ____________________________________________________________________________________________________________ 962 Summary __________________________________________________________________________________________________________ 964 The stabilization problem ______________________________________________________________________________ 965 Variations in corn and other feeds production ____________________________________ 965 Objectives of the stabilization program ______________________________________________ 967 The Commodity Credit Corporation ____________________________________________________ 967 Operations of the CCC __________________________________________________________________________ 968 Level of loan rates ________________________________________________________________________________ 969 World War II and afterwards ______________________________________________________________ 970 Costs of the corn program ____________________________________________________________________________ 971 Realized cost of the corn program ______________________________________________________ 971 Cost of the corn storage program ______________________________________________________ 972 Effects of the corn program on year-end stocks ________________________________________ 974 What determines how much corn goes under loan L ________________________________ 975 What determines the size of the Oct. 1 CCC corn inventoryL ______ 976 Effects of the corn program on the location of corn stocks ____________________ 977 The geographical distribution of CCC stocks of corn ______________________ 978 Effects of the corn program on corn consumption __________________________________ 980 Size of storage stocks needed for stabilization purposes ________________________ 981 USDA estimate of stabilization stocks required ______________________________ 983 Variations in demand ____________________________________________________________________________ 984 Complete stabilization? ________________________________________________________________________ 985 Maintaining I-billion-bushel stocks ______________________________________________________ 986
SUMMARY
This report analyzes the effects of the USDA stabilization program on corn year-end carryover stocks and corn utilization. It also presents data on the cost of the program to the USDA.
The objectives of the program were to stabilize corn and other feed grain utilization and prices and to raise the long-run level of those prices. In pursuit of these objectives, a program of non-recourse loans to farmers on corn sealed in cribs on their farms was undertaken, supplemented later by provisions for purchase agreements and loans stored in commercial warehouses. This stabilization program was backed up' in some years by acreage control programs designed to reduce corn production.
The "total realized cost" of the corn price and production programs to the USDA from 1932 to 1955 was $1.3 billion. Most of this consisted of payments under the acreage control program; the cost of the
eee
price-support storage operations was only $227 million. Most of this cost was in-curred in fiscal 1954 and 1955, when storage stocks were larger than in earlier years. On the basis of the 1955-56 program, it is likely that the cost ofeee
corn storage operations in the future will run at about $100 million per year. If the soil bank program is effective in reducing corn production, that may reduce the size of the stocks and thus reduce the cost of the storage operations.EFFECTS ON CORN STOCKS
The size of the total year-end (Oct. 1) carry-over stocks of corn has increased carry-over the past 30 years, reaching a peak of 1.2 billion bushels in 1956.
From 80 to 85 percent of these total stocks in 1954 and 1955 were owned or under loan by the
eee.
The quantity of corn in private hands in recent years has been declining slightly. The largeeee
holdings in the main are in addition to private holdings; only to a minor extent are they a displacement .of private holdings.The year-end storage stocks of corn on farms have been somewhat more concentrated in Iowa and, to a lesser extent, in the adjacent states. From the first, the
eee
stocks were more heavily concentrated in Iowa and adjacent states than the farm stocks; the concentration ofeee
stocks in Iowa has increased somewhat with the passage of time.The chief factor determining the quantity of corn put under loan is the relation between the market price of corn and the corn loan rate and the size of the corn crop. The lower the market price compared with the loan rate, the more corn goes under loan. The correlation between the total supply of corn Oct. 1 and the quantity of corn put under loan is positive, but it is rather
low. The size of the corn crop is another factor that has some positive influence. The percentage of compliance may be another.
EFFECTS ON CORN UTILIZATION
The
eee
year-end carryover stocks are large at the end of a large crop year and small at the end of a small crop year. They thus absorb part of the variations in production; the year-to-year variations in corn utilization (consumption) are about half as great as the year-to-year variations in production. Theeee
storage program appears to have stabilized corn supplies (corn utilization) about 50 percent.SIZE OF STORAGE STOCKS NEEDED FOR STABILIZATION PURPOSES
On a purely physical basis, stabilization (year-end carryover) stocks of about 1.1 billion bushels would be needed to stabilize the market supplies of corn completely against year-to-year variations in corn utilization.
Variations in the demand for corn are more difficult to cope with, since they usually vary over longer and less predictable periods of time than year-to-year variations in production. But if it is deemed desirable to use storage operations to meet variations in demand for corn with corre-sponding variations in market supplies, during the first year before corn production has time to respond to an increase in demand, additional stocks of perhaps 400 million bushels might be sufficient for this purpose. The total stocks then would be 1.5 billion bushels.
Under the existing loan program, complete stabilization of corn consumption is not likely to be attained, because there is some flexibility in the loan rates and because corn prices decline some distance below the loan rates before farmers put much corn under loan and let the
eee
take it over. In actual practice, storage stocks are not likely to reach the 1.5 billion figure needed for complete stabilization. The size of stocks actually attained is more likely to be about 1 billion bushels.The Agricultural Act of 1949 set up a table of loan rates that varied inversely but less than proportionally with total corn supplies (produc-tion plus stocks). This provided some automatic safeguard against storage stocks becoming larger than needed for stabilization purposes. A still more effective safeguard against stocks becoming too small as well as too large might be provided if the loan rates were constant when total supplies ranged from 3.6 to 4.2 billion bushels, but varied inversely and proportionately with total supplies above and below that range.
Effects of the USDA Corn Storage Program on
Corn Carryover Stocks and Corn Utilization
BY GEOFFREY SHEPHERD AND ALLEN RICHARDS
Free market prices for farm products were the regulators of agricultural production and con-sumption in the United States until about the end of the 1920's. They did their work impersonally and, in the main, effectively. The prices of farm products fluctuated widely from season to season, from year to year and from peak to trough of industrial activity, but they generally cleared the market. Through thick and thin-large crops and small crops, strong demand and weak demand -farm products kept moving through from pro-ducer to consumer under the guiding influence of varying free market prices.
But this performed only one part of the func-tion of prices. Variafunc-tions in prices were wide and rapid enough to keep farm products moving into consumption in quantities that were in line with production, but they were too wide and rapid and erratic to perform their second function well-to serve as reliable guides well-to producers. In addi-tion, prices exercised another one of their func-tions-allocation of income to producers-with undue harshness because of the inelasticity of the supply responses of agricultural producers.
In a period of strong demand, for example, high prices would stimulate increased seeding, breed-ing and feedbreed-ing; yet, in many cases, by the time the product arrived at the market, demand had weakened and prices had fallen. Variations in supply were similarly erratic. Sometimes the weather would be good, and crops would be large; at other times, bad weather might cut the size of the crop in half. Sometimes a period of bumper crops would coincide with a period of weak de-mand, and vice versa.
These variations in prices regulated the flow of farm products to consumers, but they were confusing to producers. Farmers could not plan their production programs accurately, nor tell beforehand how they were going to come out on their operations by the end of the year. Some stock producers tried to maintain the same live-stock program year in and year out, leaving a margin of safety for protection against unpredict-able fluctuations in prices. Others-"inner and outer's"-tried to guess what changes were coming and often guessed wrong. Sometimes large crops were produced when small crops were
wanted,and vice versa. Free market prices were unable to keep the production of agricultural products constant from year to year when the demand was constant, nor changing in the right direction and the right amounts when the demand changed.
The variations in prices that result chiefly from variations in general demand are well reflected in fig. 1, which shows the prices received and prices paid by farmers from 1910 to date.
VARIATIONS IN CORN AND OTHER FEEDS PRODUCTION
The variations in prices that result from vari-ations in supply differ from crop to crop. This report deals primarily with corn and the other feed crops.
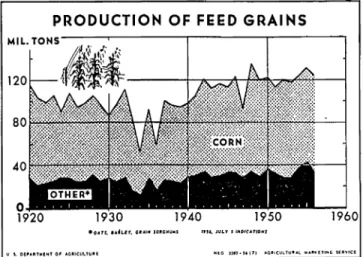
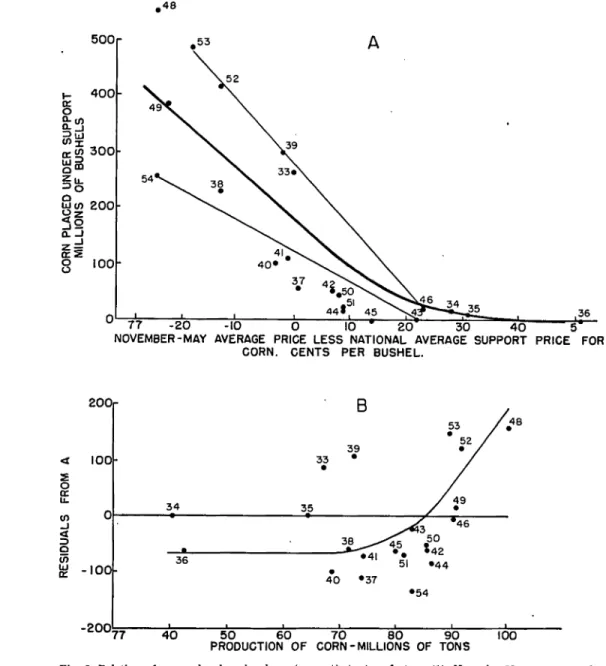
The nature and extent of the variations in the production of corn and the other feed crops is shown in table 1 and fig. 2.
This table and chart clearly show the over-whelming importance of corn in total feed grain production.
The greatest change in corn production from one year to the next took place from 1947 to 1948, when production increased more than 1.3 billion
.FARMERS' PRICES % OF 1910.14 , , , , , - 300r---4~---_+---200 f - - - - . , / 1 100~~~-_4~----4\ 1940 1950 • IoiON,HtJ OJ.t4
·'NClUO!S U"rUEST. run. ANO WACf ""HS. A~NUAt AV OArA, 1910.21 1
.., QUAlH'S. IU~ 16, IF MONTHS, lUI TO o"lt
0. S. blE'''"TltIlfHT OF AIItICULTURE NEG. U.S5 (10) AGIiIII::ULTUAJ.1. .... "":ETING SERVICE Fig. 1. Prices received and prices paid by farmers in the United States
1910-56. The lower section of the chart .howe the percentalfe!l that prices received were of parity prices.
TABLE 1. FEED GRAINS: PRODUCTION, UNITED STATES, 1920-55.
(million tons)
Year Corn· Oats Barley All
~orghum for grain 1920 ... 85.9 23.1 I 4.1 2.5 1921. ... 81.9 16.7 3.1 2.0 1922 ... 75.8 18.3 3.6 1.4 1923 ... , ... 80.5 10.6 3.8 1.7 1924 ... 62.2 22.5 3.0 1.7 1925 ... 78.3 22.4 4.6 1.6 1926 ... 71.3 18.4 4.0 2.0 1927 ... 73.3 17.5 5.7 2.3 1928 ... 74.6 21.0 7.9 2.2 1929 ... 70.5 17.8 6.7 1.4 1930 ... 58.2 20.4 7.2 1.1 1031. ... 72.1 18.0 4.8 2.0 1932 ... 82.0 20.1 7.2 1.9 1033 ... 67.1 11.8 3.7 1.5 1934. ... 40.6 8.7 2.8 0.5 1935 ... 64.4 19.4 6.9 1.6 1936 ... 42.2 12.7 3.5 0.8 1937 ... 74.0 18.8 5.3 2.0 1938 ... 71.4 17.4 6.1 1.9 1939 ... 72.3 15.3 6.7 1.5 1940 ... 68.8 10.9 7.5 2.4 1941. ... 74.3 18.9 8.7 3.2 1942 ... 85.9 21.5 10.3 3.1 1943 ... 83 0 18.2 7.8 3.1 1944 ... 86.5 18.4 6.6 5.2 19~5 ... 80.3 24.4 6.4 2.7 1946 ... PO. 1 23.6 6.3 3.0 1947 ... 6.'.9 18.8 6.8 2.6 1948 ... 100.9 23.2 7.6 3.7 1949 ... 90.7 19.5 5.7 4.2 1950 ... 86.1 21. 9 7.3 6.5 1951. ... 81.9 20.4 6.2 4.6 1952 ... .... 92.2 19.5 5.5 2 5 1953 ... 99.Q 18.5 5.9 3.2 1954 85.6 22.6 9.1 6.6 1955. : :::::::: ... 90.8 24.0 9.6 6.8 1956t ... 01.5 18.3 8.3 6.0
• Production for all purposes.
t Preliminary. July 1956 estimate.
Source: U. S. Dept. Agr. Grain and feed statistics through 1954. U. S. Dept. Agr. Stat. Bul. 159, March 1955, p. 3; and U. !'. D~t. Agr., Agricultural Marketing Service. The feed sltuatlOn. July 1956, p. 5.
bushels. The variations resulting from the
drouth years of the 1930's were almost as great. "Year-to-year changes in United States corn pro-duction during the past 30 years (1919-1948) averaged 408 million bushels, or about 15 percent of the average production for the period (2,635 million bushels) ."1
1 U. S. Dept. Agr., Bureau of Agricultural Economics. The feed situa-tion. December 1948. p. 11
PRODUCTION OF FEED GRAINS
Fig. 2. Production of corn and other feed grains in the United States, annually, 1920-55.
This quotation understates the variation from a storage point of view. It deals only with dif-ferences in corn production from one year to the next. A corn storage program needs to take into account more than the changes from one year to the next, since corn production occasionally changes in the same direction, or remains high or low, for 2 or 3 consecutive years. A run of two or three crops, each 10 percent above average, would show no change from year to year but ,would build up storage stocks.
The coefficient of variation is a standard meas-ure that more accurately reflects the size of the storage problem. This coefficient of variation of corn production over the 30-year period from 1919 to 1948 was 14.1 percent. This means that, in a normal distribution of sizes of crops, a band ranging from 14.1 percent above average pro-duction to 14.1 percent below average propro-duction - a total range of 28.2 percent-would include 68 percent of the series of corn crops. Also, a range from 14.1XO.67=9.5 percent above and below average production-a total range of 19 percent-would include 50 percent of the series of corn crops.
The production of other feed crops (principally oats) appears in fig. 2 to be less variable than corn. But this appearance is deceptive, resulting from the smaller average size of the crop. Pro-portionally, the coefficient of variation for oats-16.1 percent-is greater than for corn.
The variations in production cause still greater variations in prices. The demand for corn is relatively inelastic; the coefficient of elasticity is about -0.65. A change of 10 percent in produc-tion causes an opposite change of 160
=
15per-O. 5
cent in prices. The price of corn is still more re-sponsive to variations in production of total feed grains. The elasticity in this case is -0.5.2
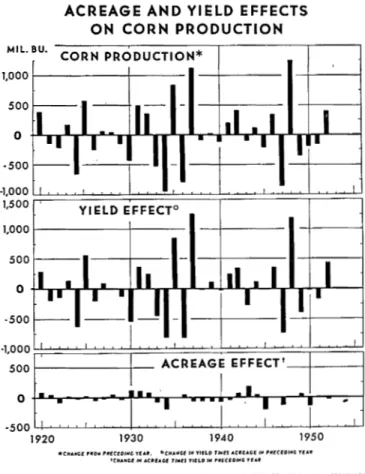
Figure 3 (from Foote et a1.3 ) shows that "the great bulk of year-to-year variation in corn pro-duction is due to variations in yield. Corn acreage is quite stable, rarely changing by more than 3 or 4 percent from one year to the next. Even acreage allotments have not caused sharp reductions in total corn acreage.
"The maximum year-to-year change. in corn production due to an acreage shift has been about 200 million bushels. But yield effects exceeded 1,000 million bushels on two occasions (1936 to 1937, and 1947 to 1948) and exceeded 500 million bushels on nine occasions during the 1901-50 period.
"Variations in corn yields around their normal or trend level are shown in the central section of figure 3. On three occasions during 1901-50, corn yields dropped more than 10 bushels per acre below trend. At present acreage levels, this would mean a production deficit of 800 to 900 million
2 Richard J. Foote, John W. Klein and Malcolm Clough. The demand and price structure for corn and total feed concentrates. U. S. Dept. Agr. Bul 1061. October 1952. pp. 39-40.
Mil. BU.
ACREAGE AND YIELD EFFECTS ON CORN PRODUCTION
CORN PRODUCTION*
1 , 0 0 0 1 +
-*CIf,UiC!' I"UIII ''''CU'JI' 'l'UIt. -CHANGE ,,, VI!!U ,u..ES .'I'UGf '" ,,,£C£OING 1'[A" 'CHIoHC' IN 1oC:.""CIE ".ES r'ELD 'III "'RtefDlJIIIG nAIl'
U. S ta:'"RfNENT 0' AGRICULTURE NEG • .u503·lI!: aUREAu 0' ACiRICULTUUL [CONOIlICS Fig. 3. Effects of changes in corn acreage and corn yield on com
pro-duction, United States, annually, '1920-62.
bushels. On four other occasions, yields were at least 4 bushels below trend, involving production deficits of about 350 to 600 million bushels. There were also five occasions on which corn yields ex-ceeded their trend by at least 4 bushels, involving production excesses (above average) of about 350 to 650 million bushels. In 36 years out of 50, corn yields were within less than 4 bushels of the trend, and corn production was within less than 10 percent (about 300 million bushels) of its trend level." 4
OBJECTIVES OF THE STABILIZATION PROGRAM
The demand that something be done about the instability of the prices of farm products became insistent during the 1920's, when violent varia-tions in demand due to economic causes were added to the violent variations in corn and other feed production due to physical causes. Farmers became very much concerned about the drastic effects on their incomes of the decline in prices that resulted from the decline in demand after World War I. The income-allocating function of prices was more prominent in their minds than the production-guiding function.
After a sharp postwar decline in 1920, agri-4 U S. Dept, Agr. Long range farm program. Technical studies by
the u. S. Department of Agriculture relating to selected farm price support proposals. U. S. Govt. Print. Off., Washington, D. C. 1954. p.41.
cultural prices continued to vary erratically be-low their prewar relation to other prices. Farmers
urged that the USDA go beyond merely reporting supply, demand and the prices; they urged that it take hold of prices, smooth them out (or at least reduce their variability) and raise their level. Farm price legislation to this end was passed twice during the 1920's, but both times it was vetoed by Coolidge. In 1929 under Hoover, the Federal Farm Board was organized with a revolving fund of half a billion dollars-a large sum of money for those times.
The Board immediately proceeded to "take hold of prices." It began stabilization operations in wheat in September 1929, and in cotton in Oc-tober. At first it made loans in an attempt to keep prices at the loan levels; then it began mak-ing direct purchases at the loan levels. Thus it proceeded further than taking hold of prices; it took hold of part of the supply as well.
It could hardly have chosen a worse time. The stock market crashed in October 1929, and the deep and long industrial depression of the 1930's began. During the next 2 years, agricultural prices fell nearly 50 percent. The Federal Farm Board soon committed all of its half-billion-dollar revolving fund and lost its ability to support prices. It was terminated in May 1933.5
The Federal Farm Board not only was born at a bad time but, in addition, it had tried to stabilize the prices of cotton and wheat, two of the most difficult crops to support. Cotton and wheat are both international commodities, and their prices are set by world forces in world markets. Oper-ations in anyone country could not be expected to succeed, any more than an Iowa corn program could be expected to succeed alone in the United States.
THE COMMODITY CREDIT CORPORATION
The Commodity Credit Corporation was organ-ized in October 1933 to stabilize prices by storage operations. The Agricultural Adjustment Ad-ministration was set up in the same year to con-trol production.
The CCC proceeded to do much as the Federal Farm Board had done before it. The CCC im-mediately made loans on cotton and corn, well above open-market levels, and began to accumu-late storage stocks as the Farm Board had done.
The objective of the CCC (or "ever-normal granary," in literary terms) was clearly stated by Henry Wallace, Secretary of Agriculture, in 1937.
"By the ever-normal granary I mean a definite system whereby supplies following years of drouth or other great calamity would be large enough to take care of the consumer, but under which the farmers would not be unduly penalized in years of favorable weather. During the past
Ii For a more extended account and appraisal of the Federal Farm Board operations, see: M. R. Benedict. Farm policies of the United States, 1790-1950. Twentieth Century Fund. 1953. Chs. 12ff; and G. Shepherd. Agricultural price control. Iowa State College Press, Ames, Iowa. 1945. Ch. 8.
7 years, weather, prices, and supplies have swung so violently from one extreme to the other that it is time for all thoughtful men and women, whether living on the farm or in town, to con-sider what· action may be taken to promote greater stability." 0
The objectives of AAA were somewhat less
clearly stated in the next paragraph:
"To keep the government from committing a 'farm board' it will be necessary after supplies under the loan program have reached a certain point to keep the granary from running over by some practical program of production adjust-ment. I call this part of the ever-normal granary program 'storing the grain in the soil' instead of 'storing it in the bin.' After the consumer is adequately taken care of by the building up of certain supplies, it is cheaper for the farmer, consumer, and government alike to store addi-tional quantities in the soil rather than in the bin.
If the weather is going to be unusually violent in its swings, it is necessary for man to be unusually intelligent in meeting the problem. I believe the ever-normal granary is a start." 7
This paragraph calls for "production adjust-ment" to keep the granary from running over. On this basis, the objective of the AAA was simi-lar to the stabilization objective of the CCC. It merely went further and called for "storing the grain in the soil" instead of in the bin, when swings in the weather were unusually violent.
A more recent statement concurs with Wallace's original statement of the objective of the CCC. It is more specific and names storage as a means for attaining greater stability in market supplies and prices.
"A major objective of storage policy in recent years has been to reduce fluctuations in farm prices and smooth out the flow of the main stor-able crops into domestic use and the foreign mar-ket. One of the basic causes of such fluctuations is the variability of crop yields and acreage. Vari-ations in crop yields from year to year are mainly due to factors beyond human control.
"If we do not want such pronounced changes in consumption and exports as occur in crop yields or if we want greater stability in the price struc-ture, a part of the fluctuations in production must be absorbed by storage operations." 8
It is evident from these quotations that the chief stated objective of the CCC storage pro-gram was to reduce the unpredictable year-to-year variations in the market supplies of "the main storable crops" that result from variations in production caused by year-to-year variations in the weather. In the case of corn, the smoothing out of the year-to-year variations in corn supplies was expected to have the further effect of reduc-ing the year-to-year variations in hog production 6 Henry A. Wallace. The agricultural situation. U. S. Dept. Agr.,
Bur. Agr. Econ. March 1, 1937. p. 9. 7 Ibid.
8 Reserve levels for storable farm products, a study of factors. relating to the determination of reserve levels for storable farm products. Senate Document No. 130. 1952. p. 1.
and prices that result from year-to-year varia-tions in corn supplies and prices.
The CCC, however, went further than "mere stabilization." It was impressed with the import-ance of the income-allocating function of prices too. It, therefore, embarked on a policy of raising the level of prices over a period of years, as well as stabilizing them. The Farm Board had said in its last annual report in 1933: "Many people have thought 'stabilization' means to hold the price permanently higher than it would be other-wise. This cannot be done without control of production." The CCC believed that it could profit by the Farm Board's experience; it pro-ceeded to set loan rates "permanently higher than they otherwise would be," but it believed that it would be protected against the fate that
had overtaken the Board, because the AAA would
control production.
The importance of this second objective, raising prices over a period of years, is indicated in the 1940 annual report of the president of the CCC-the first such report to be published. In this re-port, the raising of prices was listed as the first of "the three fundamental functions of the (Com-modity Credit) Corporation's loan programs: Namely, to protect and increase farm prices, to stabilize farm prices, and to assure adequate plies of farm products" (i.e., to stabilize sup-plies).o Thus the CCC relied on the AAA to re-duce crop production below average, not merely as an emergency measure to be used as a last resort if stocks grew too large, but as a continuing feature of the program for raising prices over a period of years.
The second objective of the CCC, therefore, went beyond stabilizing prices. The second ob-jective was to "stabilize them upward" in a whim-sical phrase current at the time. This second objective, in simpler language, was to raise the long-run level of prices as well as to stabilize them. This raising of the long-run level was to be accomplished by AAA acreage controls de-signed to reduce acreage and production and thus support prices above long-run competitive levels.
OPERATIONS OF THE
eee
From October 1933, when the CCC was created, to June 30, 1948, the CCC operated under a Dela-ware charter. Its status as an agency of the United States was granted by statutes expiring at intervals of one or more years. Effective July 1, 1948, the Corporation was granted a Federal charter, making it a permanent agency of the United States. Public Law 344, 84th Congress, approved August 11, 1955, increased the author-ized borrowing power of the Corporation (i.e., the amount outstanding at anyone time) to $12 billion. 10 The CCC thus was able to operate on a scale about 10 times greater than the Farm 9 U. S. Dept. Agr. Report of the President of the Commodity Credit
Corporation. 1940. P. 4.
Board, taking the lower purchasing power of the dollar into account.
The Farm Board, in its stabilization operations for wheat and cotton, had relied mainly on loans to cooperatives and direct purchases in the mar-kets. The CCC operated differently. It made some commodity loans (loans on basic commod-ities produced by farmers) directly to farmers, but in most cases it simply underwrote commodity loans made to farmers by ordinary commercial banks who had entered into agreements with CCC. The loans were nonrecourse loans. If the market price of the crop rose above the loan rate plus interest after the lo~n was made, the farmer could redeem his loan and sell the crop at the higher price. But if the market price remained below the loan rate, the farmer could default on the loan and let the CCC take over the collateral, without re-course on the farmer for the difference between the loan rate and the price. The collateral then became the property of the CCC.ll
11 "Loans made to eligible growers on farm-stored corn are evidenced by a promissory note secured by chattel lien on the corn. Loans on warehoustored corn are evidenced by a promissory note se-cured by the warehouse receipt. These loans may be made by the Corporation direct or by private lending agencies operating under a form of lending agency agreement with the Corporation. The grower may payoff his loan at any time up to the maturity d~te at its face value plus accrued Interest. Loans have been e"tended beyond their maturity dates on several crops, the grower having been given the option of resealing his corn, redeeming It, Or de-livering it to the Corporation in satisfaction of the loan." (U. S. Dept. Agr., Commodity Credit. Corporation. Corn price-support loan operations 1933-1952. Mimeo report. P. 2.)
LEVEL OF LOAN RATES
Up to this point, the present report has dealt with the development of the agricultural stabili-zation program as a whole. From this point on, the rest of the report concentrates primarily on the corn program.
Under the CCC program, loans were made on varying quantities of corn every year from 1933 on. In general, the CCC carried over from one crop year to the next quantities of corn which varied directly with the size of the crop.
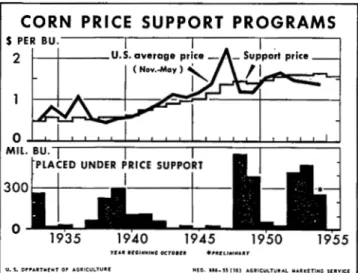
Table 2 and fig. 4 show the loan rates and prices by years from 1933 to date. They also show the quantities placed under price support. Data for oats, barley and grain sorghums are given in table 3.
At first, the loans were made at moderate rates, and the severe drouths of 1934 and 1936 along with general recovery from the depression raised corn prices. Accordingly, from 1933 to 1937 the CCC had no problem of supplies accumulating on its hands. Farmers were well pleased with its operation; there was a natural and pleasant as-sociation in their minds between the CCC's oper-ations and the rise in prices that took place during the first few years of the CCC's life.
By the latter part of 1937, however, the picture suddenly changed. In spite of acreage reductions, high yields of cotton, corn and wheat in 1937 TABLE 2. CORN : AVERAGE PRICE, SUPPORT PRICE AND QUANTITY PLACED UNpER SUPPORT 1933-66.
Placed under price support
Average ):,rire Purchase Percenta~e or
Year beginning October National avera.ge loan rate November-May· Differenoet Loanst agreements Total production (dollars (pereenta~e (dollars (dollars
(rr iIIion bushels) (mil:ion bushels) (million bushels)
per bushel) or parity) per bushel) per bushel) (percent)
1933 ... 0.45 55 0.45 0.00 268 ... 268 11.2 1934 ... 0.55 65 0.83 0.28 20 ... 20 1.4 1935 ... 0.45 55 0.56 0.11 31 ... 31 1.3 1936 ... 0.55 66 1.06 0.51 ... iii 00' ... ... ... iii 00···· I 1937 ... 0.50 59 0.51 0.01 ... 2.3 1938 ... 0.57 70 0.44 -0.13 ... "302'" ... ... 230 9.0 1939 ... 0.67 70 0.55 -0.02 ... 302 11.7 1940 ... 0.61 75 0.58 .... ·{l.03 103 ... 103 4.2 1941. ... 0.75 85 0.74 -0.01 111 ... III 4.2 1942 ... 0.83 85 0.90 0.07 56 ... 56 1.8 1943 ... 0.90 85 1.12 0.22 8 ... 8 0.3 1944 ... 0.98 90 1.07 0.09 21 ... 21 0.7 1945 ... 1.01 90 1.15 0.14 3 ... 3 0.1 1946 ... 1.15 90 1.38 0.23 26 ... itf'" 26 0.8 1947 ... 1.37 90 2.20 0.83 1 1 § 1948 ... 1.44 90 1.20 -0.24 355 106 551 15.3 1949 ... 1.40 90 1.18 -0.22 329 58 387 11.9 1950 ... 1.47 90 1.55 0.08 51 2 54 1.8 1951. ... 1.57 90 1.66 0.09 25 I 26 0.9 1952 ... 1.60 90 1.47 -0.13 309 108 417 12.7 1953 ... 1.60 90 1.42 -0.18 369 102 471 14.8 1954 ... 1.62 90 1.38 -0.24 199 59 258 8.6 1955 ... 1.58 90 1.21U -0.37 338H 27§1 36611 Il.5n 1956 ... 1.50 82 ... ... ... ... ... ...
• Average price received by farmers in period when moet of the corn i. placed under price support. In recent years, loans have heen available from time of harvest through May.
t Average price above or below national avemge loan rate.
:I: Excludes purchase agreement corn placed under loan in the following year during the period 1948 to date.
§ I.es. than 0.05 percent .
•• Includes 14 million bushels of 1937 corn placed under loan for first time in 1938 under short term loan' program.
tt Purchase agreements not available before 1947.
:1::1: Preliminary.
§§ Through April 15, 1956; loan period ends May 31 in most areas. Compiled from reports of Commodity Stabilization Service.
Source of table: U. S. Dept. Agr. Agricultural outlook charts 1956. November 1955. Table 6, P. 68: U. S. Dept. Agr. Grain and feed statistics through 1954. U. S. Dept. Agr. Stat. Bul. 159. Marc:, 1955. Table 48 p. 46; and U. S. Dept. Agr., Agricultural Marketing Service. The feed situation. May 1956. p. 21.
CORN PRICE SUPPORT PROGRAMS
S PER BU.
2
o
U. s. DPp.u:T .. !NT 01' A.CIICULTullil! H[G. ",_u flO) AORICULTUItAL MARkETIHG SERYICE Fig. 4. United States average price of corn. loan rate (support price)
and quantity of corn placed under loan (price support). an. nually, 1933·55.
carried the production of those products well above the average. Supplies increased and the industrial "recession" in the latter part of 1937 reduced the general demand.
The Agricultural Adjustment Act of 1938 in-cluded a formula or schedule under which the loan rate for corn was to vary inversely with the esti-mated total production of corn, below the basic rate of 75 percent of parity. The bottom of the range of loan rates, reached if the total production exceeded normal by more than 25 percent, was 52 percent of parity. During the next 3 years, from 1938 to 1940, the loan rates for corn were set close to the top of the range provided by this schedule. They were set at 70, 69 and 75 percent of parity, respectively.
These loan rates were high enough to cause a rapid increase in the quantities of corn put under price support. Figure 4 shows that the quantities
rose to a record 300 million bushels in 1939. By 1940, the total year-end stocks of corn Oct. 1 rose to a record high at that time of 687 million bushels.
By 1941, the
eee
was heading into the same sort of trouble that had killed the Farm Board. Supplies of corn, cotton and wheat were accumu-lating rapidly. By the fall of 1941, the equivalent of a full crop of cotton, half a crop of wheat and a quarter of a crop of corn had accumulated in storage. Some of the cotton stocks were 7 years old. Grain storage elevators were over-burdened, and embargoes had to be applied at several termi-nal markets. Oneeee
official envisioned a com-plete breakdown of the corn acreage reduction and loan program by the end of 1941, because the loan rates had been set too high and by too arbi-trary a formula, and because the AAA had not been able to reduce production enough to support the loan rates.12WORLD WAR II AND AFTERWARDS
Then the United States entered World War II in December 1941. This changed the situation completely. The insatiable demands of war drew down the accumulated stocks. Surpluses were re-placed by shortages, and rationing and price ceilings were instituted to hold down the demand. The war and postwar boom was followed by a comparatively mild recession. Prices declined and stocks accumulated again, to higher levels this time than they had reached in 1941. But again war rescued the
eee ;
the military activity during the Korean conflict that broke out in 1950 stimu-lated an increase in demand that drew stocks down. The high level of preparedness that seemed essential in the cold war after Korea kept demand at a high level.12 C. F. Sarle. then Director, Research Division. CCC. Private com-munication.
TABLE 8. OATS. BARLEY AND GRAIN SORGHUMS: PRICE SUPPORTS AND QUANTITY PLACED UNDER PRICE SUPPORT, UNITED STATES, 1940·55.* Crop of National average price support per bushel (dollars) Oats Placed under price support t (million bushels) 1940 ... . 1941. ... . 1942 ... . 1943 ... . 1944 ... .. 1945 ... . 1946 ... . 1947 ... · .... . 1948 ... . 1949 ... . 1950 ... . 1951. ... .. 1952 ... .. 1953 ... .. 1954 ... . 1955 ... . 1956 ... . 0.48 0.53 0.63 0.70 0.69 0.71 0.72 0.78 0.80 0.75 0.61 0.59 3 ··· .. 23··· 41 15 13 21 56 75 68
Barley Grain sorghums
-N-at-ion-.l-av-er-ag-e-I---National average price support per bushel (dollars) 0.35 0.45 0.65 0.75 0.85 0.80 0.83 1.03 1.15 1.09 1.10 1.11 1.22 1.24 1.15 0.94 0.93
Placed under price support Placed under price support t per cm. price support t
1---1---(million bushels) (dollars) (million cwt.) 7 16 15 . .... ···3··· ... . ... . 49 33 31 17 10 45 115 96 0.54 0.71 0.98 1.52 1.70 1.65 1. 72 2.12 2.31 2.09 1.87 2.17 2.38 2.43 2.28 1.78 1.80 . ... i; ... .. ... 40 84 60 15 4 45 114 106 I·· .... ·· .. · ... · * Loan program for oats started in 1945. Loan rates on all three grains varied by counties from 1945 to date.
t Total quantity placed under loan, 1940-47, and under loan and purchase agreement. 1948 to date.
Compiled from reports of the Comomdity Stabilization Service: and U. S. Dept. Agr., Agricultural Marketing Service. The feed situation. May 1956. p. 21.
After fighting cea~ed in Korea, corn storage stocks grew large. Corn acreage allotments were used again in 1954, 1955 and 1956, but total corn acreage was not reduced much. Production con~ tinued high, and stocks continued to accumulate. By Oct. 1, 1956, corn stocks in all positions amounted to 1.2 billion bushels, the largest in his~ tory. The average farm price of corn in Decem~ ber 1955 was $1.15 per bushel, 43 cents below the loan rate. Farmers complained that the corn pro~
gram was not working well; a series of House hearings held in the eorn Belt in October 1955 revealed considerable concern about the Whole farm price support program. Congress passed a new agricultural act in Apri11956, raising loan rates to 90 percent of parity. This bill was vetoed by President Eisenhower, and the corn loan rate for the 1956 corn crop to cooperators in the com-mercial corn area was set at $1.50 per bushel but not less than 82.5 percent of the parity price at the beginning of the marketing season. This $1.50 was 86 percent of the March 15 parity price; however, the announcement did not commit the Department of Agriculture to a support price of 86 percent of parity.
eOSTS OF THE CORN PROGRAM A program like the corn program involves sev-eral kinds of costs. It involves direct money costs and indirect money costs, and some costs that are difficult to measure in monetary terms-the costs of alternatives foregone, the costs in terms of utility or satisfaction borne by other producers and by consumers, etc.
A full analysis of these costs would constitute a report in itself. For the purposes of the present introduction, it is sufficient to report merely the simplest, most important and most clear~cut item of cost-the direct money cost to the USDA. Even this item involves some important matters of judgment, as we shall see.
"The direct money costs to the USDA" sounds like a clear~cut concept. But what is the direct money cost of half a billion bushels of corn under loan, which mayor may not be taken over later by the Cee? And for that matter, what is the cost of half a billion bushels of corn that has been taken over? Most of it will be sold back to the market within a few years; some of it may go out of condition and have to be sold at a loss.
The solution which the USDA has come up with is the concept of "realized cost."
"Realized cost means the net cost which has actually been incurred to date. It was adopted· as the basis for the statement because (1) it is a realistic measure of the actual financial results of program operations and (2) it is a common denominator which can be applied to all programs regardless of how they are financed. It is realistic because it takes into account only those trans~ actions which actually have an ultimate financial impact. For example, the advancing of a loan to a borrower under one of the Department's lend~
ing programs is not considered a cost. It is re-garded as an investment which will be repaid. However, the interest paid by the government on funds provided for lending purposes is considered a realized cost of the year in which it accrues. Similarly, interest collected from the borrower is included as income, or a reduction of cost. The principal amount of a loan becomes a cost only in the event the borrower defaults and the loan is written off by the Department. This example is illustrative of how the realized cost approach comprises elements of cost as distinguished from cash outlays, and how it also takes into account income or negative cost items. The realized cost basis can be applied to all programs regardless of how they are financed since, regardless of how funds are made available for carrying out a pro~ gram, there is in each instance a measurable net co.st of operations to date. Many of the Depart-ment's programs are financed directly from ap~ propriations, some activities are carried out by corporations using their corporate funds, and others are operated from revolving funds. Funds available, therefore, is not a practicable common denominator for all programs, and it likewise does not take into account income or offsetting receipts arising from operations. Realized cost does not include any element of anticipated gains or losses and, accordingly, it is not synonymous with ac~ crued cost or accrued income and expense." 13
Keeping this definition of cost in mind, let us see what the realized cost of the CCC program haS been.
REALIZED COST OF THE CORN PROGRAM
The official data published by the USDA show that the "realized cost of agricultural programs primarily for stabilization of prices and farm in~
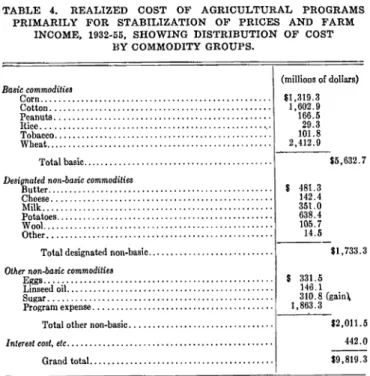
comes," over the fiscal years 1932~55, was $9,819 million.14 This cost is shown by commodities in table 4.
This table shows that the wheat program has cost the most of any commodity-$2.4 billion. Cot-ton comes second with $1.6 billion. Corn comes third with $1.3 billion.
The costs of the corn program are broken down into separate items by years in table 5.15 This table shows that the largest item of cost in the corn program was the acreage control program. Parity payments came second. The cost of the storage program was comparatively small; the "cce loan, purchase and payment costs" were only $227 million. This is only 17 percent of the total cost of the corn program.
Figure 5 shows, however, more clearly than table 5, that the small size of the storage costs in relation to the total costs resulted from the situa-tion in the early years of the program, not in the later years. In the last 3 years shown on the 13 Statement by the USDA, mimeo, undated, prepared by Office of
Budget and Finance.
14 F. D. Stocker. Governmental cost in agriculture. U. S Dept Agr Agricultural Research Service. (Mimeo.) May 1956. P: 39.' .,
TABLE 4. REALIZED COST OF AGRICULTURAL PROGRAMS PRIMARILY FOR STABILIZATION OF PRICES AND FARM
INCOME, 1932.55, SHOWING DISTRIBUTION OF COST BY COMMODITY GROUPS. BaBic commodilie' Corn ... . Cotton ... . Peanuts ... .. Rice ... ,. Tobacco ... · ... · ... . Wbe.t ... . Total basic ...•...•...
Designafed non-baric commodifi ..
Butter ... ··· . Cheese ... .. Milk ... .. Pot.toes ...•...•... · . Woo!.. ... · Other ... .
Total design.ted non·basic ... .
OIh .. non-baBic commodili.8
fr.:~ ~il: : : : : : : : : : : : : : : : : : : : : : : : : : : : : : : : : : : : : : : : : : : : : :
Sugar ... .
Program expen ... . Tot.1 other non-b.sic ... .
1nt .... f cosf, efc . ... , ... . Grand total.. ... . (millions of dollars) $1,319.3 l,~gU 29.3 101.8 2,412.9 S 481.3 142.4 351.0 638,4 105.7 14.0 S 331.5 14a.1 $5,632.7 St,733.3 310.8 (gain\ 1,863.3 52,011.5 442.0 $9,819.3
Source: U. S. Dept. Agr., Office of Budget and Finance.
chart, the 'storage costs make up the bulk of the total costs of the whole corn program.
Since the present report is concerned primarily with the
eee
storage program, we will deal with the"eee
loan, purchase and payments costs" of $227 million first. The costs of the acreage control and parity payment programs will be con-sidered in a later report.COST OF THE CORN STORAGE PROGRAM There are three reasons for the relatively low cost of the
eee
storage operations shown in table 5. One is that the storage operations were not conducted on a very large scale until quite recent years. The second is that the general price level rose markedly after 1933; this helped theeee
keep its inventory losses low and, in fact, enabled it to make some inventory gains. The third reason is that theeee
has not sold much of its stocksCI) 0: 200 :5 150 ..J 8 , CI) z a 100 ::J ..J :E ~
~
50 I ! I I , I , ! , I 1935 37 39 41 43 45 47' 49 51 53 55Fig. 6. Total cost of the corn program, and CCC corn storage cost,. an·
nually, 1933·35. .
during the past few years when the loan rates for corn have been declining;
If all commodities acquired by the
eee
could be disposed of without any losses, the "realized cost" figure would be a reasonably accurate meas-ure of the total cost of the storage program. But it is likely that some of the commodities in stor-age will have to be sold for less than they cost, either because they are going out of condition, because they will be sold for export at reduced prices, or because the prices for the products have declined. In the latter case, substantial additional storage costs are likely to be incurred.Study of the cost data by years shows, in fact, that more than two-thirds of the total
eee
stor-age program costs ($156 million out of a total of $227 million) was incurred in the two most re-cent fiscal years, 1954 and 1955 (fiscal year 1954 means July 1, 1953 to June 30, 1954, and similarly for other years). The storage stocks were built up to a record large size by then, and the general price level ceased to rise. The level of loan rates for corn was reduced in 1955 from $1.62 to $1.58, and a further reduction to $1.50 was made in 1956. The transition to modernized parity could further lower the level of loan rates in 1958 and 1959 (the 5-percent drop scheduled for 1957 was postponed for 1 year under the Agricultural Act of 1956).It seems likely, then, that even if corn loan rates were constant, the cost of
eee
operations would be more like the $75-80 million per year registered in 1954 and 1955 than the small figures of earlier years. If corn loan rates continue to decline, the figure is likely to be larger than $80 million.16 In the latter part of 1955, the costs of storage of theeee
corn inventory of 696 million bushels were running at about $50 million a year. The value (cost) of this inventory was $1,186 million. The reserve for losses set up on the ad. vice of the Grain Division of theeee
was $507 million-nearly half the total value.17The losses from deterioration so far have been small. The large size of the reserve for losses re-flects mostly the expectations of losses from prices below the costs of acquisition.
How large these losses will be depends upon several things-the size of the corn crops in 1956 and later years, the level of loan rates, the rapid-ity of disposition of the present inventory, the effects of the soil bank, etc. If corn crops over the next few years are average in size, and
eee
in-ventories continue to run at about present levels, it seems likely that the direct cost to theeee
of . its corn stabilization operations in the near future will run somewhat higher than the figure was in 1955 ($76 million) as the level of loan rates de-clines over the next few years. On the basis of the 1955-56 program, a reasonable estimate for the near future would be a round figure of about $10016 For the first 9 months of 1955-56, the Joss was $80 million. 17 Commodity Credit Corporation. Commodity Inventories a.nd
com-modities under contract purchase as of October 31, 1955. (Unpub-lished report.)
00
i:f
TABLE 5. REALIZED COST OF CORN PROGRAM BY ITEMS AND BY FISCAL YEARS, 1933-55.
(millions of dollars)
1~~~y5
11933119341193511936119371193811939119401~119421194311944119451194011947119481194911950
11951 11952119531195411955Baoic commodilie8:
Corn (including cornmeal and AAA cOIn-hog program):
cec nonrecourse loan, purchase and payment programs . . .
CCC I""""" 011 emergency reed ... .
Donations or commodities to other nations ... ... .
Uemoval of surplus agricultural commodities:
227.1 17.0 8.1 1.1 1 3.4 I 15.61 9.5 I 4.51 0.3'1 S.1 7.4'1 0.3' 0.1'117.21 0.8 I. s'l 20.5 1 80.5
I
75.7 16.5 0.5 8.1g:~~;';c~i::::::::::::::::::::::::::::::::::::::::::I~I_I-I-I-I-I--I~I g:gl~:_L~I~I_I_J_I
__ I __
I_I_I_I_I_I~'_
Total ... ~ _ _ _ _ _ _ _ _ _ _ _ _ ~ ~~L-!.~ ~
____
I ______
I __
I ____I __
I __
~.__
Federal crop insurance ... 1.6'1101.0189.9186.0186.3166.7151.2
I I 0.3 I 0.1'1 0.5 I 0.4'1 0.5'1 0.2 I 1.5 I 1.0'1 1.4'1 0.0
Acreage allotment payments under the Agricultural
Conservation Progra.m . ... 441.0
Agricultural adjustment programs (acreage allotments
and marketing quotas) ... 22.4
Parity payments ... 347.5 160.1 I 43.8 I 43.91121.4 I 78.3 I I 5.0 I 3.9 I I 6.8 I 6.7
Agricultural Adjustmcnt Act of 1933 and related acts:
Corn-hog program: Program expenses... 488.7
I
311.9' 176.9"I
Miscellancous receipts.. .. .. . . .. .. . .. . .. .. . .. .. .. 0.6' O. O'Processing taxes (net) ... ~ _ _ W5.4" 137.7" 18.3" _ _ _ _ _ _ _ _ _ _ _ _ _ _ _ _ _ _ ' _ _ _ _ . _ _ _ _ ' ______ . _ _ , _ _ . _ _ , _ _ , _ _ , _ _
Total.. ... ~ _ _ _ 1105.4·1174·2 158.0 _ _ _ _ _ _ _ _ 1 _ _ 1 _ _ - - ' _ _ 1 _ _ _ _ _ _ _ _ _ _ 1 _ _
-Transportation and handling of emergency feed ...•.
~
_ _ _ _ _ _ _ _ _ _ _ _ _ _1
__________ 1
__________________
~I~
Total.Corn ... 1.319.3 1105.4"iI74.21158.0 , 64.91159.-1 147.611t3.8 195.7 129.21 8.1 7.1' 0.4' 0.5 0.3" 21.7 4.9 0.3' 19.5 IHAI
91.1million per year. If the soil bank program proves effective in reducing corn production, this esti-mate could be reduced.
EFFECTS OF THE CORN PROGRAM ON YEAR-END STOCKS
Has the corn loan and storage program attained its objective of stabilizing market supplies and prices? What effects has it had on other things-on the prices and productithings-on of hogs and other livestock, etc.?
The effects of the corn storage program ramify out in various directions, in some cases reinforc-ing the effects of other concurrent events, in some cases conflicting with them. It is not always easy, therefore, to determine how much of an effect should be ascribed to one cause and how much to another . We shall need to be on our guard con-stantly to be sure that we do not attribute an effect to the corn loan program when in fact it resulted from something else.
It is not easy to determine how much of the various changes that took place in corn and live-stock supplies and prices after 1933 was due to the CCC loan and storage program and the acre-age program, and how much was due to other forces-drouth, war, inflation, etc. But the at-tempt is made below, with appropriate reserva-tions expressed where they are in order.
One of the most obvious things a corn storage program could be expected to do would be to affect the quantity of corn held in storage from year to year. This effect is registered in the size of the year-end carryover stocks-the carryover of corn from preceding crops into the new crop year.
The USDA publishes quarterly estimates of the stocks of the various grains. The Oct. 1 estimate coincides closely with end of the corn marketing year, just preceding the new harvest. The July 1 estimates similarly serve for oats and barley; they serve somewhat less well for wheat that is fed.
The data for corn are given in table 6. This table shows the Oct. 1 stocks of corn from 1926 (the earliest date when the data were compiled) to 1956 (old crop grain only).
These data go back farther than any other stor~ age series. They are widely used. They show, however, only the CCC inventory in bins or other storage owned or controlled by CCC, or in transit to ports. They do not include CCC~owned corn in interior mills, elevators and warehouses, or in terminal markets, nor do they include corn in process of being taken over from loans being liqui-dated, nor corn under loan (resealed) most of which will be taken over by the CCC later. Ac-cordingly, the situation for our purposes is better shown in table 7, where the quantities of corn under loan or owned by CCC, and "other" corn (in private hands) are listed separately for the years since 1933.18 These data, plus the data from
18 U. S. Dept. Agr., Agricultural Marketing Service. Grain and feed statistics through 1954. U. S. Dept. Agr. Stat. Bul. 159. March
1955. p. 46.
TABLE 6. CORN: STOCKS, UNITED STATES, OCT. 1 (OLD CROP GRAIN ONLY).
(million bushels)
Commodity Interior mill, Terminal Credit elevator and Year Farm market Corporation * warehouse Total
1926 ... 262 18 ... ... 280 1927 ... 192 25 ... ... 217 1928 ... 87 7 ... ... 94 1929 ... 142 4 ... ... 147 1930 ... 134 5 ... ... 139 1931. ... 162 5 ... ... 168 1932 ... 252 19 ... ... 270 1933 ... 327 60
...
... 386 1934.. ... 274 64 ... ... 338 1935 ... 61 3 ... ... 65 1936 ... 171 4 ... ... 176 1~37 ... 60 6 ... ... 66 1938 ... 351 10 ... ... 361 1939 ... 554 15 15 ... 584 1940 ... : .... 541 41 105 ... 688 1941. ... 473 39 132 ... 645 1942 ... 422 39 30 ... 491 1943 ... 355 7 ... 21 384 1944 ... 203 7 ... 20 231 1945 ... 293 5 .... , ... 17 315 1946 ... 152 5 ... 15 172 1947 ... 252 8 ... 23 283 1948 ... 112 1 ... 10 123 1949 ... 696 10 68 70 813 1950 ... 471 40 253 81 845 1951. ... 313 33 315 79 739 1952 ... 171 18 245 52 486 1953 ... 330 9 384 45 769 1954 ... 359 18 468 74 920 1955 ... 314 32 560 129 1,035 1956t ... 300 64 600 201 1,166 • Owned by CCC and stored in bins or other storage owned or con-trolled by CCC, in transit to ports, or in Canadian elevators. Other CCC·owned grain i. included in the estimates by positions. t Preliminary. Source: U. S. Dept. Agr., Agricultural Marketing Service. Grain and f~ .tatistics through 1954. U. S. Dept. Agr. Stat. Bul. 159. l .. arch 1955. p. 18.; 1955 and 1956 data from: U. S. Dept. Agr. Stocks of grains. Oct. 23, 1956. (Mimeo rept.) TABLE 7. CORN: STOCKS AT CLOSE OF THE MARKETING YEAR, UNITED STATES, 1933-54. (million bushels) Stocks of corn at the close of the marketing year Under loan or owned Year beginning OctoLer · - - - 1 - - - 1 m~:::::::::::::::::::::::::: ...
~~!.... .
m~:::::::::::::::::::::.::::...
! .... .
1937... 45 1938. ... ... 258 1939. ... ... ... 471 1940 ... . 1941. ... . 1942 ... . 1943 ... . 1944 ... . 1945 ... . 1946 ... . 1947 ... . 1948 ... . 1949 ... . 1950 ... . 1951 ... . 1952 ... . 1953 ... . 1954 ... . 1055·· ... . 403 197 8t 6t 9t Ot 9t Ot 493t 650f 487§ 306§ 580t 736t 870 1,025 Oth.r 256 65 175 66 316 326 216 242 294 376 225 306 172 274 123 320 195 252 180 190 184 165 141 Tot.l· 338 65 176 66 361 584 688 645 491 384 231 315 172 283 123 813 845 740 486 769 920 1,035 1,166• Includes stocks at interior mills, elevators and' warehouses for the years 1943 to date.
t Loans were in the process of being repaid. Practically all of the corn under ~eal on Sept. 30 was redeemed by farmers early in the next marketmg year.
*
~~~~~i..:~r~f~~dO~t:~~cb8Se agreement delivered to CCC or placed § ~~~~~::. corn on which loans were in the process of being repaid by •• Preliminary estimate.Source: U. S. Dept. .A~r., Agricultural Marketing Service. Grain and feed statistICS through 1954. U. S. Dept. Agr. Stat. Bul.
159. 1956. P. 46; and U. S. Dept. Agr., Agricultural Mar-keting Service. The feed situation. May 1956. p. 22.
1926 to 1932 in the preceding table, are repro-duced in graphic form in fig. 6.
This figure shows that while the total stocks of corn have been increasing, the quantities owned privately have been slightly decreasing. This is particularly evident during the past few years while total stocks have been large. The cce has been taking over part of the year-to-year storage function from private hands.
The eee stores most of the corn it owns, and some of its other grains, in its own bins-at "bin-sites" in the vernacular of the trade. In June 1949, ece owned only 45 million bushels of bin-type storage capacity for use in storing CCC-owned grain. By September 1955, this capacity had been increased to 886 million bushels 334 million of which were purchased since the e~d of the fiscal year 1952.
cce purchases bins for storing Cee-owned commodities only for areas where commercial storage facilities are inadequate. This policy is in accord with the Commodity Credit Corporation Charter Act which provides that cec's authority to acquire real property for storage purposes shall ::lot be utilized by cec unless CCC "determines that existing privately owned storage facilities ... in the area concerned are not adequate."
Private storage capacity has also been increas-ing. From 1951 through 1954, off-farm commer-cial-type grain storage capacity rose on a nation-wide basis, from 2,176 million bushels to 2,820 million-an increase of 644 million bushels within the space of 3 years.
On Oct. 1, 1955, the CCC owned outright 681 million bushels of corn. (The difference between this figure and the 850 million bushels shown in table 7 represents corn under loan, mostly in process of being taken over or resealed.) The CCC held most of this corn in its own storage structures. It held 551 million bushels in bin-sites, 84 million bushels in country warehouses and elevators, 32 million in subterminal and ter-minal elevators, and 15 million in transit.19
Figure 7 shows the year-end government stocks (under loan or owned) and "other" stocks of feed grains (corn, oats, barley and sorghum grains)
19 U. S. Dept. Agr .• Commodity Stabilization Service. Grain Division
Oct. 20. 1955. (Mimeo rept.) .
1000 900 sao 700 600 ::0 co 500 o ~ 400
1
PRIVATE SroCKS 1 \ l \,;0"'\,,-,-
... °1926 2728 29 30 31 3l J~ 34 35 3637 38 394041 42434445464748 4950 SI 52 5354Fig. 6. Total stocks of corn. Oct. 1. and private stocks. annually
1926-54. The difference between the two represents the ceo stocks.
FEED CONCENTRATE SUPPLY
200r---r---+----~-~----~~--~ 150f---+"" 100 50 o 1950 1955 1960
lUi .,t,UD ON ocr. I INDICAtiONS COliN AND JOII"GHUM (;IIAI",$ OCT. I, OATS "''''0 !'IIL.l!r JU1.Y I • UHOEIt LOAN Ole 0".'1'11"11 • .,. eec
U." DEPAJilrlllE'H OF ,LCIIICUlTURE N(G. IHU .• U! I~ I AQII'ICuL1ul!Io./. IU,IUETlto1C URvlCE Fig. 7. Feed concentrate supply; feed concentrate production plus
private and CCC (government) stocks. annually. 1937-56.
in total. The chart also provides some perspective on the size of these stocks; it shows them in rela-tion to total feed grain producrela-tion, other grains fed and by-product feeds. It shows that, large as the carryover stocks have grown, they are still relatively small compared with total feeds produc-tion.
To take a specific case: The carryover of corn is the same size (a billion bushels) as the carry-over of wheat. But the carrycarry-over of wheat is about equal to an average crop of wheat, while the carryover of corn is only equal to a third of an average crop of corn; and the carryover of total feeds is only about a quarter of an average total feeds crop. The question whether these carryover stocks are larger, or smaller, than needed for stabilization purposes is discussed in a later sec-tion of this report.
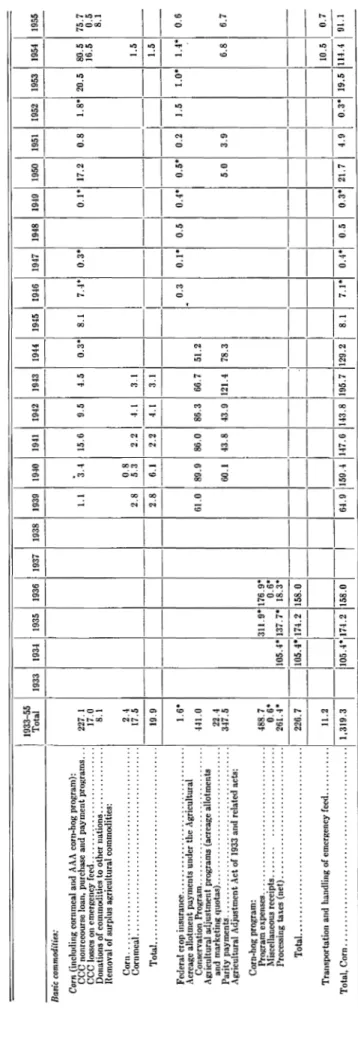
WHAT DETERMINES HOW MUCH CORN GOES UNDER LOAN?20
Figure 4 in a preceding section of this report sho'Ys that when the open-market price of corn declmes below the loan rate, large quantities of corn generally go under loan.
The nature of this relationship is shown more accurately in fig. 8. In the upper section of this chart, the quantity of corn put under loan each year is plotted against the difference between the average November-May United States farm price of corn and the corn loan rate for the same year. A general negative relationship is shown in fig: 8, although there is a good deal of scatter among the dots for the recent years. This shows that some othe.r factor was also at work determining the quantIty of corn put tinder loan.
A likely factor of this sort would be the size of the corn crop. To test whether this factor did affect the quantity of corn put under loan, we plotted the corn put under loan each year against the size of the corn crop that year. The correla-20 This section summarizes work done by Allen Richards.