Spanwise Flow Corrections for Tidal Turbines
Aidan Wimshurst
Department of Engineering Science, University of Oxford Parks Road, Oxford, United Kingdom, OX1 3PJ
E-mail: [email protected]
Richard Willden
Department of Engineering Science, University of Oxford Parks Road, Oxford, United Kingdom, OX1 3PJ
E-mail: [email protected]
Abstract—Actuator line computations of two different tidal turbine rotor designs are presented over a range of tip speed ratios. To account for the reduction in blade loading on the out-board sections of these rotor designs, a spanwise flow correction is applied. This spanwise flow correction is a modified version of the correction factor of Shen et al. (Wind Energy 2005; 8: 457-475) which was originally developed for wind turbine rotors at high tip speed ratios. The modified correction is described as ‘directionally dependent’ in that it allows a more aggressive reduction in the tangential (torque producing) direction than the axial (thrust producing) direction and hence allows the sectional force vector to rotate away from the rotor plane (towards the streamwise direction). When using the modified correction factor, the actuator line computations show a significant improvement in the accuracy of prediction of the rotor thrust and torque, when compared to similar actuator line computations that do not allow the sectional force vector to rotate. Furthermore, the rotation of the sectional force vector is attributed to the changing surface pressure distribution on the outboard sections of the blade, which arises from the spanwise flow along the blade. The rotation of the sectional force vector can also be used to explain the reduction in sectional lift coefficient and increase in sectional drag coefficient that has been observed on the outboard blade sections of several rotors in the literature.
Index Terms—Spanwise Flow, Tip Loss, Tip Correction, Actu-ator Line Method, Blade Loading
I. INTRODUCTION
The majority of low order rotor models (such as the blade element momentum (BEM), actuator line and actuator surface methods) operate using the flow independence principle. The flow independence principle assumes that the forces acting on each aerofoil section of a rotor blade may be computed by only considering the flow components in the plane of the aerofoil section (neglecting the spanwise flow compo-nent) and that the forces experienced are the same as those experienced by the corresponding two-dimensional aerofoil. While this assumption often leads to acceptable accuracy along the mid-span of the blade, the sectional thrust and torque are often over-predicted on the outboard sections of the blade, if spanwise effects are not adequately accounted for. Two different approaches have historically been attempted to reduce the over-prediction of the blade loading on the outboard blade sections. In the first approach, the lift and drag polar components (which are used as a model to compute the blade forces) are modified directly, by reducing the lift coefficient and increasing the drag coefficient on the outboard sections [1]. In the second approach, the thrust and torque producing forces are reduced directly, by applying a correction factor to
the forces before they are applied to the flow field (without modifying the lift and drag polar components) [2]. The second approach will be the focus of this investigation, since the method of correcting the lift and drag polar components has recently been addressed by the authors [1].
Several spanwise flow corrections factors have already been proposed in the literature (see Lindenburg [3], Shen et al. [4] and Sant [5] for example). It should be noted that these corrections are distinctly different to Prandtl [6] type corrections, which are specific to the BEM method and are used to account for the lack of discrete blade effects in the azimuthal averaging process (see Shen et al. [4] for further detail of the difference between these types of correction). The spanwise flow correction factors of Lindenburg, Shen et al. and Sant were all developed and calibrated specifically to wind turbine rotors, and are intended for use at high tip speed ratios (typically 7-11). However, the applicability of these correction factors to tidal turbine rotors remains uncertain, due to the geometry of tidal turbine rotor blades and their range of operational tip speed ratios (typically 4-6).
Currently, there is insufficient experimental and computa-tional data to propose an entirely new spanwise flow correction factor for tidal turbine rotors. Furthermore, the accuracy of the existing correction factors has not been comprehensively assessed when applied to these rotors. Therefore, in this investigation a modified version of the existing correction factor of Shen et al. will be adopted instead and calibrated to two different tidal turbine rotor designs. This correction factor was chosen as it is widely adopted in the wind energy industry and is straightforward to implement.
The calibration is performed using a combination of (uncor-rected) actuator line and blade resolved computations. While the actuator line computations do not account for spanwise flow effects in their original formulation, the blade resolved computations do implicitly include spanwise flow effects. Hence, the latter are used to carry out the calibration in this investigation. Having performed the calibration, new actuator line computations will subsequently be carried out using the calibrated correction factor, to demonstrate the resulting improvement in rotor thrust and torque prediction. Before carrying out these computations, the spanwise flow correction factor will be introduced, along with the tidal turbine rotor designs that are used for the calibration.
SPECIAL ISSUE OF THE TWELFTH EUROPEAN WAVE AND TIDAL ENERGY CONFERENCE, 27 SEPTEMBER - 1 AUGUST 2017, CORK, IRELAND ©EWTEC 2017. THIS IS AN OPEN ACCESS ARTICLE DISTRIBUTED UNDER THE TERMS OF THE CREATIVE COMMONS ATTRIBUTION 4.0 LICENCE (CC BY
h p://creativecommons.org/licenses/by/4.0/). UNRESTRICTED USE (INCLUDING COMMERCIAL), DISTRIBUTION AND REPRODUCTION IS PERMITTED PROVIDED THAT CREDIT IS GIVEN TO THE ORIGINAL AUTHOR(S) OF THE WORK, INCLUDING A URI OR HYPERLINK TO THE WORK, THIS PUBLIC LICENSE AND A COPYRIGHT NOTICE.
II. SPANWISEFLOWCORRECTION
To implement the correction, the axial and tangential forces per unit span (Fax and Fta) are multiplied by the correction factor (F1) after they are computed from the lift and drag polar components, but before they are applied to the flow field. In this work, the axial force per unit span refers to the thrust producing force (in the streamwise direction), while the tangential force per unit span refers to the torque producing force (in the direction of blade rotation). The spanwise flow correction factor (F1) proposed by Shen et al. [4] takes the following form:
F1= 2 πcos
−1
exp
−g1
N(R−r) 2rsin(φ)
(1)
where N is the number of blades, R is the rotor radius, r is the spanwise distance from the axis of rotation, φ is the local angle of the incident flow velocity relative to the rotor plane andg1is an empirical coefficient. Shen et al. calibrated g1 to experimental measurements from the NREL Phase VI wind turbine rotor at a low tip speed ratio (λ = 3.79) and the Swedish WG 500 wind turbine at a high tip speed ratio (λ= 14.0), in order to cover a wide range of tip speed ratios. Here the tip speed ratio is defined asλ=ωR/U∞, where ω is the rotational speed of the rotor and U∞ is the freestream velocity. Shen et al. proposed the following relationship for g1,
g1= exp (−c1(N λ−c2)) + 0.1 (2)
with empirical coefficientsc1 = 0.125 andc2 = 21.0 to best fit the data. As the correction factorF1→0as r/R→1, the axial and tangential forces per unit span are both reduced to zero as the tip is approached, to model the tip loss effect.
Using computational data from blade resolved computations of the MEXICO wind turbine rotor over a range of tip speed ratios (6-10), Wimshurst and Willden [2] showed that further improvement to the axial and tangential forces per unit span could be achieved by calibrating the correction factor separately in the axial and tangential directions. They found that a greater reduction was required in the tangential direction than the axial direction and consequently different empirical coefficients (c1 andc2) were required in the axial and tangential directions. This approach of adopting separate corrections in the axial and tangential directions will also be adopted in this investigation.
III. TIDALTURBINEROTORDESIGNS
Two different tidal turbine rotor designs are investigated in this work and will be referred to as ‘Rotor 1’ and ‘Rotor 2’ respectively. The rotors were both originally designed by Schluntz and Willden [7] and then analysed in a series of blade resolved computations by Wimshurst and Willden [8]. Fig. 1 compares the chord (c) and twist (β) distributions for the two rotor designs.
Both rotors use the RISØ-A1-24 aerofoil along the entire span (0.25< r/R <1.0), except for the root region (r/R <
0 0.1 0.2 0.3 (a)
0 0.2 0.4 0.6 0.8 1
0 5 10 15 20 25 (b)
Rotor 2 Rotor 1
Fig. 1. (a) Chord and (b) twist distributions for Rotor 1 and Rotor 2. The rotor radiusR= 10m.
0.25) where the aerofoil is blended into a cylinder to facilitate pitching at the blade root. As shown in Fig. 1, Rotor 2 has a greater local chord length and a slightly lower twist angle than Rotor 1 along the entire span. This allows Rotor 2 to apply greater thrust to the flow at the same tip speed ratio as Rotor 1, which may be beneficial at higher blockage ratios, as greater thrust is required to maximise the power coefficient [7]. Hence, Rotor 1 more closely resembles a wind turbine rotor, while Rotor 2 resembles a rotor that may operate in a closely packed tidal fence. However, for this investigation all computations will be carried out in a virtually unblocked domain (a blockage ratio of 0.01) and hence the two rotor designs will only be used to give an indication of the effect of blade geometry on the strength of the spanwise flow.
0 0.5 1 1.5 (a)
0 2 4 6 8 10 12
0 0.01 0.02 0.03 0.04 0.05 0.06 (b)
Fig. 2. Computed sectional lift (a) and drag (b) coefficients for the RISØ-A1-24 aerofoil at a chord based Reynolds number of12×106.
RISØ-A1-24 aerofoil at a chord based Reynolds number of 12×106, that were used for the actuator line computations. These polar components were assembled from a series of 2D aerofoil computations of the RISØ-A1-24 aerofoil [8], rather than experimental measurements, in order to minimise the modelling differences between the actuator line computations and the blade resolved computations (the target solution). Fur-thermore, the mesh adopted for the 2D aerofoil computations was constructed to closely resemble that of a slice through the 3D blade resolved mesh of the rotor blade (normal to the blade axis) atr/R= 0.8.
It should be noted that no corrections were applied to the polar components themselves. This is because the spanwise flow correction factor is applied to the axial and tangential forces per unit span after they have been computed from the resolved lift and drag forces per unit span. Hence, it is not necessary to also correct the lift and drag polar components when using this spanwise flow correction.
IV. ACTUATORLINECOMPUTATIONS
The actuator line method of Sørensen and Shen [9] was implemented in OpenFOAM (version 2.3.1) as a user-defined shared object library. In the actuator line method, the rotor blades are represented virtually as equivalent forces, which are applied to the flow field. The angle of attack and relative velocity magnitude are computed by sampling the flow field along the blade quarter-chord line and are used (together with sectional aerofoil data) to determine the spanwise varying blade forces. The blade forces are then applied to the flow field and the RANS solver is used to update the flow field. The blade forces are recomputed in the next iteration and the process is repeated until convergence. In the present method, the flow field around each actuator point is sampled using the potential flow equivalence approach of Schluntz and Willden [10] and the blade forces are applied back to the flow field using the Gaussian smearing technique of Sørensen and Shen [9]. A constant distribution of the Gaussian smearing parameter = 0.5m was adopted along the blade. This value was chosen as the resulting actuator line computations gave the closest agreement with the blade resolved computations along the mid-span of the blade (0.4< r/R <0.7). Further reductions inwere found to be unachievable without incurring signifi-cant numerical oscillations in the solution. These oscillations occur as a result of concentrating the blade loading on a small volume of cells, which leads to steep velocity gradients in the solution. Troldborg [11] found that these numerical oscillations became unacceptable whenwas reduced to around 1.5 times the characteristic cell dimension at the rotor plane (cube root of the cell volume). In this investigation, the value adopted for corresponds with approximately 1.67 times the streamwise cell dimension at the rotor plane (/∆x= 0.5/0.3) and hence is close to the numerical stability threshold found by Troldborg.
A. Numerical Method
The Reynolds-averaged Navier-Stokes (RANS) equations were solved using the open source code OpenFOAM (version
2.3.1), with thek−ω SST model [12] for turbulence closure. Central differencing was applied for face interpolation of all the Laplacian and gradient terms, whilst a flux limited form of central differencing using the Sweby limiter [13] was applied for the convection terms. The actuator lines were rotated at a constant rotational speed by a fixed azimuthal angular increment of 0.4◦ each time step and 10 iterations of the SIMPLE algorithm [14] were used within each time step for pressure-velocity coupling. 20 rotor revolutions were found to be sufficient to converge the integrated thrust and torque to within 0.2% of their final (steady state) values.
B. Computational Domain
For consistency with the blade resolved computations of Wimshurst and Willden [8], the computational domain was taken as a circular cylinder with radius 10R and length 19R (where R = 10m is the rotor radius), to ensure a virtually unblocked domain (a blockage ratio of 0.01). The rotor plane was placed 5R downstream of the inlet, with the axis of rotation aligned with the centreline of the cylinder. A simplified cylindrical nacelle (radius0.15Rand lengthR) was included on the centreline of the domain, with the tip of the hemispherical nose cone 4.65Rfrom the domain inlet.
Despite the flow in real tidal channels being highly sheared, all computations in this work were carried out in uniform flow with a velocity (U∞) of 2.0 m/s, since the applicability of the spanwise flow correction adopted in this work (and all other spanwise flow corrections) remains uncertain in sheared flow. At the domain inlet, the values of turbulent kinetic energy and specific dissipation rate were computed based on a turbulence intensity of 10% and a length scale of 0.7 times an assumed hub-height of 20m. These values were originally chosen to mimic the high levels of turbulence found in real tidal channels, following Gant and Stallard [15]. Due to the lack of shear, the applied turbulence intensity decayed between the inlet and the rotor plane. However, this decay was found to be small (from 10% to 9.908%) and was consistent between the actuator line and blade resolved computations. It was therefore deemed unnecessary to modify the inlet boundary condition to achieve a turbulence intensity of exactly 10% at the rotor plane.
At the domain outlet, zero gradient boundary conditions were applied for the velocity and turbulence scalars, while the static pressure was assigned a fixed value of 0. On the curved outer surface of the cylindrical domain, zero gradient boundary conditions were applied for all flow variables (a slip condition).
C. Meshing Strategy
rotor swept area and a streamwise cell dimension of R/30 was adopted at the rotor plane. This level of resolution was held constant in the vicinity of the rotor (−R < x < 3R). Outside of this region, the cells were expanded with a growth ratio of 1.2 upstream, 1.1 downstream and 1.1 in the radial direction away from the rotor. This level of resolution has been shown in the literature to be sufficient for computing the blade loading but insufficient for preserving the tip vortex structure downstream of the rotor plane [16] [17]. Since the blade loading was the primary focus of this investigation, this level of mesh resolution was deemed to be sufficient.
V. CALIBRATING THECORRECTIONFACTOR
0 10 20 30 40 (a)
0 0.2 0.4 0.6 0.8 1 -4
-2 0 2 4 6 8 (b)
Actuator Line (No Correction) Blade Resolved
Fig. 3. Axial (a) and tangential (b) forces per unit span for Rotor 1 at a tip speed ratio of 5.
Actuator line computations were carried out over a range of tip speed ratios (4.5-7 for Rotor 1 and 4-6 for Rotor 2) without applying any spanwise flow corrections. The computed axial and tangential forces per unit span were then compared with the results of the corresponding blade resolved computations (carried out by Wimshurst and Willden [8]), as shown in Fig. 3. Along the mid-span of the blade (from0.4< r/R <0.7) the actuator line computations showed good agreement with the blade resolved computations, indicating that spanwise flow effects were small in this region and the blade forces could be computed with reasonable accuracy using the flow independence principle. However, on the outboard sections the actuator line computations considerably over-predicted both the axial and tangential forces per unit span. This is the region where the correction factor will be used to account for spanwise flow effects.
To calibrate the correction factor, the ratio of the blade resolved forces per unit span to the actuator line forces per unit span was computed independently in the axial and tangential directions. A function of the form given by F1 (equation 1) was then fitted to each of these ratios separately using a
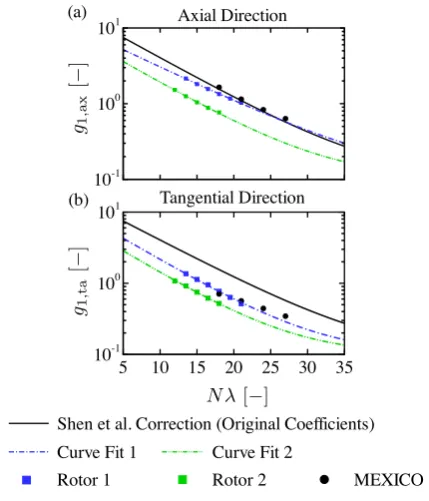
least squares regression analysis. This curve fitting process yielded a unique value ofg1in each of the axial and tangential directions (here denotedg1,axandg1,tarespectively) for each tip speed ratio. This method of calibrating the correction factor is identical to the method adopted by Wimshurst and Willden [2]. For further detail, the original paper should be consulted. g1 can be interpreted as the strength of the spanwise flow correction factor, with a smaller value of g1 leading to a smaller value of F1 and hence a stronger correction to the blade forces [2]. The computed values ofg1,axandg1,tafrom the curve fitting process are shown in Fig. 4, for both Rotor 1 and Rotor 2. Data points for the MEXICO wind turbine rotor (computed by Wimshurst and Willden [2]) have also been included for reference.
5 10 15 20 25 30 35 10-1
100
101 Tangential Direction (b)
Shen et al. Correction (Original Coefficients)
Curve Fit 1 Curve Fit 2
Rotor 1 Rotor 2 MEXICO
10-1 100
101 Axial Direction (a)
Fig. 4. Computed values ofg1in the (a) axial and (b) tangential directions.
Curve fit 1 was performed using the computed data points for Rotor 1. Curve fit 2 was performed using the computed data points for Rotor 2. The data points for the MEXICO rotor were computed by Wimshurst and Willden [2].
Wimshurst and Willden [2] first observed lower values of g1 (and hence lower values ofF1) in the tangential direction than the axial direction, for the MEXICO rotor. From this observation, they deduced that spanwise flow effects led to a greater (fractional) reduction in the tangential force per unit span than axial force per unit span. As shown in Fig. 4, both tidal turbine rotor designs investigated in this work also exhibit lower values of g1 in the tangential direction than the axial direction. Hence, spanwise flow effects also lead to a more aggressive (fractional) reduction in the tangential force per unit span than axial force per unit span, for these rotor designs. The origins and implications of this anisotropy will be discussed further in section VI and VII.
direction. However, the original curve fit considerably over-predicts g1 in the tangential direction, for both rotor designs. This over-prediction arises because the original curve fit was carried out using only the magnitude of the force vector, without accounting for the anisotropy in the axial and tan-gential directions. Hence, applying the same correction factor in the axial and tangential directions is likely to result in a considerable over-prediction of the tangential force per unit span on the outboard blade sections, asg1,ta (and henceF1) is too large.
Fig. 4 also shows that Rotor 2 (the higher soldity rotor) requires a stronger correction than Rotor 1 in both the axial and tangential directions, when operating at the same tip speed ratio. This observation indicates that spanwise flow effects are more significant for higher solidity rotors and that the spanwise flow correction factor is strongly dependent on the blade shape in addition to the blade passing frequency parameter. For actuator line computations of new rotors, it would be desirable to propose a correction factor that can account for both the blade shape dependency and blade passing frequency. However, at this stage there was insufficient data to propose a functional dependency for the blade shape, as more rotors need to be analysed. To carry out the corrected actuator line computations in this work, two separate curve fits were carried out instead (using equation 2 as the fitting function) for Rotor 1 and Rotor 2, to capture the dependency on the blade passing frequency alone. These curve fits are specific to Rotor 1 and Rotor 2 and represent one approach that can be adopted to correct actuator line computations for spanwise flow effects. Table I shows the computed empirical coefficients that correspond with the curve fits shown in Fig. 4. With reference to equation 2,c1 represents the gradient of g1whilec2represents the horizontal shift ofg1 along theN λ axis. These empirical coefficients will be used to replace the values of c1 and c2 proposed by Shen et al. in the actuator line computations carried out in this work.
TABLE I
EMPIRICAL COEFFICIENTS FORg1,axANDg1,ta.
g1,ax g1,ta c1 c2 c1 c2
Shen et al. [4] 0.125 21.00 0.125 21.00 Rotor 1 0.108 20.90 0.141 15.15 Rotor 2 0.130 14.65 0.145 12.00
VI. SPANWISEFLOW
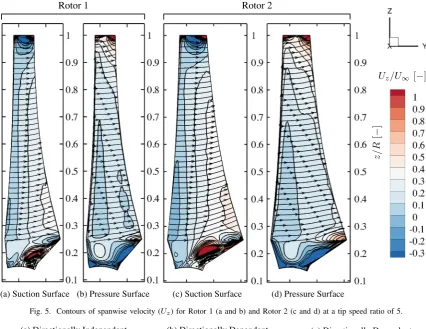
To compare the spanwise flow experienced by Rotor 1 and Rotor 2 more directly, Fig. 5 shows contours of the spanwise velocity component (Uz) on the pressure and suction surfaces
of the blade at a tip speed ratio of 5. The spanwise velocity component is generated from a combination of centrifugal forcing (outboard on both the pressure and suction surfaces) and the tip vortex. The tip vortex leads to an outboard (positive) contribution to Uz on the pressure surface and an
0 0.1 0.2 0.3
(a) Suction Surface
0 0.2 0.4 0.6 0.8 1 0
0.1 0.2 0.3 0.4
(b) Pressure Surface
Rotor 2 Rotor 1
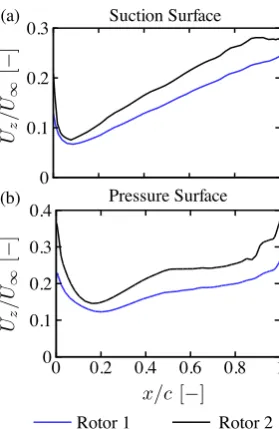
Fig. 6. Spanwise velocity component variation in the chordwise direction along a slice through the blade (normal to the blade axis) atr/R= 0.8, for Rotor 1 and Rotor 2 at a tip speed ratio of 5.
inboard (negative) contribution to Uz on the suction surface.
Therefore, the sources of spanwise flow are complimentary on the pressure surface and antagonistic on the suction surface. On both surfaces, Uz increases in the chordwise direction,
reaching a maximum near the trailing edge and causing the streamlines to curve. This streamline curvature modifies the local flow conditions such that the near wall flow is no longer aligned with the aerofoil section along the entire chord length. To quantitatively compare the spanwise flow experienced by Rotor 1 and Rotor 2, Fig. 6 shows the chordwise variation of the spanwise velocity component (Uz) along a slice through
the rotor blade (normal to the blade axis) atr/R= 0.8. Along the entire chord, Uz is greater for the Rotor 2 than Rotor
1 (on both the pressure and suction surfaces). The increased spanwise velocity component leads to a greater deflection of the streamlines and a further departure from flow conditions that are entirely aligned with the local aerofoil section. Hence, Rotor 2 experiences a greater change in blade loading on the outboard blade sections than Rotor 1, due to increased spanwise flow. Furthermore,Uz increases with tip speed ratio
(as the strength of the centrifugal forcing and the tip vortex increases) and hence the stronger reduction in blade loading that is observed with increasing tip speed ratio in Fig. 4, can also be attributed to increased spanwise flow.
VII. FORCEVECTORROTATION
(a) Suction Surface
Rotor 1 Rotor 2
(b) Pressure Surface (c) Suction Surface (d) Pressure Surface
Fig. 5. Contours of spanwise velocity (Uz) for Rotor 1 (a and b) and Rotor 2 (c and d) at a tip speed ratio of 5.
Uncorrected
Corrected (a) Directionally Independant
Uncorrected
Corrected (c) Directionally Dependant
Uncorrected
Corrected (b) Directionally Dependant
Fig. 7. Blade element diagram for an outboard section of the rotor blade. The black lines indicate the uncorrected rotor forces, whereas the blue, red and green lines indicate (a) directionally independent (isotropic) and (b and c) directionally dependant (anisotropic) corrections, applied to the rotor forces.θ represents the angle of the sectional force vector to the rotor plane.
In the original approach of Shen et al. [4], the axial and tangential forces per unit span are both multiplied by the same correction factor F1. As shown in Fig. 7 (a), this approach reduces the magnitude of the sectional force vectorF, without changing its orientation. Therefore this approach for correcting the blade forces can be considered ‘directionally independent’, as the force vector is constrained from rotating. However, Fig. 4 shows that both Rotor 1 and Rotor 2 actually experience a greater (fractional) reduction in tangential force per unit span than axial force per unit span. Hence, on the outboard
sections of these rotors, the sectional force vector reduces in magnitude and also rotates in a clockwise sense (towards the streamwise direction). By adopting different correction factors in the axial and tangential directions, the sectional force vector is free to rotate towards the streamwise direction, facilitating a better match with the blade resolved computations. Hence, the spanwise flow correction adopted in this work can be considered ‘directionally dependent’.
coefficients on the outboard sections of rotating blades in the literature. As the sectional force vector reduces in magnitude, the lift force will always reduce on the outboard blade sections. However, the drag force may decrease or increase depending on the degree of rotation (see Fig. 7(b) and (c) respectively). In the literature, the drag coefficient has been found to increase on the outboard sections of the majority of rotors [1], [18], [19]. For the drag coefficient to increase on the outboard blade sections (while the lift coefficient decreases), the sectional force vector must rotate towards the streamwise direction. Therefore, the rotation of the force vector corresponds with Fig. 7 (c) for these rotors. Furthermore, it can be deduced that a directionally dependent spanwise flow correction would also be more appropriate for these rotors than a directionally independent spanwise flow correction.
In the next section, the origin of the sectional force vector rotation will be identified, by considering the changes in the wall shear stress and surface pressure distributions on the outboard blade sections. Corrected actuator line computations will then be carried out, in order to demonstrate the improved accuracy of the rotor thrust and torque that can be achieved by adopting a calibrated directionally dependent spanwise flow correction factor.
A. Wall Shear Stress Contribution
To assess the relative contribution of the wall shear stress and surface pressure to the sectional force vector, the sectional force vector was computed again by integrating the surface pressure distribution alone (omitting the wall shear stress contribution). As shown in Fig. 8, the omission of the wall shear stress led to a small increase in the tangential force per unit span (3.7% at r/R= 0.8 for example) and a small reduction in the axial force per unit span (0.11% atr/R= 0.8 for example). Qualitatively, these changes are to be expected as the drag force acting on each aerofoil sections reduces when the wall shear stress is omitted. Due to the increased tangential force per unit span, the angle of the sectional force vector reduces slightly with the omission of the wall shear stress (approximately 0.3◦ at r/R = 0.8). However as the blade tip is approached, the difference in the angle of the sectional force vector between the actuator line and blade resolved computations continues to increase, regardless of whether the wall shear stress contribution is included or not. Therefore it can be deduced that the large increase in the angle of the sectional force vector as the blade tip is approached (4.2◦ at r/R= 0.98for example) can be almost entirely attributed to changes in the surface pressure distribution.
B. Surface Pressure Contribution
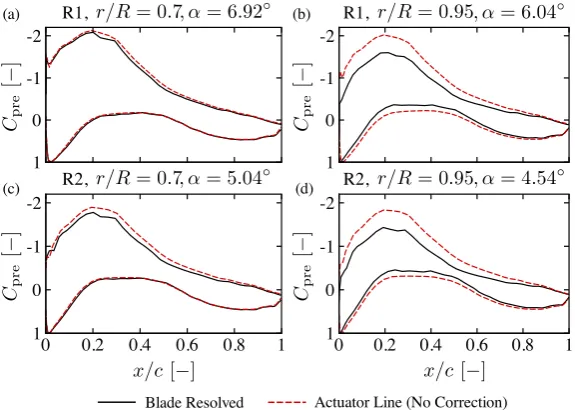
In order to demonstrate the changes in the surface pressure distribution that lead to the changes in the sectional force vec-tor, Fig. 9 shows the surface pressure coefficient distribution in the chordwise direction on two slices through the rotor blade (normal to the blade axis) for each of Rotor 1 and Rotor 2. In these plots, the surface pressure coefficient (Cpre) has been defined as:
Cpre= 1 p−p∞ 2ρ[U
2
∞+ (rΩ)2]
(3)
wherepis the local static pressure,p∞is the freestream static pressure, ρis the fluid density and Ω is the rotational speed of the rotor.
To compute the (effective) pressure distributions for the actuator line computations in Fig. 9, the angle of attack was extracted from the uncorrected actuator line computations at the spanwise location of interest. A separate 2D aerofoil computation was then carried out at this angle of attack, using the same computational set-up as the 2D aerofoil computations that were used to derive the lift and drag polar components for the actuator line computations. The (effective) pressure distri-bution for the actuator line computations was then extracted from the results of these 2D aerofoil computations.
As shown in Fig. 9, the surface pressure distribution showed good agreement between the actuator line and blade resolved computations at r/R = 0.7, indicating that span-wise flow effects were small in this region and the blade forces could be computed with reasonable accuracy using the flow independence principle. However, moving outboard to r/R = 0.95, the pressure distribution no longer showed close agreement between the actuator line and blade resolved computations. More specifically, the shape of the pressure distribution changed along the entire chord length of both surfaces, with a particularly strong reduction in the strength of the suction developed near the suction peak (x/c≈0.25). It is this change in the shape of the surface pressure distribution that (when integrated for lift and drag), leads to the observed reduction in the magnitude of the sectional force vector and its rotation towards the streamwise direction.
It should be noted that this change in the surface pres-sure distribution cannot be entirely attributed to a change in the effective angle of attack. This is because it is not possible to decrease the lift coefficient while increasing the drag coefficient on the outboard blade sections, by varying the angle of attack alone. Rather, the change in the surface pressure distribution is likely to be a strong function of the three-dimensional blade geometry instead (particularly the tip region). However, carrying out a comprehensive investigation to identify the effects of the blade geometry on the surface pressure distribution experienced by the outboard sections, is beyond the scope of this investigation.
VIII. CORRECTEDACTUATORLINECOMPUTATIONS
Having calibrated the spanwise flow correction factor in section V, new actuator line computations were carried out in order to assess the performance of the newly calibrated cor-rection factor. Additional computations were also performed with the original calibration proposed by Shen et al. [4], for further comparison.
0.7 0.8 0.9 1 75
80 85 90 95 (c)
BR (Pressure) BR (Pressure and Wall Shear) AL (Pressure) AL (Pressure and Wall Shear)
0.7 0.8 0.9 1 -2
0 2 4 6 8 (b)
0.7 0.8 0.9 1 0
10 20 30 40 (a)
0.79 0.8 31
32
Fig. 8. (a) Axial force per unit span, (b) tangential force per unit span and (c) angle of the sectional force vector to the rotor plane, for Rotor 1 at a tip speed ratio of 5. AL refers to actuator line (with no corrections applied), while BR refers to blade resolved.
-2
-1
0
1 (a)
-2
-1
0
1 (b)
0 0.2 0.4 0.6 0.8 1
-2
-1
0
1 (c)
0 0.2 0.4 0.6 0.8 1
-2
-1
0
1 (d)
Blade Resolved Actuator Line (No Correction)
R1, R1,
R2, R2,
Fig. 9. Surface pressure coefficient distribution in the chordwise direction on a slice through the rotor blade (normal to the blade axis) atr/R= 0.70and r/R= 0.95, for Rotor 1 (abbreviated as R1) and Rotor 2 (abbreviated as R2). The actuator line results have been taken from 2D aerofoil computations at an angle of attack that corresponds with the angle of attack computed using the uncorrected actuator line method (indicated in the title of each sub-plot).
the corrected actuator line computations (using the original calibration of Shen et al. [4]) gave much closer agreement with the blade resolved computations than the uncorrected actuator line computations. However, the angle of the sectional force vector was not improved with this calibration. This is because (in the original method) the same correction factor is applied in the axial and tangential directions and hence only the magnitude of the sectional force vector is reduced (see Fig. 7 (a)).
With the new calibration, both the axial and tangential forces per unit span achieved an even closer agreement with the blade resolved computations. In addition, the angle of the sectional force vector also achieved a closer agreement with the blade resolved computations, as a stronger correction was applied in the tangential direction than the axial direction (Fig. 7 (c)). However, despite these improvements Fig. 10 (c) shows that the angle of the sectional force vector still did not sufficiently match the blade resolved computations near the blade tip. This is because the correction factor was ultimately limited by the functional form ofF1. AsF1→0 as r/R→1, then bothF1,ax andF1,ta must tend to 0 as r/R→1, regardless of the calibration of F1 in either direction. This restriction
ultimately limits the loading distributions that can be achieved. In particular, the angle of the sectional force vector cannot increase above 90◦ when using this functional form of F1. This limitation is likely to become particularly problematic at higher tip speed ratios, as the angle of the incident flow relative to the rotor plane (φ) is small and hence the initial angle of the sectional force vector is close to 90◦. Hence, an alternative functional form ofF1 may be required to facilitate accurate actuator line computations at high tip speed ratios.
IX. POWER ANDTHRUSTCOEFFICIENTS
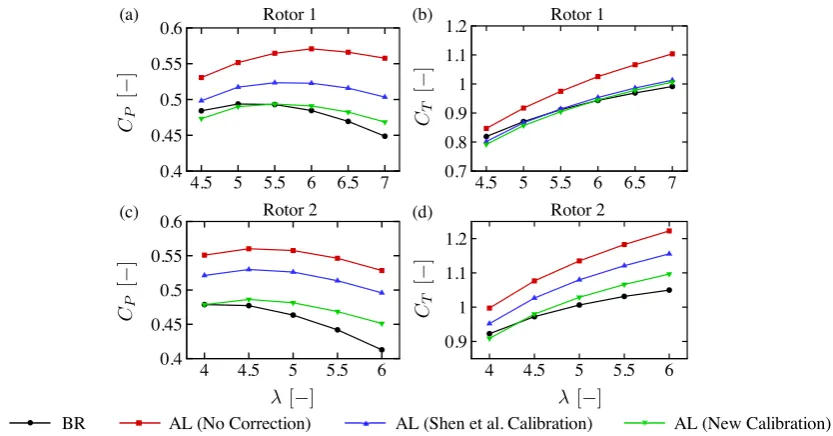
Fig. 11 shows the power and thrust coefficients (CP andCT
respectively) for Rotor 1 and Rotor 2 over the entire range of computed tip speed ratios. The power and thrust coefficients have been defined as:
CP =
P 1 2ρU∞3A
(4)
CT =
T 1 2ρU∞2A
(5)
0 10 20 30 40 50
(a) Rotor 1 (a)
-2 0 2 4 6 8
(b) Rotor 1
75 80 85 90 95
(c) Rotor 1
AL (New Calibration) BR AL (No Correction) AL (Shen et al. Calibration)
0.7 0.8 0.9 1 0
10 20 30 40 50 60
(d) Rotor 2
0.7 0.8 0.9 1 -2
0 2 4 6 8
(e) Rotor 2
0.7 0.8 0.9 1 80
85 90 95
(f) Rotor 2
Fig. 10. Axial force per unit span (a and d), tangential force per unit span (b and e) and angle of the force vector to the rotor plane (c and f), for Rotor 1 and Rotor 2 at a tip speed ratio of 5. BR refers to the blade resolved computations and AL refers to the actuator line computations.
4.5 5 5.5 6 6.5 7 0.4
0.45 0.5 0.55
0.6 Rotor 1 (a)
4 4.5 5 5.5 6 0.4
0.45 0.5 0.55 0.6
(c) Rotor 2
AL (New Calibration) BR AL (No Correction) AL (Shen et al. Calibration)
4.5 5 5.5 6 6.5 7 0.7
0.8 0.9 1 1.1 1.2
(b) Rotor 1
4 4.5 5 5.5 6 0.9
1 1.1 1.2
(d) Rotor 2
Fig. 11. Power and thrust coefficients for Rotor 1 and Rotor 2 using the blade resolved (BR) and actuator line (AL) approaches.
With no correction factor applied, the power and thrust coefficients were significantly over-predicted over the entire range of tip speed ratios, for both rotor designs. For example at λ = 5, CP was over-predicted by 11.72% for Rotor 1
and 20.3% for Rotor 2. With the correction factor applied (using the original calibration proposed by Shen et al. [4]), this error was greatly reduced. At λ= 5,CP was now only
over-predicted by 4.78% for Rotor 1 and 13.5% for Rotor 2. Further improvement to the thrust and power coefficients was achieved by using the new calibration presented in this work. At λ = 5, CP was now only under-predicted by 0.75% for
Rotor 1 and over-predicted by 3.86% for Rotor 2.
Despite the improvement in thrust and power coefficients at a tip speed ratio of 5, the newly calibrated correction factor
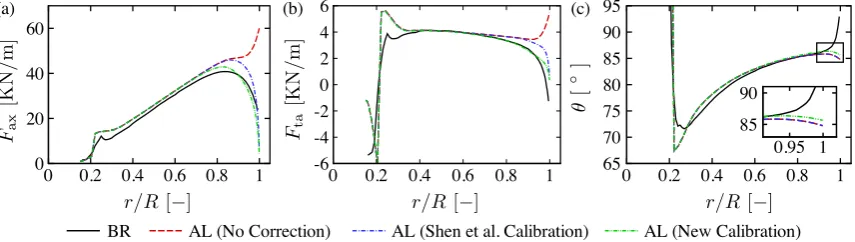
did not give as close an agreement at higher tip speed ratios, particularly for Rotor 2. To exemplify this discrepancy, Fig. 12 shows the axial and tangential forces per unit span for Rotor 2 at a tip speed ratio of 6. The actuator line computations all over-predicted the axial force per unit span both along the mid-span (0.4 < r/R < 0.7) and on the outboard sections (r/R >0.7). This cumulative over-prediction along the entire span resulted in the overall thrust coefficient over-prediction and may have arisen because spanwise flow effects become increasingly significant along the mid-span of the blade at higher tip speed ratios.
0 0.2 0.4 0.6 0.8 1 0
20 40 60 (a)
0 0.2 0.4 0.6 0.8 1 -6
-4 -2 0 2 4 6 (b)
0 0.2 0.4 0.6 0.8 1 65
70 75 80 85 90 95 (c)
AL (New Calibration) BR AL (No Correction) AL (Shen et al. Calibration)
0.95 1 85
90
Fig. 12. (a) Axial force per unit span, (b) tangential force per unit span and (c) angle of the force vector to the rotor plane, for Rotor 2 at a tip speed ratio of 6, using the blade resolved (BR) and actuator line (AL) approaches.
with the newly calibrated actuator line computations providing the closest match. This is because the functional form ofF1 only allows the tangential force per unit span to tend to zero at the very tip of the blade. Further improvement in the tangential direction is therefore only likely to be attainable by adopting an alternative functional form ofF1 that is not constrained to zero at the very tip.
X. CONCLUSION
Directionally dependent corrections for spanwise flow can significantly improve the accuracy of low order rotor model predictions of thrust and power. They allow the tangential force per unit span to drop off faster than the axial force per unit span, so the sectional force vector can reduce in magnitude and also rotate towards the streamwise direction. This rotation of the sectional force vector leads to better agreement with blade resolved computations (of the same rotor) and is consistent with the decrease in sectional lift coefficient and increase in the sectional drag coefficient that has been reported on the outboard sections of several wind turbines in the literature.
In this work, the error in the prediction of the rotor power coefficient was reduced by 10.97% and 16.44% respectively for two different tidal turbine rotor designs, when adopting a (calibrated) directionally dependent spanwise flow correction factor. The higher solidity design (Rotor 2) was found to require a stronger correction in both the axial and tangential directions than the lower solidity design (Rotor 1). This observation has been attributed to the stronger spanwise flow along the blade of Rotor 2 and suggests that high solidity tidal turbine rotor designs may also experience a stronger reduction in blade loading on the outboard sections, than low solidity designs.
The spanwise flow correction factor adopted in this work was not as successful at higher tip speed ratios, as the functional form of F1 is constrained to approach zero at the very tip of the blade. It has been suggested that a new functional form ofF1may lead to further improvements, since the sectional force vector angle can then increase above 90◦ and be better able to match observed tip loading distributions.
ACKNOWLEDGMENT
The author would like to thank EPSRC and Uniper for fund-ing the CASE-Studentship for this project and the Advanced
Research Computing (ARC) at the University of Oxford, where the computations were performed.
REFERENCES
[1] A. Wimshurst and R. H. J. Willden, “Extracting lift and drag polars from blade resolved computational fluid dynamics for use in actuator line modelling of horizontal axis turbines,”Wind Energy, vol. 20, no. 5, pp. 815–833, 2017. [Online]. Available: http://dx.doi.org/10.1002/we.2065 [2] A. Wimshurst and R. H. J. Willden, “Analysis of a tip correction
for horizontal axis turbines,” Wind Energy, 2017, Accepted for publication. Early view available online. [Online]. Available: http: //dx.doi.org/10.1002/we.2106
[3] C. Lindenburg, “Investigation into rotor blade aerodynamics,” Energy Research Centre of the Netherlands (ECN), Tech. Rep. ECN–C–03–025, 2003.
[4] W. Shen, R. Mikkelsen, J. Sørenson, and C. Bak, “Tip loss corrections for wind turbine computations,”Wind Energy, vol. 8, pp. 457–475, 2005. [5] J. G. Schepers, K. Boorsma, T. Cho, S. Gomez-Iradi, P. Schaffarczyk, A. Jeromin, W. Z. Shen, T. Lutz, K. Meister, B. Stoevesandt, S. Schreck, D. Micallef, R. Pereira, T. Sant, H. A. Madsen, and N. Sørensen, “Final report of IEA task 29, Mexnext (phase 1): Analysis of MEXICO wind tunnel measurements,” Energy Research Centre of the Netherlands (ECN), Tech. Rep. ECN-E12-004, February 2012.
[6] A. Betz, “Schraubenpropeller mit geringstem Energieverlust. Mit einem Zusatz von L. Prandtl,” Nachrichten von der Gesellschaft der Wis-senschaften zu Gottingen, Mathematisch-Physikalische Klasse, pp. 193– 217, 1919.
[7] J. Schluntz and R. H. J. Willden, “The effect of blockage on tidal turbine rotor design and performance,”Renewable Energy, vol. 81, pp. 432–441, 2015.
[8] A. Wimshurst and R. H. J. Willden, “Computational analysis of blockage designed tidal turbine rotors,” inProceedings of the 2nd International Conference on Renewable Energies Offshore (RENEW 2016), Lisbon, Portugal, October 2016, pp. 587–597.
[9] J. N. Sørenson and W. Z. Shen, “Numerical modelling of wind turbine wakes,”Journal of Fluids Engineering, vol. 124(2), pp. 393–399, 2002. [10] J. Schluntz and R. Willden, “An actuator line based method with novel blade flow field coupling based on potential flow equivalence,”Wind Energy, vol. 18, no. 8, pp. 1469 – 1485, 2014.
[11] N. Troldborg, “Actuator line modeling of wind turbine wakes,” Ph.D. dissertation, Technical University of Denmark, 2009.
[12] F. R. Menter, “Two-equation eddy-viscosity turbulence models for engineering applications,” AIAA Journal, vol. 32(8), pp. 1598–1605, 1994.
[13] P. K. Sweby, “High resolution schemes using flux limiters for hyperbolic conservation laws,”SIAM Journal on Numerical Analysis, vol. 21, pp. 995–1011, 1984.
[14] S. V. Patankar,Numerical Heat Transfer and Fluid Flow. Washington DC USA: Hemisphere Publishing Corporation, 1980.
[15] S. Gant and T. Stallard, “Modelling a tidal turbine in unsteady flow,” in
[16] A. Wimshurst and R. H. J. Willden, “Validation of an actuator line method for tidal turbine rotors,” inThe 26th International Ocean and Polar Engineering Conference. Rhodes (Rodos), Greece: ISOPE, 2016, TPC-2016-0825.
[17] K. Nilsson, W. Z. Shen, J. N. Sørensen, S. Breton, and S. Ivanell, “Validation of the actuator line method using near wake measurements of the MEXICO rotor,”Wind Energy, vol. 18, pp. 499–514, 2015. [18] J. Johansen and N. N. Sørenson, “Aerofoil characteristics from 3D CFD
rotor computations,”Wind Energy, vol. 7, pp. 283–294, 2004. [19] W. Shen, M. Hansen, and J. Sørenson, “Determination of the angle of